Brandon, FL Investment Properties for Sale
Browse homes for sale and investment properties in Brandon, FL. Refine your search by price, property type, or more.
Best cash flowing properties in Brandon, FL
Active
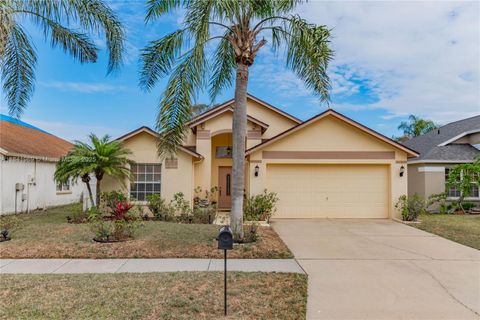
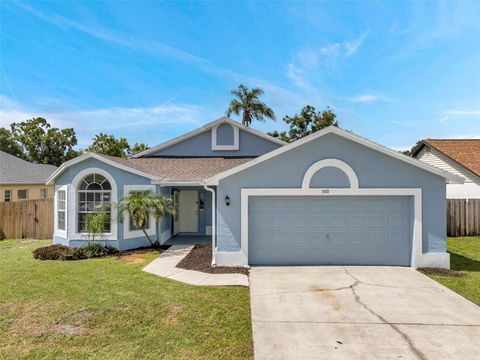
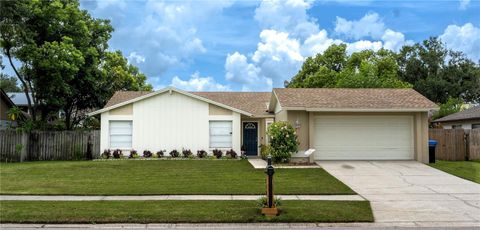
$360,000
3
bds
|
2
ba
|
1,471
sqft
|
built
1997
1706 Kirtley Dr, Brandon, FL 33511
$-310
Cash flow
-4.5%
Cash-on-Cash Return
5.1%
Cap rate
0.7%
Rent to Value Ratio
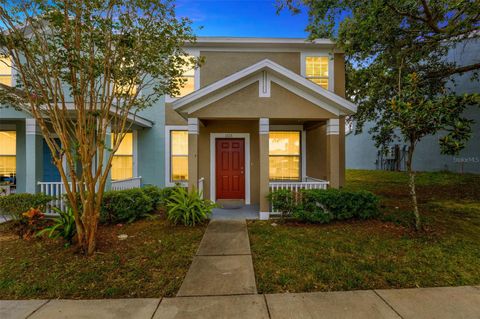
Active
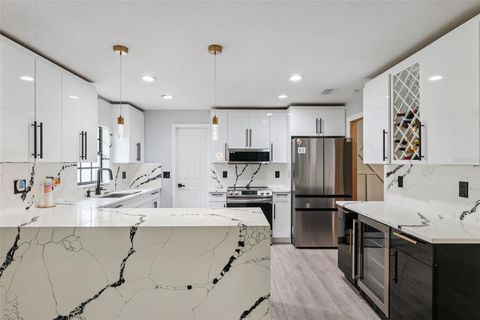
$235,000
3
bds
|
3
ba
|
1,312
sqft
|
built
2005
1515 Deer Tree Ln, Brandon, FL 33510
$-310
Cash flow
-6.9%
Cash-on-Cash Return
4.6%
Cap rate
0.9%
Rent to Value Ratio
101 out of 109 properties for sale in Brandon, FL
Limited Results Shown
Create a free account, or log in to reveal all property listings and enjoy the complete experience.
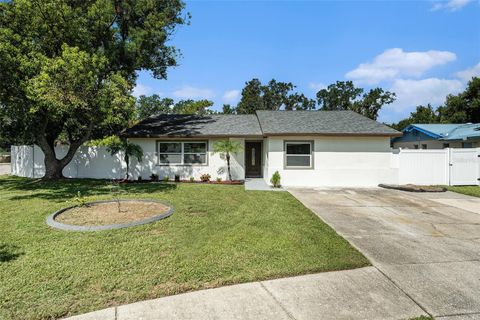
Active
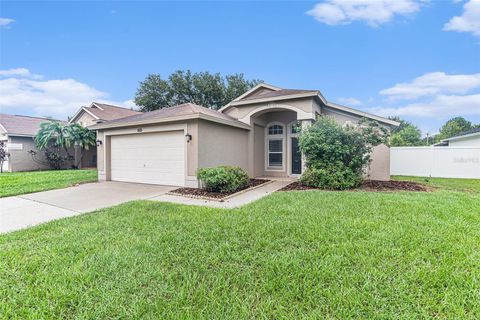
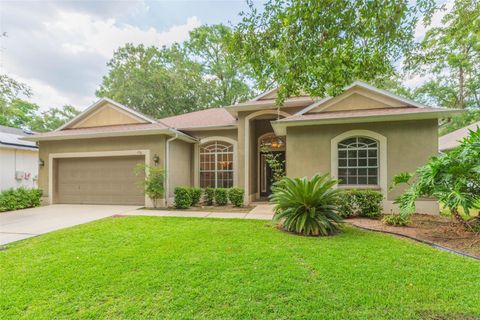
$365,000
4
bds
|
2
ba
|
1,350
sqft
|
built
1980
3707 Coppertree Cir, Brandon, FL 33511
$-687
Cash flow
-9.8%
Cash-on-Cash Return
3.9%
Cap rate
0.5%
Rent to Value Ratio
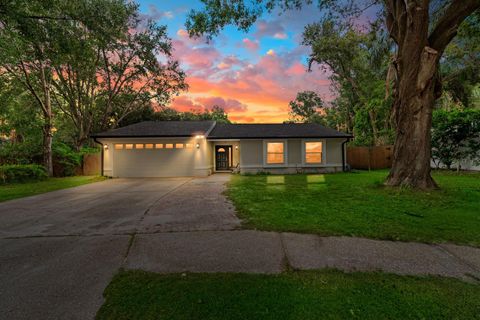
Active
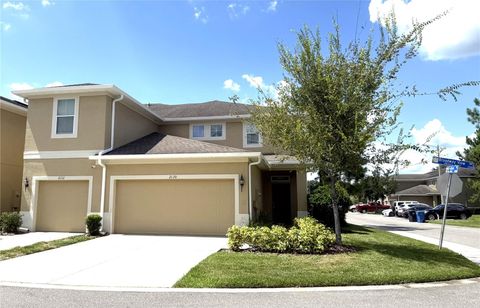
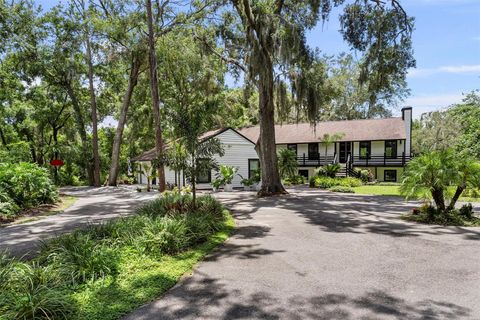
$364,900
3
bds
|
2
ba
|
1,290
sqft
|
built
1986
1421 Shadow Bay Ln, Brandon, FL 33510
$-529
Cash flow
-7.6%
Cash-on-Cash Return
4.4%
Cap rate
0.6%
Rent to Value Ratio
Active
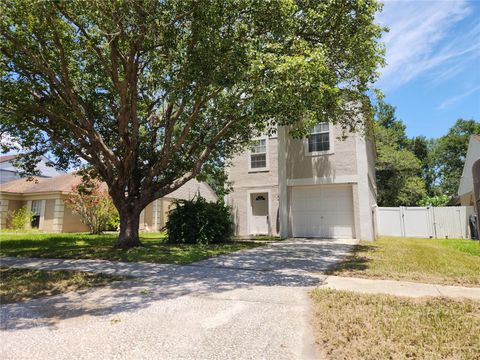
$279,900
3
bds
|
1
ba
|
1,023
sqft
|
built
1985
1242 Mohrlake Dr, Brandon, FL 33511
$-394
Cash flow
-7.3%
Cash-on-Cash Return
4.5%
Cap rate
0.7%
Rent to Value Ratio

Active
$499,000
4
bds
|
3
ba
|
2,282
sqft
|
built
1993
2026 Chelam Way, Brandon, FL 33511
$-890
Cash flow
-9.3%
Cash-on-Cash Return
4.0%
Cap rate
0.6%
Rent to Value Ratio
Active
$390,000
3
bds
|
2
ba
|
1,770
sqft
|
built
1983
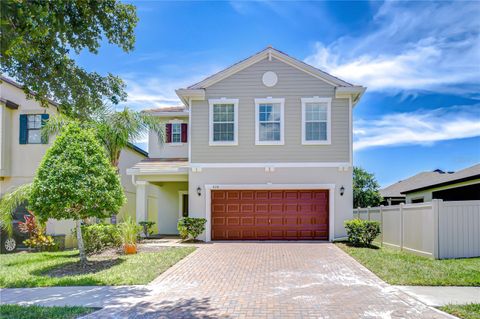
628 Shady Nook Dr, Brandon, FL 33511
$-488
Cash flow
-6.5%
Cash-on-Cash Return
4.6%
Cap rate
0.7%
Rent to Value Ratio
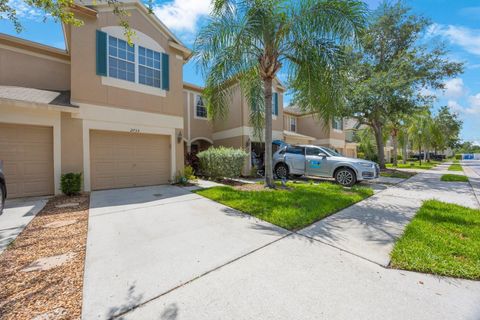
Active
$189,000
2
bds
|
3
ba
|
1,110
sqft
|
built
2002
2417 Lake Woodberry Cir, Brandon, FL 33510
$-323
Cash flow
-8.9%
Cash-on-Cash Return
4.1%
Cap rate
1.0%
Rent to Value Ratio
Active
$315,000
1
bds
|
0
ba
|
1,144
sqft
|
built
1968
110 Karde Ln, Brandon, FL 33510
$-1,217
Cash flow
-20.2%
Cash-on-Cash Return
1.5%
Cap rate
0.4%
Rent to Value Ratio
Active
$319,000
3
bds
|
2
ba
|
1,291
sqft
|
built
1973
408 Brenda Dr, Brandon, FL 33510
$-408
Cash flow
-6.7%
Cash-on-Cash Return
4.6%
Cap rate
0.7%
Rent to Value Ratio
Active
$450,000
3
bds
|
2
ba
|
1,669
sqft
|
built
1969
120 Windy Cir, Brandon, FL 33511
$-1,048
Cash flow
-12.2%
Cash-on-Cash Return
3.4%
Cap rate
0.6%
Rent to Value Ratio
Active
$1,250,000
7
bds
|
5
ba
|
4,571
sqft
|
built
2012
121 Falling Water Dr, Brandon, FL 33511
$-3,324
Cash flow
-13.9%
Cash-on-Cash Return
3.0%
Cap rate
0.5%
Rent to Value Ratio
Active
$325,000
3
bds
|
2
ba
|
1,154
sqft
|
built
1990
608 Chilt Dr, Brandon, FL 33510
$-376
Cash flow
-6.0%
Cash-on-Cash Return
4.8%
Cap rate
0.7%
Rent to Value Ratio
Active
$749,900
4
bds
|
3
ba
|
3,356
sqft
|
built
2005
2906 Hillside Ramble Dr, Brandon, FL 33511
$-2,414
Cash flow
-16.8%
Cash-on-Cash Return
2.3%
Cap rate
0.5%
Rent to Value Ratio
Active
$399,900
4
bds
|
2
ba
|
2,015
sqft
|
built
1986
1901 White Cedar Way, Brandon, FL 33511
$-616
Cash flow
-8.0%
Cash-on-Cash Return
4.3%
Cap rate
0.6%
Rent to Value Ratio
Active
$409,995
4
bds
|
2
ba
|
1,717
sqft
|
built
1974
1807 Green Lawn St, Brandon, FL 33511
$-858
Cash flow
-10.9%
Cash-on-Cash Return
3.6%
Cap rate
0.6%
Rent to Value Ratio
Active
$1,998,900
6
bds
|
7
ba
|
6,196
sqft
|
built
2009
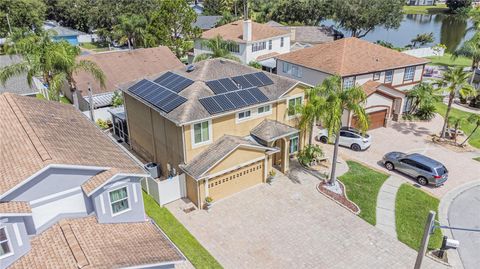
638 Limona Woods Dr, Brandon, FL 33510
$-5,297
Cash flow
-13.8%
Cash-on-Cash Return
3.0%
Cap rate
0.4%
Rent to Value Ratio
Active
$399,900
4
bds
|
2
ba
|
2,080
sqft
|
built
1988
1510 Vernon Ct, Brandon, FL 33511
$-961
Cash flow
-12.5%
Cash-on-Cash Return
3.3%
Cap rate
0.6%
Rent to Value Ratio
Active
$439,000
4
bds
|
2
ba
|
1,663
sqft
|
built
1975
410 Larrie Ellen Way, Brandon, FL 33511
$-995
Cash flow
-11.8%
Cash-on-Cash Return
3.4%
Cap rate
0.5%
Rent to Value Ratio
Active
$359,900
3
bds
|
2
ba
|
1,527
sqft
|
built
1997
1615 Hulett Dr, Brandon, FL 33511
$-587
Cash flow
-8.5%
Cash-on-Cash Return
4.2%
Cap rate
0.7%
Rent to Value Ratio
Active
$335,000
3
bds
|
3
ba
|
1,860
sqft
|
built
2016
2130 Broadway View Ave, Brandon, FL 33510
$-680
Cash flow
-10.6%
Cash-on-Cash Return
3.7%
Cap rate
0.7%
Rent to Value Ratio
Active
$425,000
3
bds
|
2
ba
|
1,957
sqft
|
built
2000
2617 Pegasus Ct, Brandon, FL 33511
$-809
Cash flow
-9.9%
Cash-on-Cash Return
3.9%
Cap rate
0.6%
Rent to Value Ratio
Active
$430,000
3
bds
|
2
ba
|
1,722
sqft
|
built
1973
107 Valley Cir, Brandon, FL 33510
$-1,011
Cash flow
-12.3%
Cash-on-Cash Return
3.3%
Cap rate
0.5%
Rent to Value Ratio
Active
$399,900
3
bds
|
2
ba
|
1,414
sqft
|
built
1985
747 Stillview Cir, Brandon, FL 33510
$-608
Cash flow
-7.9%
Cash-on-Cash Return
4.3%
Cap rate
0.6%
Rent to Value Ratio
Active
$980,000
4
bds
|
4
ba
|
3,401
sqft
|
built
2022
115 Brookover Ln, Brandon, FL 33511
$-3,344
Cash flow
-17.8%
Cash-on-Cash Return
2.1%
Cap rate
0.4%
Rent to Value Ratio
Active
$394,490
3
bds
|
2
ba
|
1,674
sqft
|
built
1984
419 Bloomingfield Dr, Brandon, FL 33511
$-767
Cash flow
-10.1%
Cash-on-Cash Return
3.8%
Cap rate
0.6%
Rent to Value Ratio
Active
$430,000
3
bds
|
2
ba
|
1,943
sqft
|
built
2005
228 Taylor Bay Ln, Brandon, FL 33510
$-824
Cash flow
-10.0%
Cash-on-Cash Return
3.8%
Cap rate
0.7%
Rent to Value Ratio
Active
$1,999,000
6
bds
|
5
ba
|
3,404
sqft
|
built
1980
900 Oak Hollow Pl, Brandon, FL 33510
$-7,622
Cash flow
-19.9%
Cash-on-Cash Return
1.6%
Cap rate
0.3%
Rent to Value Ratio
Active
$365,000
3
bds
|
3
ba
|
1,481
sqft
|
built
1986
4009 Forecast Dr, Brandon, FL 33511
$-811
Cash flow
-11.6%
Cash-on-Cash Return
3.5%
Cap rate
0.5%
Rent to Value Ratio
Active
$267,500
3
bds
|
3
ba
|
1,718
sqft
|
built
2004
2733 Conch Hollow Dr, Brandon, FL 33511
$-703
Cash flow
-13.7%
Cash-on-Cash Return
3.0%
Cap rate
0.7%
Rent to Value Ratio
Active
$389,900
5
bds
|
3
ba
|
1,768
sqft
|
built
1962
408 Blueberry Ln, Brandon, FL 33510
$-672
Cash flow
-9.0%
Cash-on-Cash Return
4.1%
Cap rate
0.6%
Rent to Value Ratio
Active
$329,900
3
bds
|
3
ba
|
1,525
sqft
|
built
2022
2760 Emory Sound Pl, Brandon, FL 33510
$-740
Cash flow
-11.7%
Cash-on-Cash Return
3.5%
Cap rate
0.7%
Rent to Value Ratio
Active
$445,000
4
bds
|
3
ba
|
1,763
sqft
|
built
1974
3731 Southview Dr, Brandon, FL 33511
$-954
Cash flow
-11.2%
Cash-on-Cash Return
3.6%
Cap rate
0.6%
Rent to Value Ratio
Active
$390,000
3
bds
|
2
ba
|
2,311
sqft
|
built
1974
1214 Mitchell St, Brandon, FL 33511
$-777
Cash flow
-10.4%
Cash-on-Cash Return
3.8%
Cap rate
0.6%
Rent to Value Ratio
Active
$344,000
3
bds
|
2
ba
|
1,344
sqft
|
built
1989
1741 Elk Spring Dr, Brandon, FL 33511
$-583
Cash flow
-8.8%
Cash-on-Cash Return
4.1%
Cap rate
0.7%
Rent to Value Ratio
Active
$560,000
5
bds
|
3
ba
|
2,880
sqft
|
built
1990
512 Pinewalk Dr, Brandon, FL 33510
$-1,507
Cash flow
-14.0%
Cash-on-Cash Return
2.9%
Cap rate
0.5%
Rent to Value Ratio
Active
$449,900
4
bds
|
2
ba
|
1,906
sqft
|
built
1973
123 Jeffrey Dr, Brandon, FL 33511
$-1,224
Cash flow
-14.2%
Cash-on-Cash Return
2.9%
Cap rate
0.5%
Rent to Value Ratio
Active
$420,000
3
bds
|
3
ba
|
2,157
sqft
|
built
2016
828 Terra Vista St, Brandon, FL 33511
$-1,046
Cash flow
-13.0%
Cash-on-Cash Return
3.2%
Cap rate
0.6%
Rent to Value Ratio
Active
$485,000
4
bds
|
3
ba
|
2,424
sqft
|
built
2000
1205 Sweet Gum Dr, Brandon, FL 33511
$-930
Cash flow
-10.0%
Cash-on-Cash Return
3.8%
Cap rate
0.5%
Rent to Value Ratio
Active
$219,750
2
bds
|
2
ba
|
1,159
sqft
|
built
1998
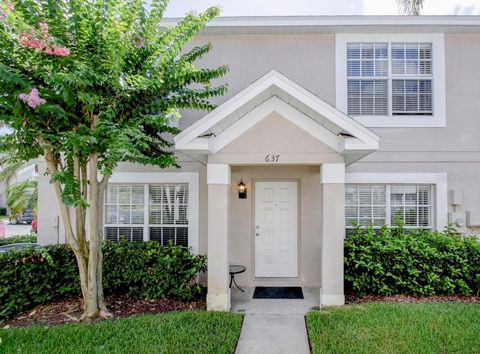
637 Kensington Lake Cir, Brandon, FL 33511
$-417
Cash flow
-9.9%
Cash-on-Cash Return
3.9%
Cap rate
0.8%
Rent to Value Ratio