
$1,179,000
Investment Summary
- Monthly Cash Flow
- -$4,616
- Cap Rate
- 1.0%
- Cash-on-Cash Return
- -20.4%
- Debt Coverage Ratio
- 0.17
- Internal Rate of Return (5 years)
- -15.7%
Cash Flow
Net Operating Income (NOI) minus mortgage payments.
Calculation:
NOI - Mortgage Payments
Cap Rate (Market Value)
Capitalization Rate is a rate of return that compares the yearly Net Operating Income (NOI) to the market value.
Calculation:
NOI / Market Value
Cash-on-Cash Return (CoC)
Annual Cash Flow / Cash Invested
Calculation:
Annual cash flow divided by initial cash invested.
Debt Coverage Ratio (DCR)
Net Operating Income (NOI) divided by total debt payments.
Calculation:
NOI / Total Debt Payments
Internal Rate of Return (IRR)
A metric for assessing profitability over time. IRR is the discount rate at which the net present value (NPV) of all future cash flows (positive and negative) from an investment equals zero — including both periodic cash flow (such as rent) and a projected sale at the end of the holding period. It represents the expected annualized return, accounting for income, expenses, and the recovery of capital through a future sale.
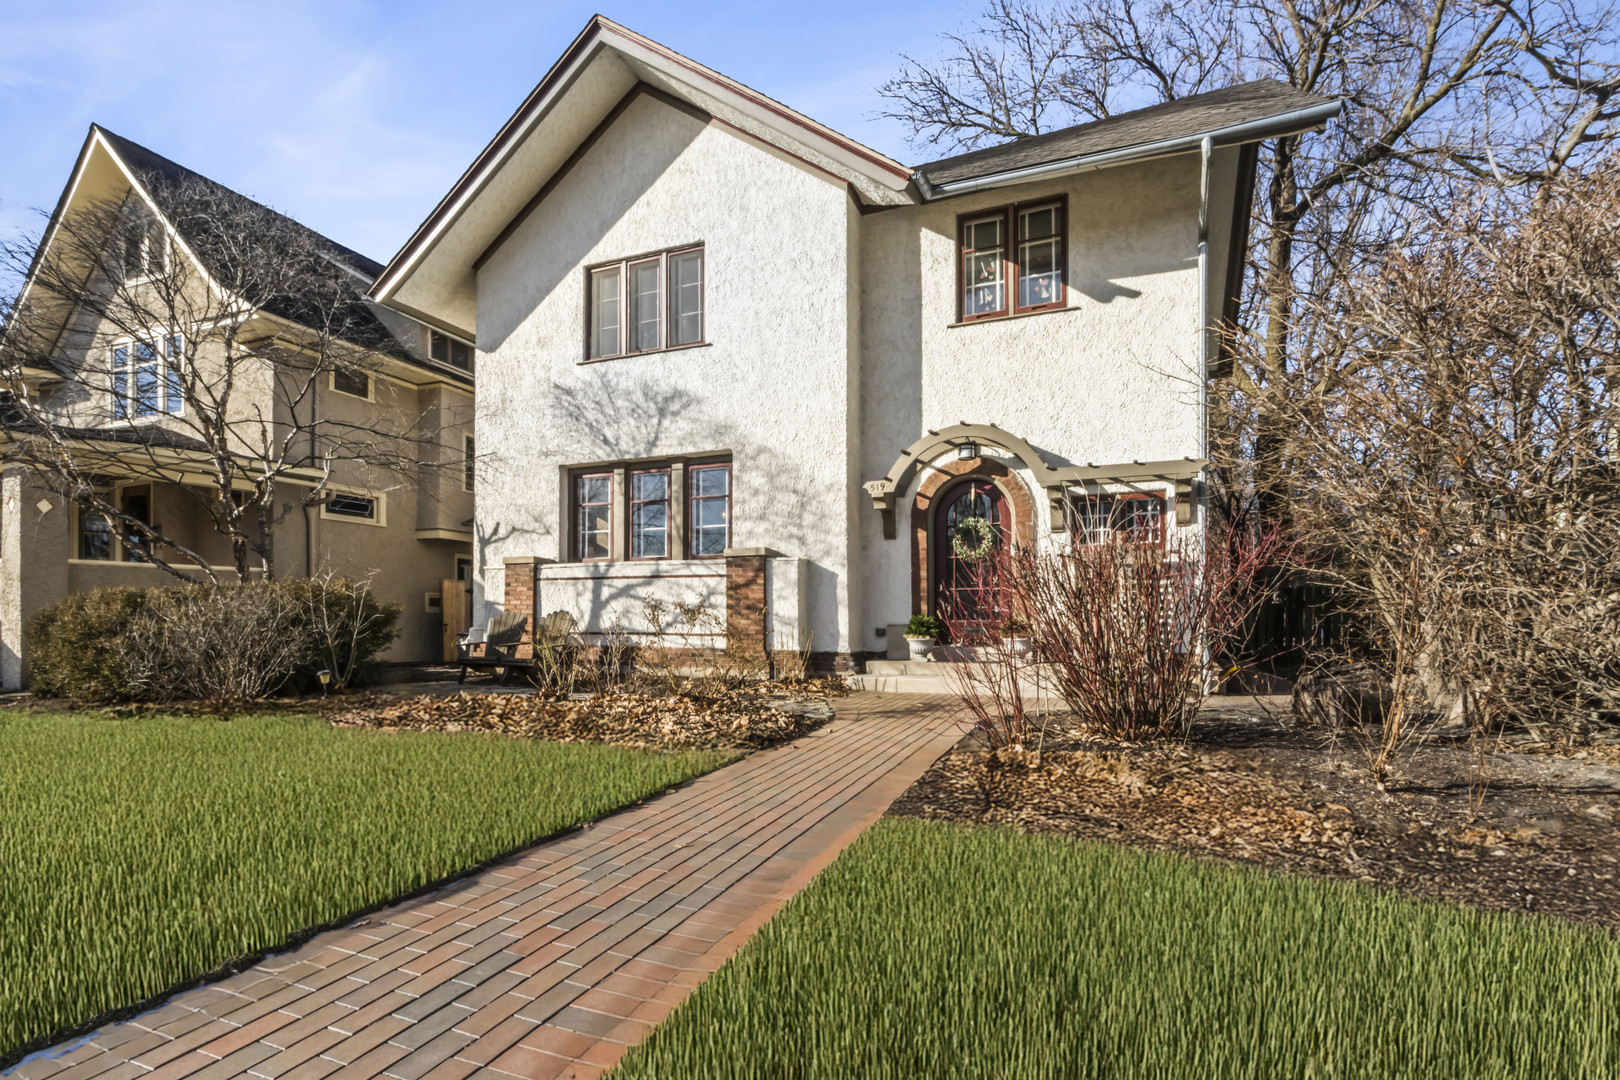
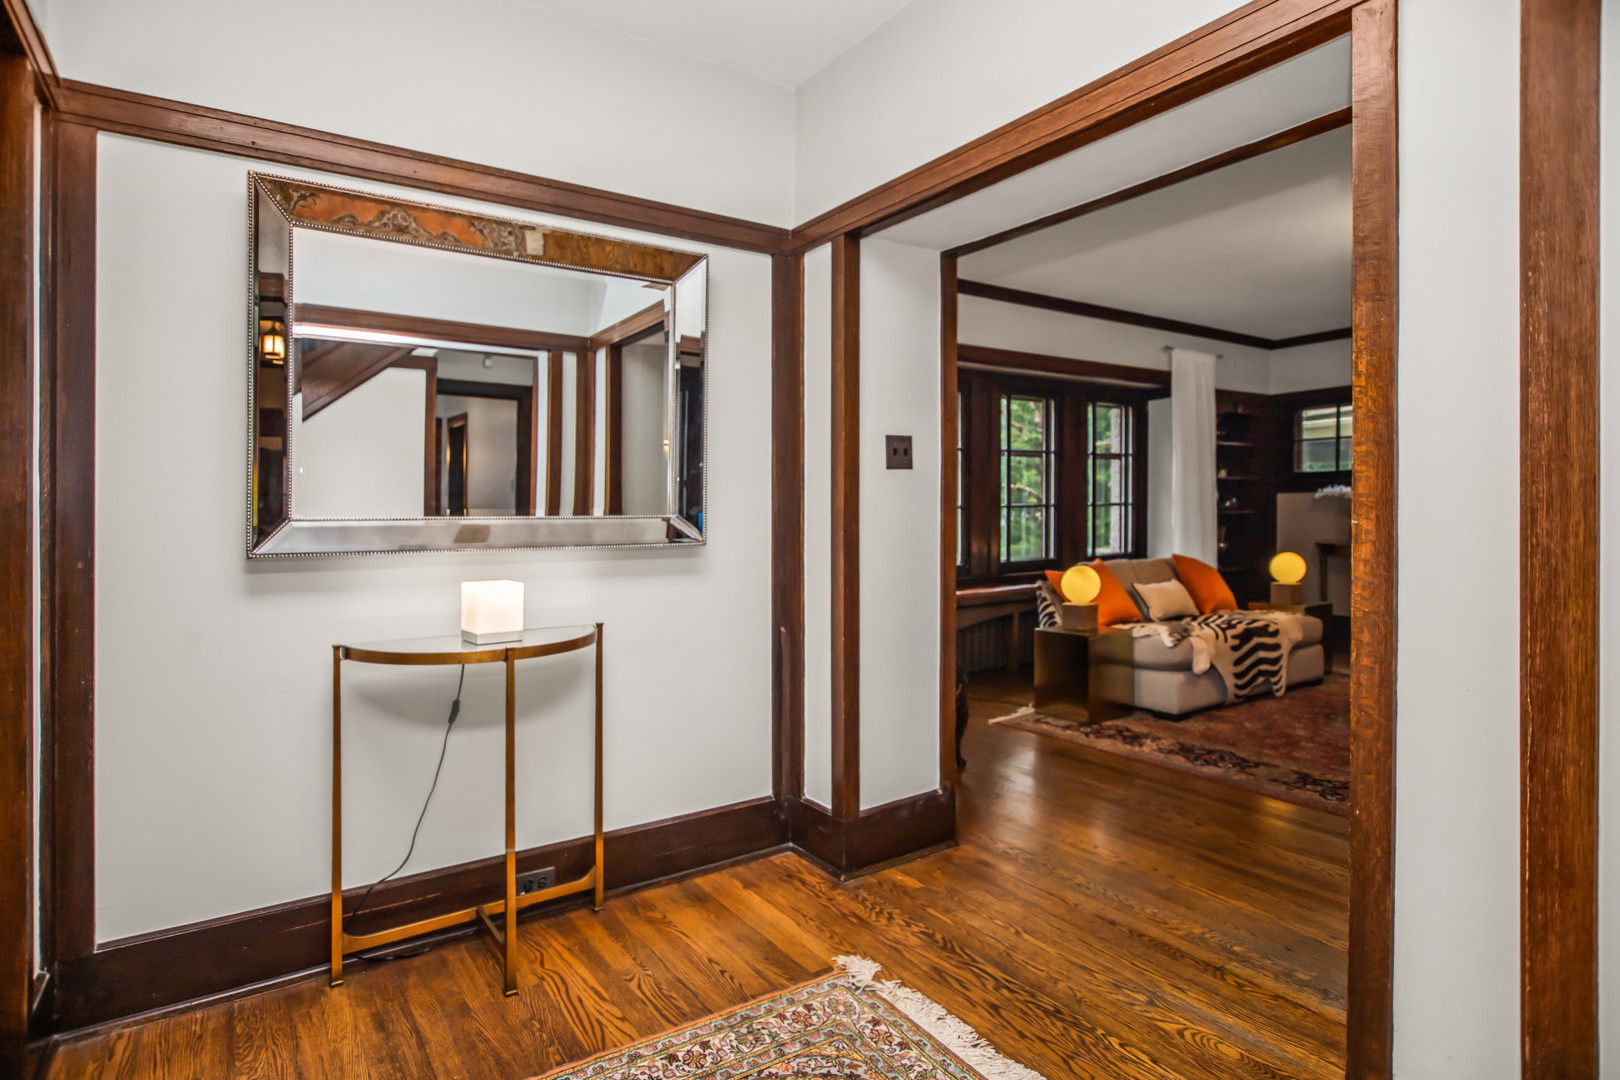
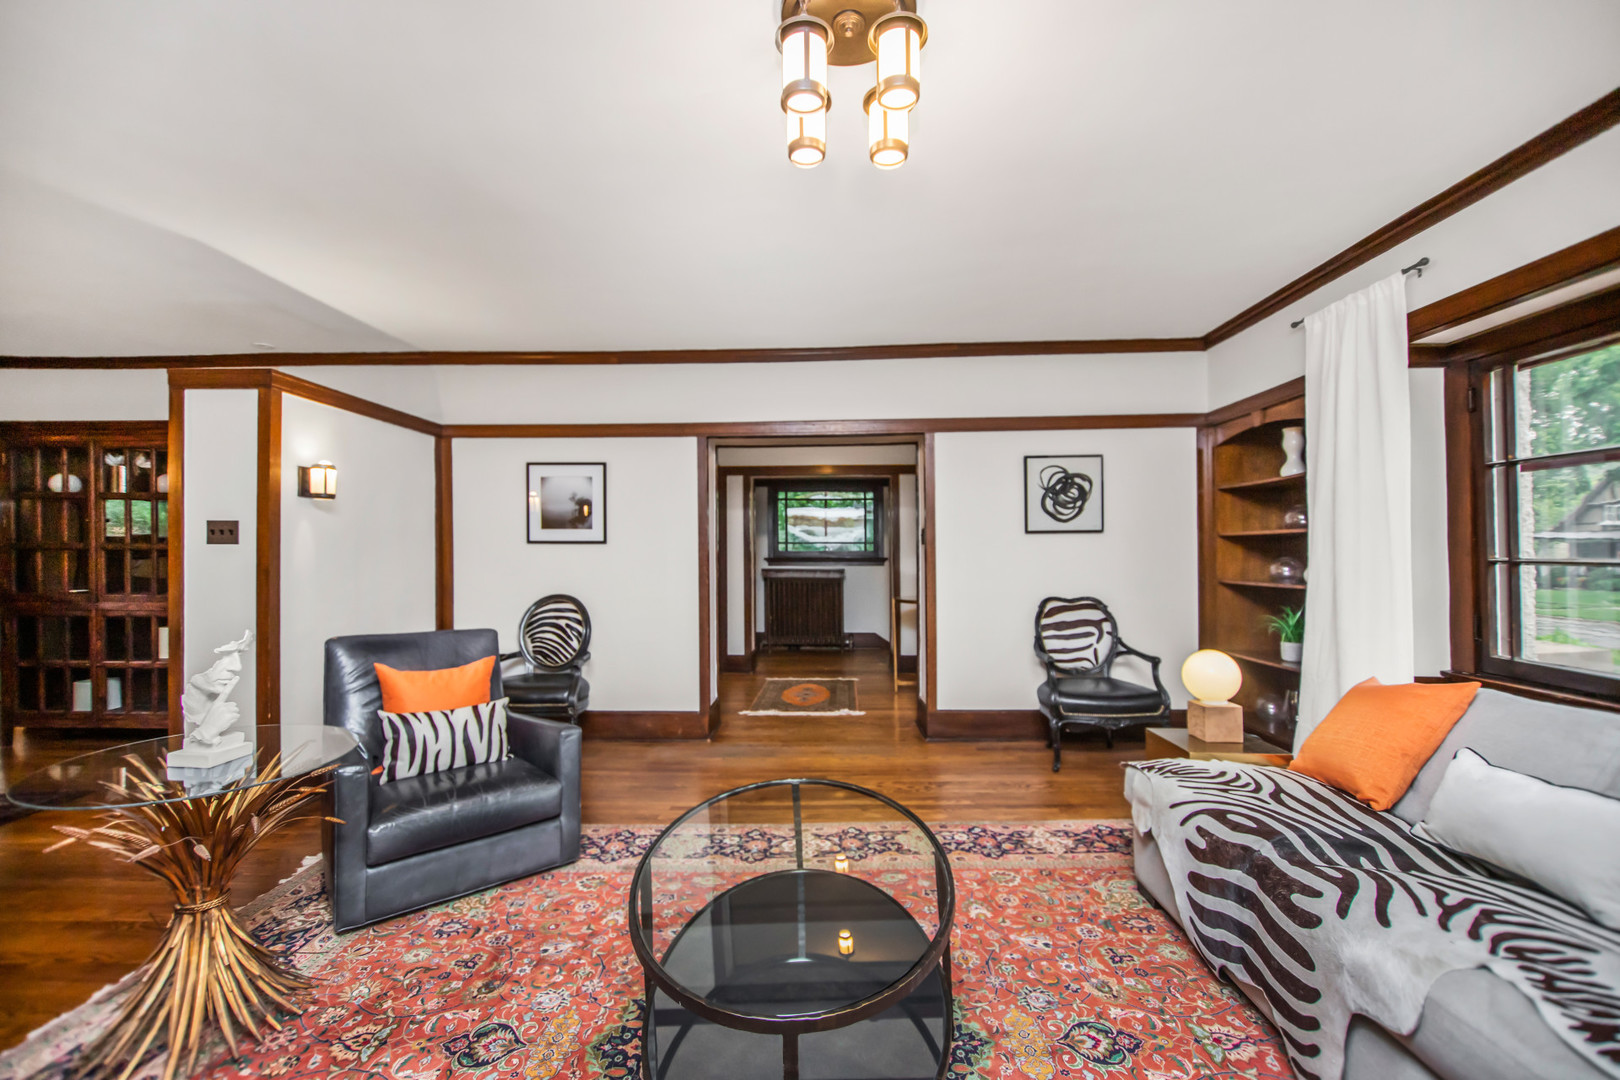
Property Description
Spectacular John W. Morgan historic home built in 1910 by renowned architect Thornton Herr. 4 bedrooms and 3 full bathrooms in main house plus stunning additional space in recently built coach house apartment, designed and built by Oak Park's own Elements Architectural firm. Mediterranean influenced Prairie style architecture gives this home the perfect blend of aspirational glamour and friendly design. First floor features generous foyer open to sun-drenched, jumbo-sized living room with stylish mantle fireplace, open floorplan to extra-large formal dining room with built-ins galore and French doors to access cozy office/den. Light, bright, huge, and fully updated kitchen with high end finishes and appliances, extra long Island with plenty of storage, loads of seating, custom cabinets, cleverly designed 'mud room' storage lockers, and banks of windows to enjoy views of the truly outstanding yard and patio. First floor also features full bathroom with walk-in shower and stylish craftsman finishes. Second floor has 4 bedrooms and 2 updated full bathrooms including recently renovated bathroom in primary suite with heated floors, herringbone marble tile, walk in shower, and designer features. Semi-finished basement with exposed brick and timber ceilings is very large, fun hang out space with cool Industrial vibes plus ceiling height to accommodate equipment for a great workout area. Backyard is a star with large minimalistic infinity deck off the kitchen, plenty of green space for play, show-stopping patio with custom pergola, built in grill/ buffet in Tuscan high style that's perfectly on point with the home's original Mediterranean arches and architectural details. The recently built coach house garage replicates the main house's original Mediterranean Prairie architectural style down to the last luxurious detail, a rarely available feature! Coach house 'lobby' has dramatic double doors that open to patio/yard...every host's dream indoor/outdoor party space featuring polished concrete floors and discrete access to 2 car garage. The upstairs is finished to perfection with wide plank wood floors, cathedral ceilings, built in bunk-bed alcoves, totally open floorplan, custom cabinets and long quartz buffet, French doors to balcony overlooking yard and patio, 2nd washer/dryer, and gorgeous full bathroom with walk in shower and high end finishes. Recent improvements include solar panels, new sewer line all the way to the street, brick pavers on front and side walkways, new brick back patio, pergola and built in grill, front stone patio, landscape design, exterior lighting, cedar fence, dual French drain sump pump with battery back up, updated basement, renovated primary suite bathroom.recent tax appeal won with reduction in 2nd installment. Beautiful, distinctive, move-!in ready home with space to spare, hyper-convenient central location, prime spot to enjoy all the best of Oak Park, highly sought after block, walk to schools, parks, Green line, shopping, and more!
Build Your Team
Quickly find investor-friendly professionals who can help you succeed in real estate investing at any stage of the investing journey.


Agents
Match with investor-friendly agents who can help you find, analyze, and close your next deal


Lenders
Get the best funding…find investor-friendly lenders who specialize in your deal strategy


Property Managers
Transition to passive investing. Find a trusted property management partnership that lasts.


Tax Pros & Accountants
Taxes and financial reporting made easy—find experts to create tax savings strategies, file taxes, and more
Location
Property Details
Parking
- Description: Garage Door Opener(s), Transmitter(s)
- Details: Garage Door Opener, On Site, Detached, Garage
- Garage Spaces: 2
- Spaces Total: 2
Bedroom Information
- # of Bedrooms: 4
Bathroom Information
- # of Baths (Full): 4
- # of Baths (Total): 4.0
Interior Features
- # of Rooms: 8
- # of Stories: 2
- Basement: Yes
- Basement Description: Partially Finished, Storage Space, Full
- Fireplace: Yes
Exterior Features
- Exterior Walls Materials: Stucco
Land Information
- Land Use: Residential
- Land Use Subtype: Single Family Residential
Lot Information
- Parcel ID: 1606423020
- Lot Size: 0 sqft
Property Information
- Property Type: Single Family Residence
- Year Built: 1910
Tax Information
- Annual Tax: $34,806
Utilities
- Heating: Natural Gas, Radiant Floor
Location
- County: Cook
Listing Details
Investment Summary
- Monthly Cash Flow
- -$4,616
- Cap Rate
- 1.0%
- Cash-on-Cash Return
- -20.4%
- Debt Coverage Ratio
- 0.17
- Internal Rate of Return (5 years)
- -15.7%
Cash Flow
Net Operating Income (NOI) minus mortgage payments.
Calculation:
NOI - Mortgage Payments
Cap Rate (Market Value)
Capitalization Rate is a rate of return that compares the yearly Net Operating Income (NOI) to the market value.
Calculation:
NOI / Market Value
Cash-on-Cash Return (CoC)
Annual Cash Flow / Cash Invested
Calculation:
Annual cash flow divided by initial cash invested.
Debt Coverage Ratio (DCR)
Net Operating Income (NOI) divided by total debt payments.
Calculation:
NOI / Total Debt Payments
Internal Rate of Return (IRR)
A metric for assessing profitability over time. IRR is the discount rate at which the net present value (NPV) of all future cash flows (positive and negative) from an investment equals zero — including both periodic cash flow (such as rent) and a projected sale at the end of the holding period. It represents the expected annualized return, accounting for income, expenses, and the recovery of capital through a future sale.
Purchase Details
Purchase PriceThe price paid for the property. Purchase price:
| $1,179,000 |
|---|---|
Amount FinancedThe amount of the purchase financed through a loan. Amount financed:
| -$943,200 |
Down paymentThe initial payment made towards the purchase. Down payment:
| $235,800 |
Closing CostsFees and expenses associated with purchasing a property, typically ranging from 2% to 5% of the home’s purchase price, paid at the end of a home purchase to cover services like lending, title transfer, and taxes. Closing costs:
| $35,370 |
Rehab CostsCosts incurred to repair or improve the property, including: roof, flooring, exterior siding, kitchen, exterior paint, bathrooms, etc. Rehab costs:
| $0 |
Initial Cash InvestedThe total initial cash invested in the property. Calculation:Down payment + Buying costs + Rehab costs Initial cash invested:
| $271,170 |
Square Feet (SQFT)The total square footage of the property. Square feet:
| 0 |
Cost Per Square FootCost per square foot of the property. Calculation:Purchase Price / Square Feet Cost per square foot:
| n/a |
Monthly Rent Per Square FootMonthly rent divided by the number of square feet. This ratio helps investors compare rental income efficiency across properties, markets, and unit sizes Calculation:Monthly Rent / Square Feet Monthly rent per square foot:
| n/a |
Financing Details
Loan AmountThe total sum of money borrowed from a lender to finance a property purchase. Calculation:Purchase Price - Down Payment
Loan amount:
| $943,200 |
|---|---|
Loan to Value Ratio (LTV)Loan amount divided by the market value of the property. Calculation:Loan Amount / Market Value
Loan to value ratio:
| 80.0% |
Loan TypeThe type of loan (e.g., fixed, adjustable).
Loan type:
| Amortizing |
TermThe loan repayment period in years.
Term:
| 30 years |
Interest RateThe percentage a lender charges on the borrowed amount of a loan, determining the cost of borrowing money.
Interest rate:
| 5.875% |
Principal & Interest (PI)The principal is the portion of the loan payment that reduces the loan balance. The interest is the lender's charge for borrowing money. Calculation:(P * r * (1 + r) ** n) / ((1 + r) ** n - 1) Where:
P = Loan amount (principal)
Principal & interest:
| $5,579 |
Property TaxesAnnual taxes levied by local governments on real estate properties. These taxes fund public services like schools, roads, and emergency services.
Property tax:
| $2,901 |
InsuranceThe costs for insurance coverage to protect against financial losses due to risks like fire, natural disasters, theft, liability, or tenant-related damages. Calculation:Assumes 7% of gross rental income, unless insurance rates are specified.
Insurance:
| $392 |
Private Mortgage Insurance (PMI)A fee that borrowers pay when they take out a conventional loan with a loan-to-value (LTV) ratio above 80%.
Private mortgage insurance (PMI):
| $0 |
Monthly PaymentThe fixed amount a borrower pays each month to repay a loan. It typically includes principal and interest (P&I) and may also cover property taxes, insurance, HOA fees, and PMI if escrowed. Monthly payment:
| $8,872 |
Operating Income
| % Rent | Monthly | Yearly | |
|---|---|---|---|
Gross RentThe total rental income received from tenants before deducting any expenses. Includes base rent, late fees, pet fees, parking fees, and other recurring charges.
Gross rent:
| $5,600 | $67,200 | |
Vacancy LossExpected loss of rent due to vacancies.
Vacancy loss:
(6%)
| 6% | -$336 | -$4,032 |
Operating IncomeGross rental income minus vacancy loss. Calculation:Gross rent - Vacancy loss
Operating income:
| $5,264 | $63,168 |
Operating Expenses
| % Rent | Monthly | Yearly | |
|---|---|---|---|
Property TaxesAnnual taxes levied by local governments on real estate properties. These taxes fund public services like schools, roads, and emergency services. | 52% | -$2,901 | -$34,807 |
InsuranceThe costs for insurance coverage to protect against financial losses due to risks like fire, natural disasters, theft, liability, or tenant-related damages. Calculation:Assumes 7% of gross rental income, unless insurance rates are specified. | 7% | -$392 | -$4,704 |
Property ManagementThe costs associated with hiring a property manager to handle the day-to-day operations of a rental property. Includes management fees, leasing fes, eviction fees, etc. Calculation:Assumes 8% of gross rental income. | 8% | -$448 | -$5,376 |
Repairs & MaintenanceOngoing costs for routine upkeep and minor fixes needed to keep a property in good working condition. Calculation:Assumes 5% of gross rental income. Varies by property age and condition. | 5% | -$280 | -$3,360 |
Capital ExpensesLarge, infrequent costs for major improvements or replacements, like a new roof, HVAC system, or appliances. Calculation:Assumes 5% of gross rental income. Varies by property age. | 5% | -$280 | -$3,360 |
HOA FeesRegular dues paid to a Homeowners Association for community maintenance, amenities, and management. Similar fees include: Condo Association Fees, Co-op Maintenance Fees, etc. | n/a | n/a | n/a |
Operating ExpensesRecurring costs required to maintain and manage a rental property, including property taxes, insurance, maintenance, repairs, utilities (if paid by the owner), property management fees, and other day-to-day expenses. Calculation:Insurance + Property Taxes + Property Management + Repairs & Maintenance + Capital Expenditures + HOA Fees | 77% | -$4,301 | -$51,607 |
Cash Flow
| Monthly | Yearly | |
|---|---|---|
Net Operating Income (NOI)The income generated from a property after deducting all operating expenses but before deducting mortgage payments, taxes, and capital expenditures. Calculation:Gross Operating Income - Operating Expenses
Net operating income:
| $963 | $11,556 |
Mortgage PaymentThe fixed amount a borrower pays each month to repay a loan. It typically includes principal and interest (P&I) and may also cover property taxes, insurance, HOA fees, and PMI if escrowed. | -$5,579 | -$66,948 |
Cash FlowNet Operating Income (NOI) minus mortgage payments. Calculation:NOI - Mortgage Payments | $4,616 | $55,392 |