
$2,000,000
Investment Summary
- Monthly Cash Flow
- -$5,105
- Cap Rate
- 3.1%
- Cash-on-Cash Return
- -13.3%
- Debt Coverage Ratio
- 0.50
- Internal Rate of Return (5 years)
- -8.9%
Cash Flow
Net Operating Income (NOI) minus mortgage payments.
Calculation:
NOI - Mortgage Payments
Cap Rate (Market Value)
Capitalization Rate is a rate of return that compares the yearly Net Operating Income (NOI) to the market value.
Calculation:
NOI / Market Value
Cash-on-Cash Return (CoC)
Annual Cash Flow / Cash Invested
Calculation:
Annual cash flow divided by initial cash invested.
Debt Coverage Ratio (DCR)
Net Operating Income (NOI) divided by total debt payments.
Calculation:
NOI / Total Debt Payments
Internal Rate of Return (IRR)
A metric for assessing profitability over time. IRR is the discount rate at which the net present value (NPV) of all future cash flows (positive and negative) from an investment equals zero — including both periodic cash flow (such as rent) and a projected sale at the end of the holding period. It represents the expected annualized return, accounting for income, expenses, and the recovery of capital through a future sale.
Property Description
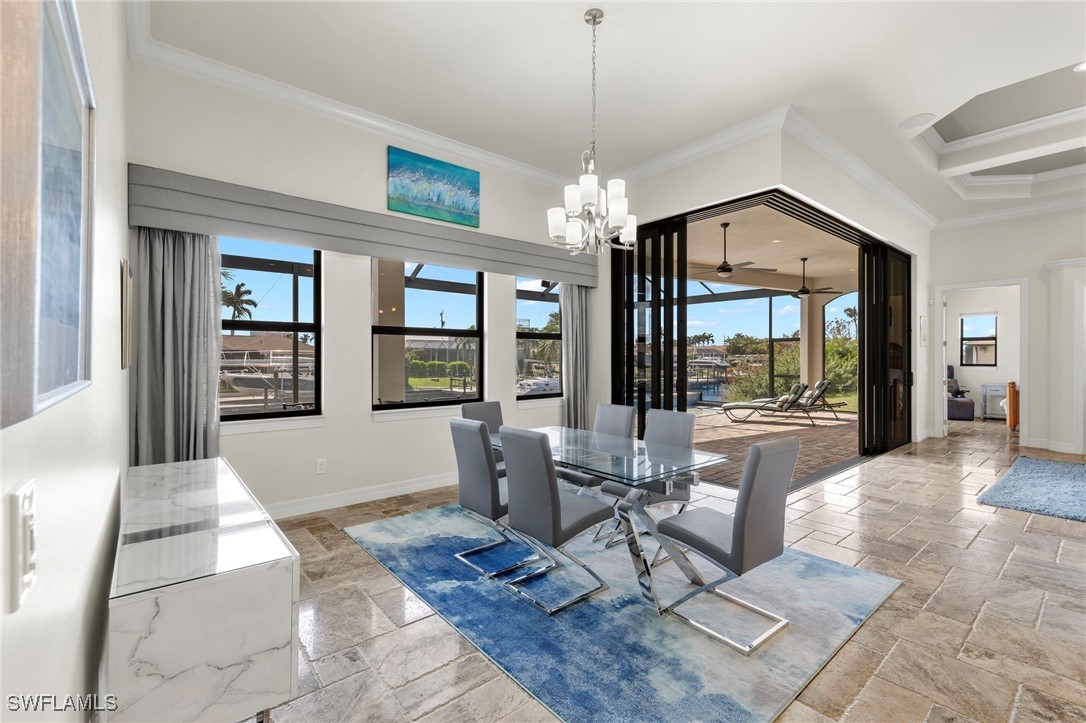
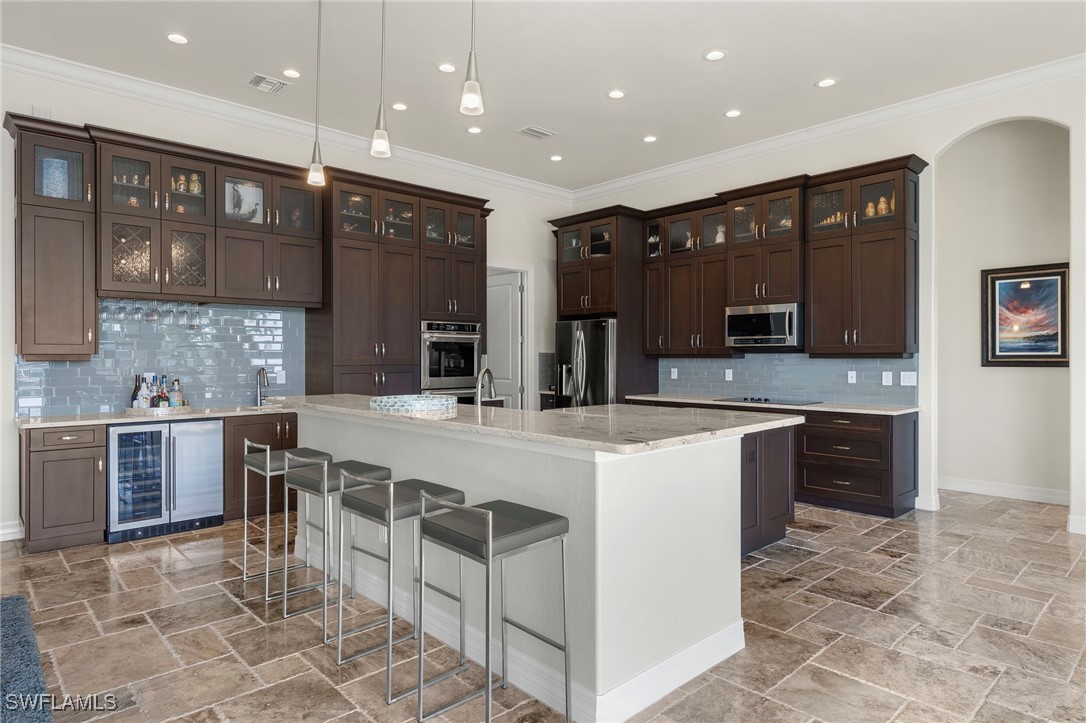
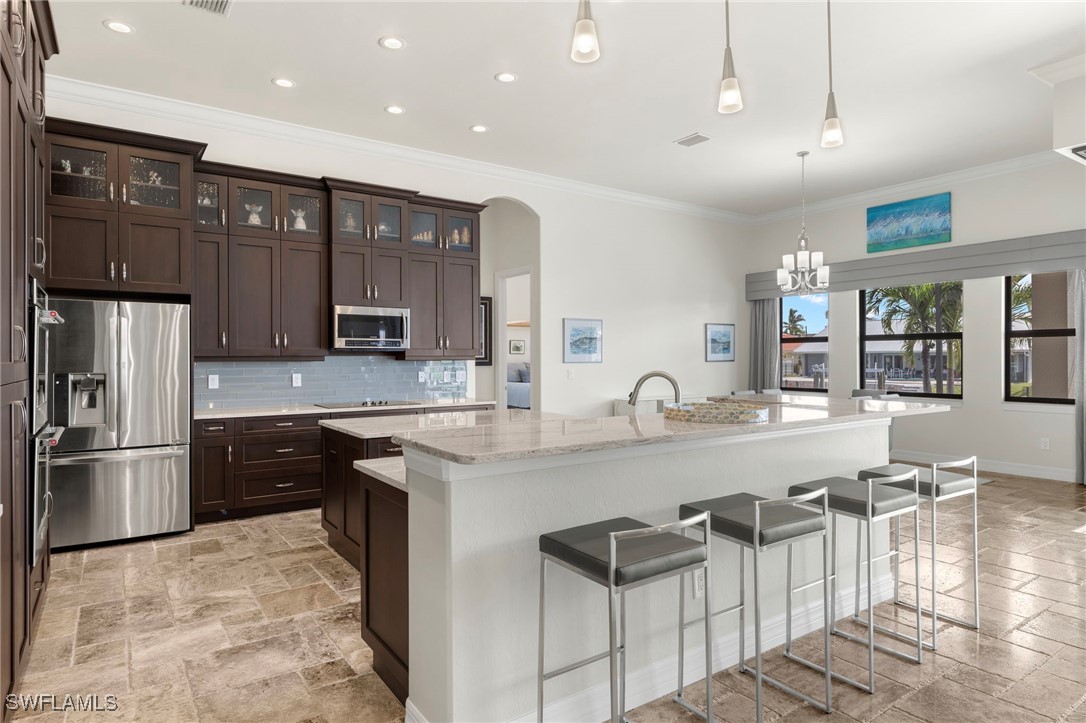
Introducing the exceptional Sinclair 2017 Builder's Showcase Home of the Year, a proud recipient of all nine awards in its category. This stunning custom-built Trinidad model boasts an impressive 12-foot ceiling height throughout, enhancing the sense of spaciousness and luxury. Set on a corner lot with 219 feet of seawall canal frontage, this residence is located on intersecting canals, providing direct access to the water without any bridges or locks. This prime location ensures unobstructed navigation, making it an ideal setting for boating enthusiasts. The gourmet kitchen features 11-foot handcrafted custom cabinets, two large islands with under-counter storage, and a two-level outer island equipped with a double sink and dishwasher. The raised bar top seats six and is complemented by a stylish wet bar with a new wine cooler and double oven. The primary bedroom is a luxurious retreat, featuring 8-foot sliders that open to the lanai, a coffered ceiling, dual walk-in closets by Design Closets, a walk-through shower, a six-foot soaking tub, and large dual vanities. The luxurious mother-in-law suite provides convenient access from both the garage and the main part of the house. This versatile space includes a living room and is equipped with kitchen cabinets, a countertop, sink, and refrigerator—ideal for independent living. The bedroom features a spacious walk-in closet, and the attached bathroom boasts a wide entry and a walk-in shower for ease of access. Key features of this home also include silver travertine flooring throughout, level 3 granite, a 17-foot ceiling in the entry study, two new AC units, and triple-pane, argon-filled hurricane windows and impact-resistant doors.The outdoor space is a breathtaking retreat, enhanced by expansive 90-degree, 10-foot sliding doors that create a seamless transition between indoor and outdoor living. The generously sized lanai was thoughtfully designed to minimize columns, offering unobstructed views of the tranquil canal. It features a luxurious custom saltwater pool, an eight-seat spa with stunning fire and waterfall elements, and elegant designer pavers that add sophistication. Additionally, the lanai includes a convenient food preparation countertop with a sink and bar refrigerator, along with an outdoor shower for ultimate relaxation and enjoyment.This award-winning home includes a slip for a large sailboat, a 44-foot, 12,000 lb Synergy boat lift, a 32-foot canopy, and a lower dock for kayaks. The spacious three-car garage features a dedicated workshop area, a second electric box for expansion, a generator hookup, and a Tesla EV charging station. Hurricane impact insulated garage doors enhance security. A pull-down ladder and Versa Lift System offer easy access to an additional 580 sq. ft. of attic space, accommodating up to 250 lb boxes.Arrange your exclusive showing of this exceptional dream home today—this opportunity won’t last long!
Build Your Team
Quickly find investor-friendly professionals who can help you succeed in real estate investing at any stage of the investing journey.


Agents
Match with investor-friendly agents who can help you find, analyze, and close your next deal


Lenders
Get the best funding…find investor-friendly lenders who specialize in your deal strategy


Property Managers
Transition to passive investing. Find a trusted property management partnership that lasts.


Tax Pros & Accountants
Taxes and financial reporting made easy—find experts to create tax savings strategies, file taxes, and more
Location
Property Details
Parking
- Description: Attached, Driveway, ElectricVehicleChargingStations, Garage, Paved, GarageDoorOpener
- Details: Attached, Driveway, Electric Vehicle Charging Station(s), Garage, Paved, Garage Door Opener
- Garage Spaces: 3
- Spaces Total: 0
Bedroom Information
- # of Bedrooms: 4
Bathroom Information
- # of Baths (Full): 4
- # of Baths (Total): 4.0
Interior Features
- # of Stories: 1
- Fireplace: Yes
Exterior Features
- Exterior Walls Materials: Stucco
- Roof Type: IRR/Cathedral
- Roof Material: Slate, Tile
- Pool: Yes
Land Information
- Land Use: Residential
- Land Use Subtype: Single Family Residential
Lot Information
- Parcel ID: 154523C301671.0390
- Lot Size: 0 sqft
Property Information
- Property Type: Single Family Residence
- Style: Ranch, One Story, Split Level
- Year Built: 2016
Tax Information
- Annual Tax: $13,671
Utilities
- Heating: Central, Electric
- Cooling: Central Air, Ceiling Fan(s), Electric
Location
- County: Lee
Listing Details
Investment Summary
- Monthly Cash Flow
- -$5,105
- Cap Rate
- 3.1%
- Cash-on-Cash Return
- -13.3%
- Debt Coverage Ratio
- 0.50
- Internal Rate of Return (5 years)
- -8.9%
Cash Flow
Net Operating Income (NOI) minus mortgage payments.
Calculation:
NOI - Mortgage Payments
Cap Rate (Market Value)
Capitalization Rate is a rate of return that compares the yearly Net Operating Income (NOI) to the market value.
Calculation:
NOI / Market Value
Cash-on-Cash Return (CoC)
Annual Cash Flow / Cash Invested
Calculation:
Annual cash flow divided by initial cash invested.
Debt Coverage Ratio (DCR)
Net Operating Income (NOI) divided by total debt payments.
Calculation:
NOI / Total Debt Payments
Internal Rate of Return (IRR)
A metric for assessing profitability over time. IRR is the discount rate at which the net present value (NPV) of all future cash flows (positive and negative) from an investment equals zero — including both periodic cash flow (such as rent) and a projected sale at the end of the holding period. It represents the expected annualized return, accounting for income, expenses, and the recovery of capital through a future sale.
Purchase Details
Purchase PriceThe price paid for the property. Purchase price:
| $2,000,000 |
|---|---|
Amount FinancedThe amount of the purchase financed through a loan. Amount financed:
| -$1,600,000 |
Down paymentThe initial payment made towards the purchase. Down payment:
| $400,000 |
Closing CostsFees and expenses associated with purchasing a property, typically ranging from 2% to 5% of the home’s purchase price, paid at the end of a home purchase to cover services like lending, title transfer, and taxes. Closing costs:
| $60,000 |
Rehab CostsCosts incurred to repair or improve the property, including: roof, flooring, exterior siding, kitchen, exterior paint, bathrooms, etc. Rehab costs:
| $0 |
Initial Cash InvestedThe total initial cash invested in the property. Calculation:Down payment + Buying costs + Rehab costs Initial cash invested:
| $460,000 |
Square Feet (SQFT)The total square footage of the property. Square feet:
| 3,194 |
Cost Per Square FootCost per square foot of the property. Calculation:Purchase Price / Square Feet Cost per square foot:
| $626 |
Monthly Rent Per Square FootMonthly rent divided by the number of square feet. This ratio helps investors compare rental income efficiency across properties, markets, and unit sizes Calculation:Monthly Rent / Square Feet Monthly rent per square foot:
| $2.85 |
Financing Details
Loan AmountThe total sum of money borrowed from a lender to finance a property purchase. Calculation:Purchase Price - Down Payment
Loan amount:
| $1,600,000 |
|---|---|
Loan to Value Ratio (LTV)Loan amount divided by the market value of the property. Calculation:Loan Amount / Market Value
Loan to value ratio:
| 80.0% |
Loan TypeThe type of loan (e.g., fixed, adjustable).
Loan type:
| Amortizing |
TermThe loan repayment period in years.
Term:
| 30 years |
Interest RateThe percentage a lender charges on the borrowed amount of a loan, determining the cost of borrowing money.
Interest rate:
| 6.625% |
Principal & Interest (PI)The principal is the portion of the loan payment that reduces the loan balance. The interest is the lender's charge for borrowing money. Calculation:(P * r * (1 + r) ** n) / ((1 + r) ** n - 1) Where:
P = Loan amount (principal)
Principal & interest:
| $10,245 |
Property TaxesAnnual taxes levied by local governments on real estate properties. These taxes fund public services like schools, roads, and emergency services.
Property tax:
| $1,139 |
InsuranceThe costs for insurance coverage to protect against financial losses due to risks like fire, natural disasters, theft, liability, or tenant-related damages. Calculation:Assumes 7% of gross rental income, unless insurance rates are specified.
Insurance:
| $637 |
Private Mortgage Insurance (PMI)A fee that borrowers pay when they take out a conventional loan with a loan-to-value (LTV) ratio above 80%.
Private mortgage insurance (PMI):
| $0 |
Monthly PaymentThe fixed amount a borrower pays each month to repay a loan. It typically includes principal and interest (P&I) and may also cover property taxes, insurance, HOA fees, and PMI if escrowed. Monthly payment:
| $12,021 |
Operating Income
| % Rent | Monthly | Yearly | |
|---|---|---|---|
Gross RentThe total rental income received from tenants before deducting any expenses. Includes base rent, late fees, pet fees, parking fees, and other recurring charges.
Gross rent:
| $9,100 | $109,200 | |
Vacancy LossExpected loss of rent due to vacancies.
Vacancy loss:
(6%)
| 6% | -$546 | -$6,552 |
Operating IncomeGross rental income minus vacancy loss. Calculation:Gross rent - Vacancy loss
Operating income:
| $8,554 | $102,648 |
Operating Expenses
| % Rent | Monthly | Yearly | |
|---|---|---|---|
Property TaxesAnnual taxes levied by local governments on real estate properties. These taxes fund public services like schools, roads, and emergency services. | 13% | -$1,139 | -$13,671 |
InsuranceThe costs for insurance coverage to protect against financial losses due to risks like fire, natural disasters, theft, liability, or tenant-related damages. Calculation:Assumes 7% of gross rental income, unless insurance rates are specified. | 7% | -$637 | -$7,644 |
Property ManagementThe costs associated with hiring a property manager to handle the day-to-day operations of a rental property. Includes management fees, leasing fes, eviction fees, etc. Calculation:Assumes 8% of gross rental income. | 8% | -$728 | -$8,736 |
Repairs & MaintenanceOngoing costs for routine upkeep and minor fixes needed to keep a property in good working condition. Calculation:Assumes 5% of gross rental income. Varies by property age and condition. | 5% | -$455 | -$5,460 |
Capital ExpensesLarge, infrequent costs for major improvements or replacements, like a new roof, HVAC system, or appliances. Calculation:Assumes 5% of gross rental income. Varies by property age. | 5% | -$455 | -$5,460 |
HOA FeesRegular dues paid to a Homeowners Association for community maintenance, amenities, and management. Similar fees include: Condo Association Fees, Co-op Maintenance Fees, etc. | n/a | n/a | n/a |
Operating ExpensesRecurring costs required to maintain and manage a rental property, including property taxes, insurance, maintenance, repairs, utilities (if paid by the owner), property management fees, and other day-to-day expenses. Calculation:Insurance + Property Taxes + Property Management + Repairs & Maintenance + Capital Expenditures + HOA Fees | 38% | -$3,414 | -$40,971 |
Cash Flow
| Monthly | Yearly | |
|---|---|---|
Net Operating Income (NOI)The income generated from a property after deducting all operating expenses but before deducting mortgage payments, taxes, and capital expenditures. Calculation:Gross Operating Income - Operating Expenses
Net operating income:
| $5,140 | $61,680 |
Mortgage PaymentThe fixed amount a borrower pays each month to repay a loan. It typically includes principal and interest (P&I) and may also cover property taxes, insurance, HOA fees, and PMI if escrowed. | -$10,245 | -$122,940 |
Cash FlowNet Operating Income (NOI) minus mortgage payments. Calculation:NOI - Mortgage Payments | $5,105 | $61,260 |