
$2,940,000
Investment Summary
- Monthly Cash Flow
- -$7,208
- Cap Rate
- 2.7%
- Cash-on-Cash Return
- -12.8%
- Debt Coverage Ratio
- 0.48
- Internal Rate of Return (5 years)
- -8.4%
Cash Flow
Net Operating Income (NOI) minus mortgage payments.
Calculation:
NOI - Mortgage Payments
Cap Rate (Market Value)
Capitalization Rate is a rate of return that compares the yearly Net Operating Income (NOI) to the market value.
Calculation:
NOI / Market Value
Cash-on-Cash Return (CoC)
Annual Cash Flow / Cash Invested
Calculation:
Annual cash flow divided by initial cash invested.
Debt Coverage Ratio (DCR)
Net Operating Income (NOI) divided by total debt payments.
Calculation:
NOI / Total Debt Payments
Internal Rate of Return (IRR)
A metric for assessing profitability over time. IRR is the discount rate at which the net present value (NPV) of all future cash flows (positive and negative) from an investment equals zero — including both periodic cash flow (such as rent) and a projected sale at the end of the holding period. It represents the expected annualized return, accounting for income, expenses, and the recovery of capital through a future sale.
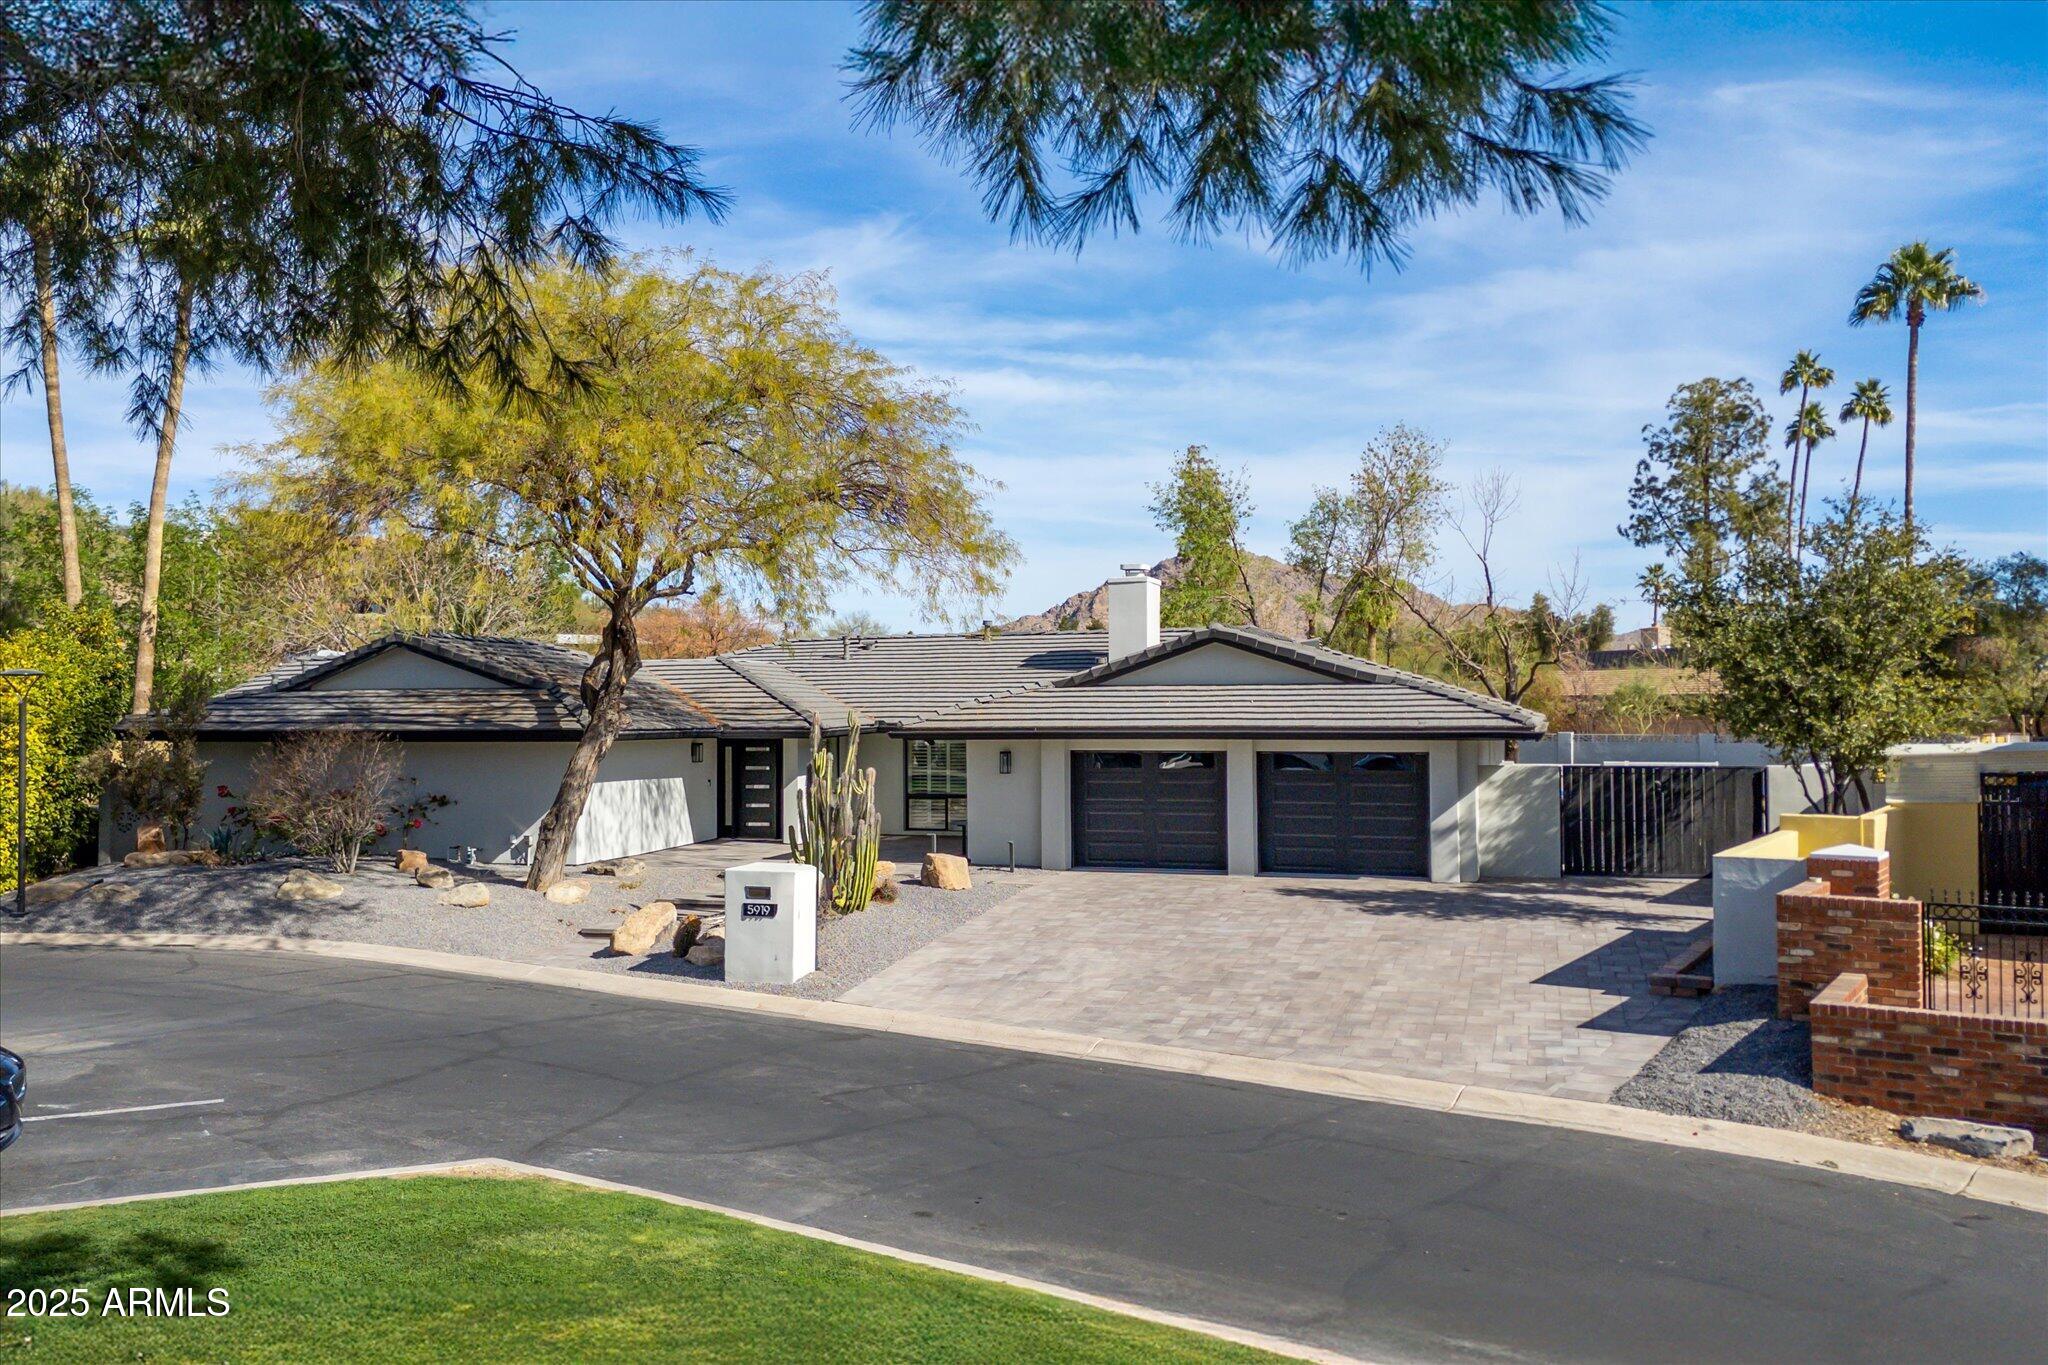
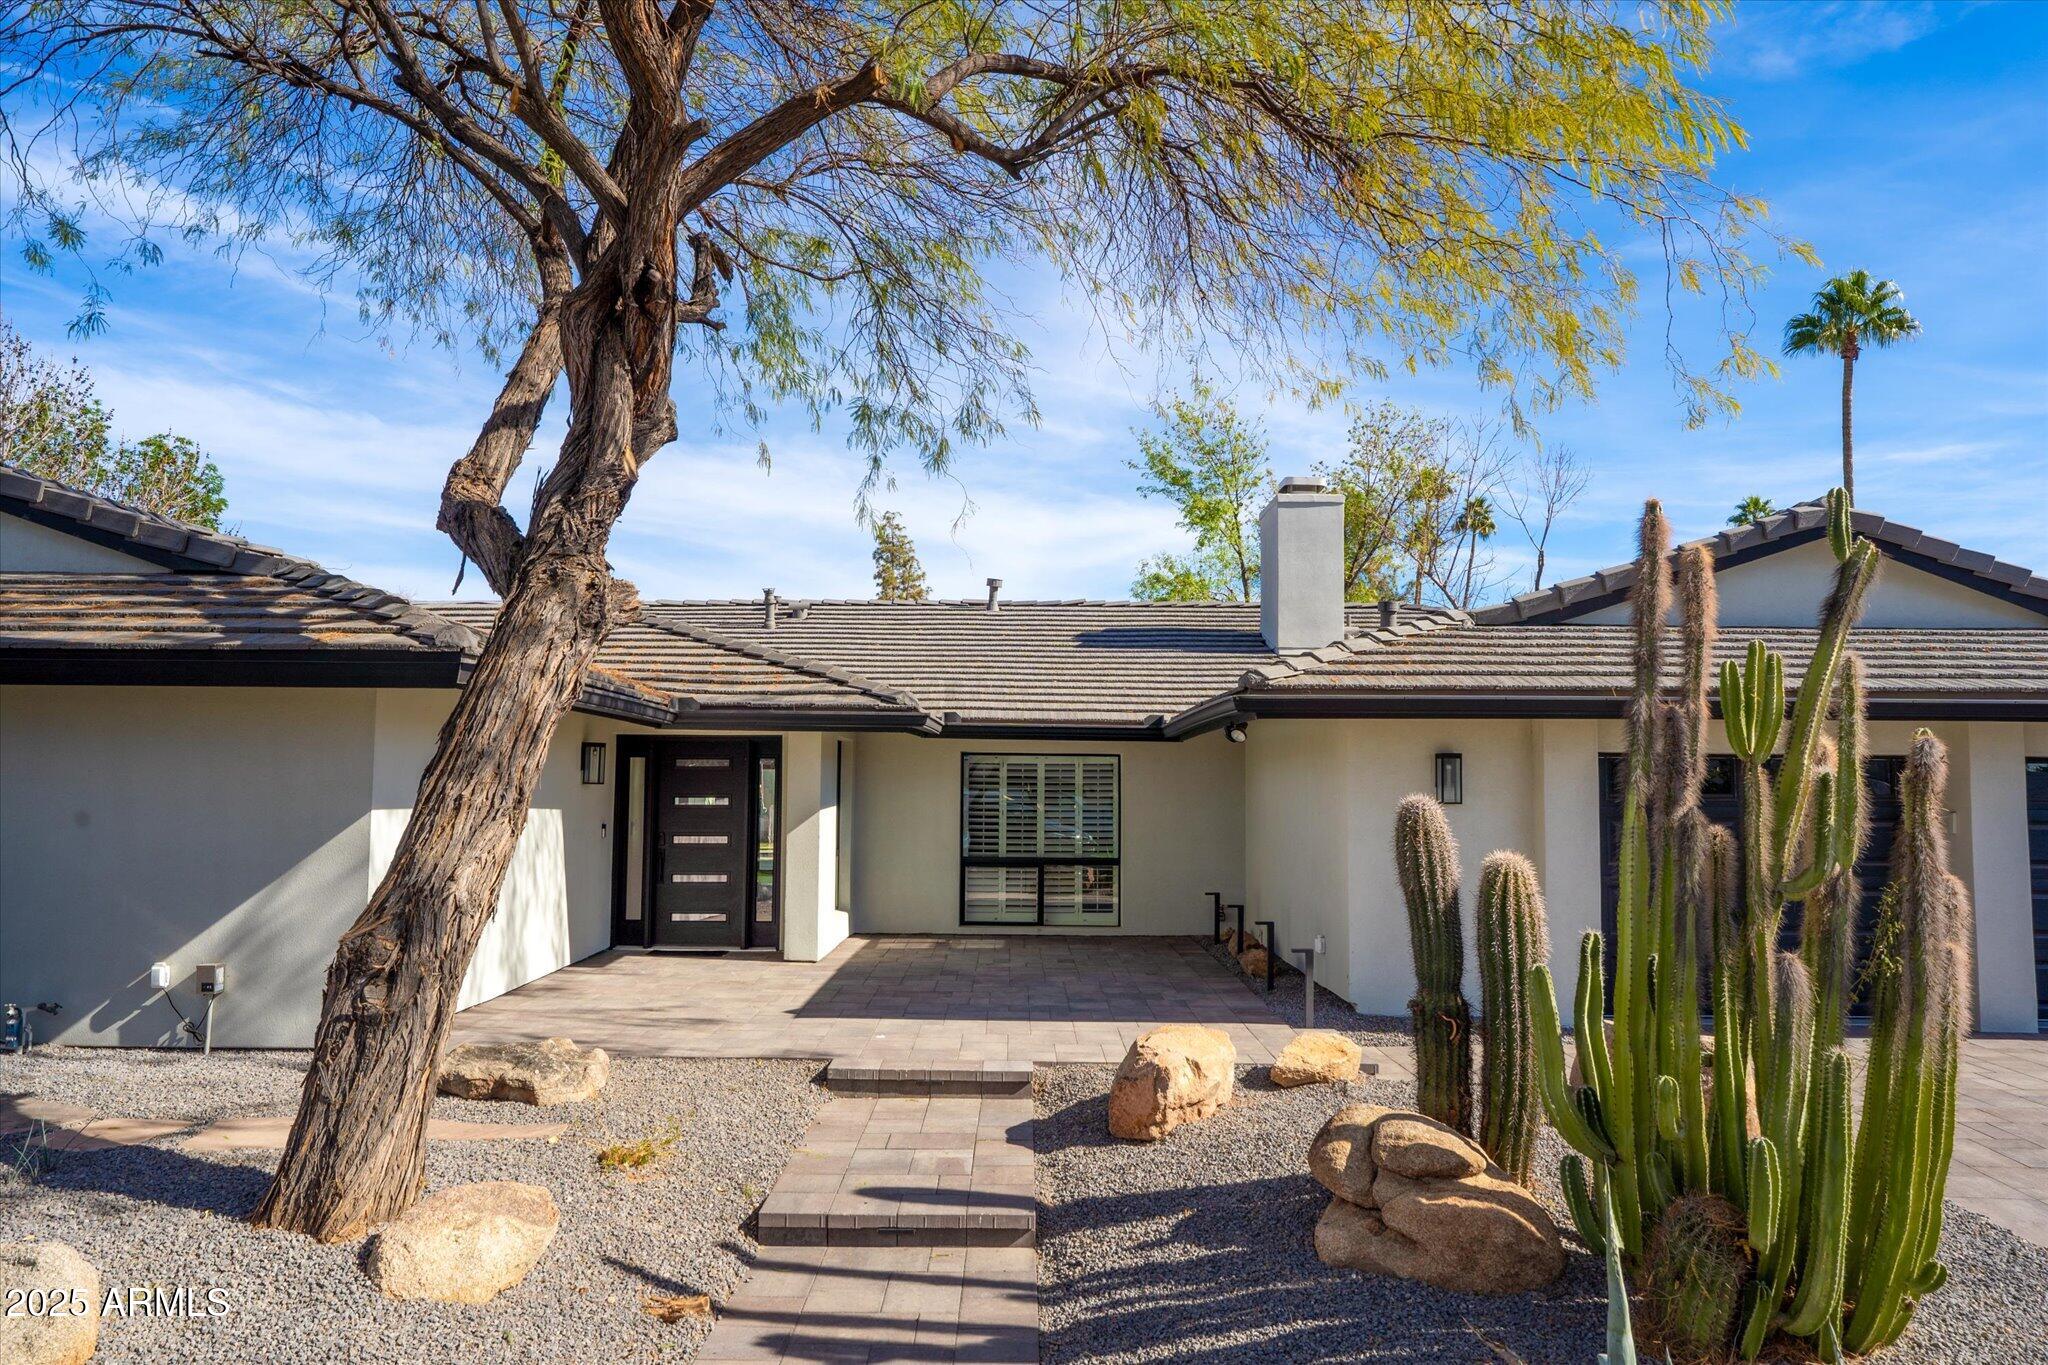
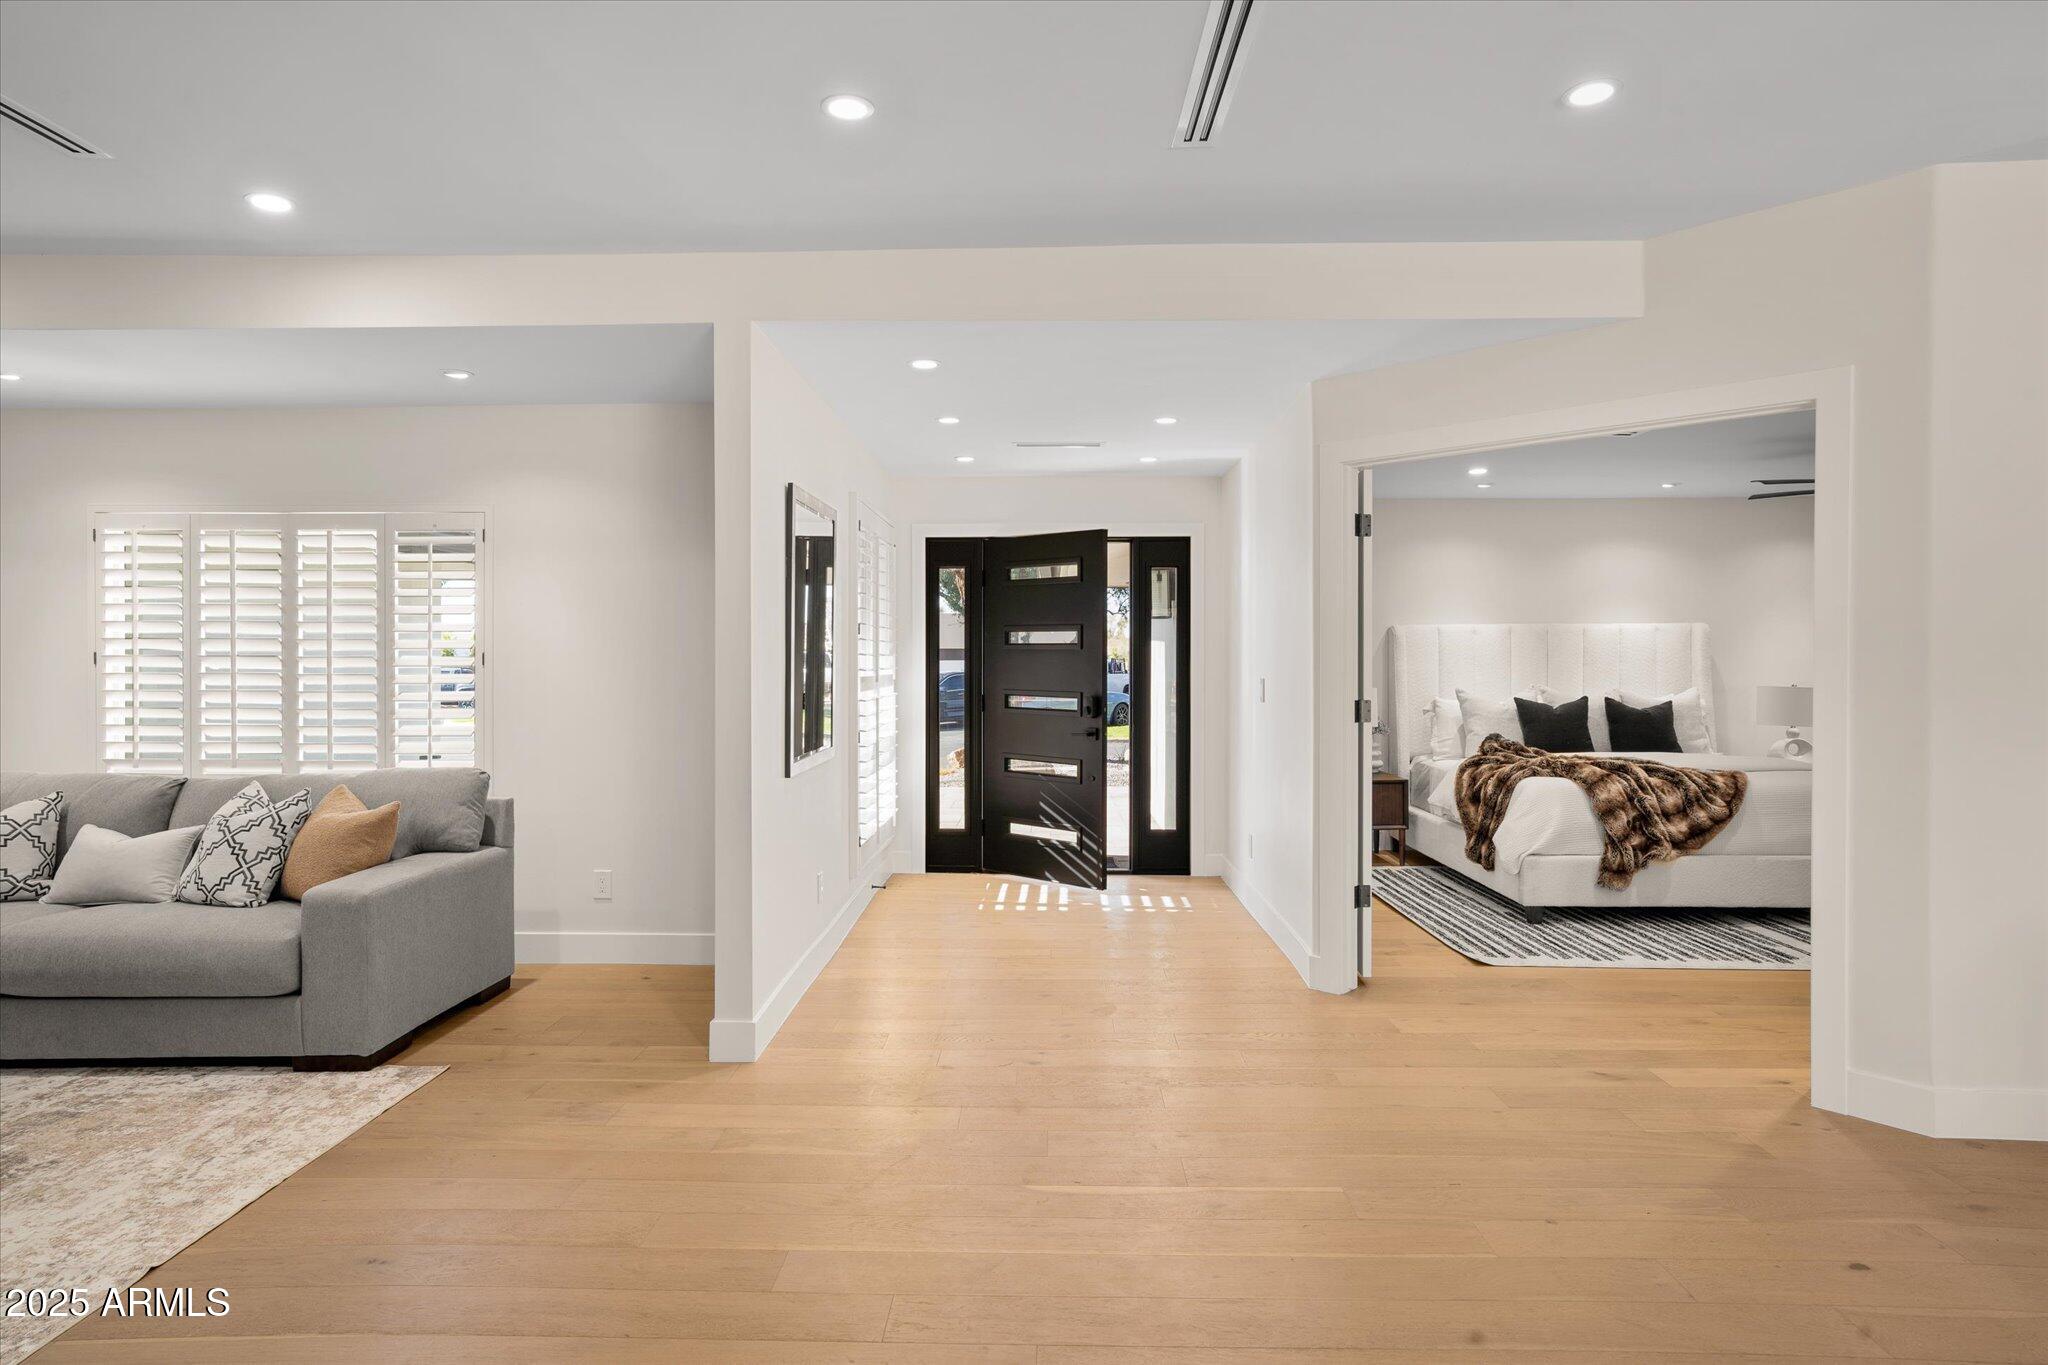
Property Description
This stunning Arcadia gem offers breathtaking Camelback Mountain views and has been beautifully remodeled with accessibility in mind, ensuring a seamless transition between spaces. Ask your agent to inquire about a 3-2-1 loan program that the seller is willing to pay for the rate buy down for the first 3 years. This charming and luxurious property in the highly sought-after Camelback Canyon Estates perfectly balances modern upgrades and classic design. Featuring a split floor plan with four bedrooms and 2.5 bathrooms, the home has been thoughtfully updated with raised ceilings, an accordion backdoor, and an extended patio ceiling. Inside, the master suite includes a luxurious sauna in the shower The family room boasts a dual-functioning fireplace that can be used with either gas or wood, creating a cozy ambiance. The home features a newly installed Lutron lighting system that enhances the home's modern sophistication, allowing for seamless control of lighting both indoors and outdoors. This system not only provides convenience but also creates the perfect ambiance throughout the home, adding to its luxurious appeal. The entire system can control lights, tv, fans, and shades, all from the touch of a button. The separate living room offers formal dining and a seating area with awe-inspiring views of the lush backyard and glimpses of Camelback, ideal for morning coffee. The airy kitchen is a dream, with accordion windowed doors to the outside,allowing natural light to fill the space. It boasts granite countertops, custom tile backsplash, soft-closing drawers, and new Thermador appliances. Large dual islands provide enough space for the whole family. The expansive primary en-suite awaits, easily accommodating bedroom furniture plus a sitting area or office. The en-suite bathroom is adorned with dual vanity sinks, free standing tub, and separate toilet closet, and adorned with a large shower sauna and faucet system. The impressive walk-in closet features custom shelving, drawers, and a large island, offering ample storage for clothing and accessories. A standout feature of this home is the backyard oasis, situated on over a quarter-acre lot. The large covered patio is equipped with recessed lighting and ceiling fans, while the saltwater pool boasts a Pebble Tec finish. The spacious yard also offers RV parking and room to build a guest casita if desired. This home is in the perfect spot, close to some of the best places in the area. You've got Global Ambassador right nearby for a luxurious stay or dining experience, and Steak 44 if you're craving an upscale steak dinner. For something a little more casual but just as delicious, The Henry is a great option. If you need groceries, AJ's Fine Foods is just around the corner, offering gourmet selections. For fitness and wellness, you can head to The Village Health Club. And if you love hiking or outdoor activities, the Echo Canyon Trailhead on Camelback Mountain is practically at your doorstep!
Build Your Team
Quickly find investor-friendly professionals who can help you succeed in real estate investing at any stage of the investing journey.


Agents
Match with investor-friendly agents who can help you find, analyze, and close your next deal


Lenders
Get the best funding…find investor-friendly lenders who specialize in your deal strategy


Property Managers
Transition to passive investing. Find a trusted property management partnership that lasts.


Tax Pros & Accountants
Taxes and financial reporting made easy—find experts to create tax savings strategies, file taxes, and more
Location
Property Details
Parking
- Description: Open, Covered, Garage
- Garage Spaces: 3
- Spaces Total: 2
Bedroom Information
- # of Bedrooms: 4
Bathroom Information
- # of Baths (Total): 3.0
Interior Features
- # of Stories: 1
- Fireplace: Yes
Exterior Features
- Exterior Walls Materials: Stucco
- Roof Material: Tile
- Pool: Yes
HOA
- Has HOA: Yes
- Association: Camelback Canyon Est
- HOA Fee: $213/monthly
Land Information
- Land Use: Residential
- Land Use Subtype: Single Family Residential
Lot Information
- Parcel ID: 17116045
- Lot Size: 16496 sqft
Property Information
- Property Type: Single Family Residence
- Style: Ranch
- Year Built: 1972
Tax Information
- Annual Tax: $7,238
Utilities
- Water & Sewer: Public
- Heating: Natural Gas
- Cooling: Central Air
Location
- County: Maricopa
Listing Details
Investment Summary
- Monthly Cash Flow
- -$7,208
- Cap Rate
- 2.7%
- Cash-on-Cash Return
- -12.8%
- Debt Coverage Ratio
- 0.48
- Internal Rate of Return (5 years)
- -8.4%
Cash Flow
Net Operating Income (NOI) minus mortgage payments.
Calculation:
NOI - Mortgage Payments
Cap Rate (Market Value)
Capitalization Rate is a rate of return that compares the yearly Net Operating Income (NOI) to the market value.
Calculation:
NOI / Market Value
Cash-on-Cash Return (CoC)
Annual Cash Flow / Cash Invested
Calculation:
Annual cash flow divided by initial cash invested.
Debt Coverage Ratio (DCR)
Net Operating Income (NOI) divided by total debt payments.
Calculation:
NOI / Total Debt Payments
Internal Rate of Return (IRR)
A metric for assessing profitability over time. IRR is the discount rate at which the net present value (NPV) of all future cash flows (positive and negative) from an investment equals zero — including both periodic cash flow (such as rent) and a projected sale at the end of the holding period. It represents the expected annualized return, accounting for income, expenses, and the recovery of capital through a future sale.
Purchase Details
Purchase PriceThe price paid for the property. Purchase price:
| $2,940,000 |
|---|---|
Amount FinancedThe amount of the purchase financed through a loan. Amount financed:
| -$2,352,000 |
Down paymentThe initial payment made towards the purchase. Down payment:
| $588,000 |
Closing CostsFees and expenses associated with purchasing a property, typically ranging from 2% to 5% of the home’s purchase price, paid at the end of a home purchase to cover services like lending, title transfer, and taxes. Closing costs:
| $88,200 |
Rehab CostsCosts incurred to repair or improve the property, including: roof, flooring, exterior siding, kitchen, exterior paint, bathrooms, etc. Rehab costs:
| $0 |
Initial Cash InvestedThe total initial cash invested in the property. Calculation:Down payment + Buying costs + Rehab costs Initial cash invested:
| $676,200 |
Square Feet (SQFT)The total square footage of the property. Square feet:
| 3,188 |
Cost Per Square FootCost per square foot of the property. Calculation:Purchase Price / Square Feet Cost per square foot:
| $922 |
Monthly Rent Per Square FootMonthly rent divided by the number of square feet. This ratio helps investors compare rental income efficiency across properties, markets, and unit sizes Calculation:Monthly Rent / Square Feet Monthly rent per square foot:
| $3.42 |
Financing Details
Loan AmountThe total sum of money borrowed from a lender to finance a property purchase. Calculation:Purchase Price - Down Payment
Loan amount:
| $2,352,000 |
|---|---|
Loan to Value Ratio (LTV)Loan amount divided by the market value of the property. Calculation:Loan Amount / Market Value
Loan to value ratio:
| 80.0% |
Loan TypeThe type of loan (e.g., fixed, adjustable).
Loan type:
| Amortizing |
TermThe loan repayment period in years.
Term:
| 30 years |
Interest RateThe percentage a lender charges on the borrowed amount of a loan, determining the cost of borrowing money.
Interest rate:
| 5.875% |
Principal & Interest (PI)The principal is the portion of the loan payment that reduces the loan balance. The interest is the lender's charge for borrowing money. Calculation:(P * r * (1 + r) ** n) / ((1 + r) ** n - 1) Where:
P = Loan amount (principal)
Principal & interest:
| $13,913 |
Property TaxesAnnual taxes levied by local governments on real estate properties. These taxes fund public services like schools, roads, and emergency services.
Property tax:
| $603 |
InsuranceThe costs for insurance coverage to protect against financial losses due to risks like fire, natural disasters, theft, liability, or tenant-related damages. Calculation:Assumes 7% of gross rental income, unless insurance rates are specified.
Insurance:
| $763 |
Private Mortgage Insurance (PMI)A fee that borrowers pay when they take out a conventional loan with a loan-to-value (LTV) ratio above 80%.
Private mortgage insurance (PMI):
| $0 |
Monthly PaymentThe fixed amount a borrower pays each month to repay a loan. It typically includes principal and interest (P&I) and may also cover property taxes, insurance, HOA fees, and PMI if escrowed. Monthly payment:
| $15,279 |
Operating Income
| % Rent | Monthly | Yearly | |
|---|---|---|---|
Gross RentThe total rental income received from tenants before deducting any expenses. Includes base rent, late fees, pet fees, parking fees, and other recurring charges.
Gross rent:
| $10,900 | $130,800 | |
Vacancy LossExpected loss of rent due to vacancies.
Vacancy loss:
(6%)
| 6% | -$654 | -$7,848 |
Operating IncomeGross rental income minus vacancy loss. Calculation:Gross rent - Vacancy loss
Operating income:
| $10,246 | $122,952 |
Operating Expenses
| % Rent | Monthly | Yearly | |
|---|---|---|---|
Property TaxesAnnual taxes levied by local governments on real estate properties. These taxes fund public services like schools, roads, and emergency services. | 6% | -$603 | -$7,238 |
InsuranceThe costs for insurance coverage to protect against financial losses due to risks like fire, natural disasters, theft, liability, or tenant-related damages. Calculation:Assumes 7% of gross rental income, unless insurance rates are specified. | 7% | -$763 | -$9,156 |
Property ManagementThe costs associated with hiring a property manager to handle the day-to-day operations of a rental property. Includes management fees, leasing fes, eviction fees, etc. Calculation:Assumes 8% of gross rental income. | 8% | -$872 | -$10,464 |
Repairs & MaintenanceOngoing costs for routine upkeep and minor fixes needed to keep a property in good working condition. Calculation:Assumes 5% of gross rental income. Varies by property age and condition. | 5% | -$545 | -$6,540 |
Capital ExpensesLarge, infrequent costs for major improvements or replacements, like a new roof, HVAC system, or appliances. Calculation:Assumes 5% of gross rental income. Varies by property age. | 5% | -$545 | -$6,540 |
HOA FeesRegular dues paid to a Homeowners Association for community maintenance, amenities, and management. Similar fees include: Condo Association Fees, Co-op Maintenance Fees, etc. | 2% | -$213 | -$2,556 |
Operating ExpensesRecurring costs required to maintain and manage a rental property, including property taxes, insurance, maintenance, repairs, utilities (if paid by the owner), property management fees, and other day-to-day expenses. Calculation:Insurance + Property Taxes + Property Management + Repairs & Maintenance + Capital Expenditures + HOA Fees | 32% | -$3,541 | -$42,494 |
Cash Flow
| Monthly | Yearly | |
|---|---|---|
Net Operating Income (NOI)The income generated from a property after deducting all operating expenses but before deducting mortgage payments, taxes, and capital expenditures. Calculation:Gross Operating Income - Operating Expenses
Net operating income:
| $6,705 | $80,460 |
Mortgage PaymentThe fixed amount a borrower pays each month to repay a loan. It typically includes principal and interest (P&I) and may also cover property taxes, insurance, HOA fees, and PMI if escrowed. | -$13,913 | -$166,956 |
Cash FlowNet Operating Income (NOI) minus mortgage payments. Calculation:NOI - Mortgage Payments | -$7,208 | -$86,496 |