85018 Investment Properties for Sale
Browse homes for sale and investment properties in 85018. Refine your search by price, property type, or more.
Best cash flowing properties in 85018
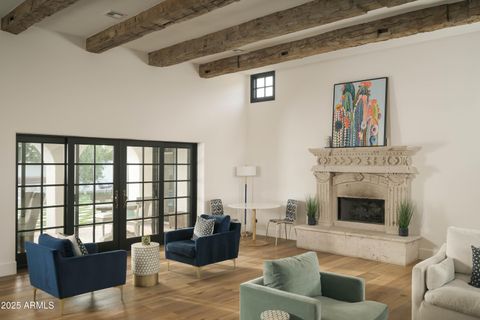
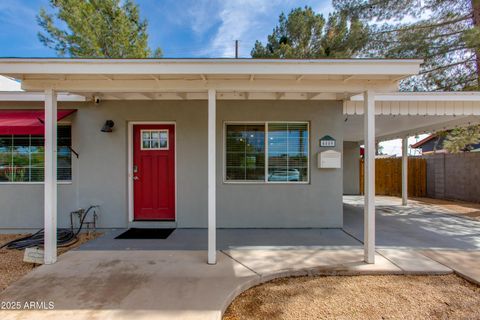
Active
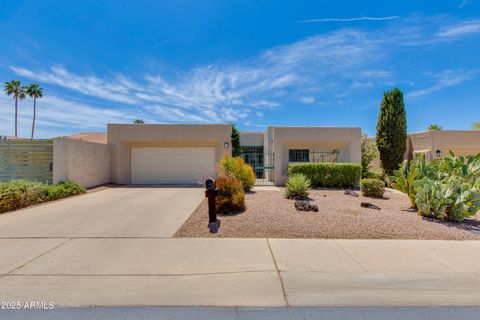
$299,000
2
bds
|
2
ba
|
1,344
sqft
|
built
1969
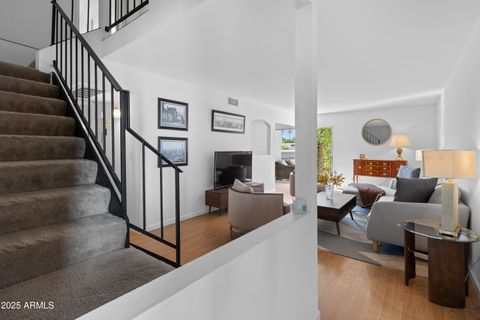
3416 N 44th St, Phoenix, AZ 85018
$-497
Cash flow
-8.7%
Cash-on-Cash Return
4.3%
Cap rate
0.8%
Rent to Value Ratio
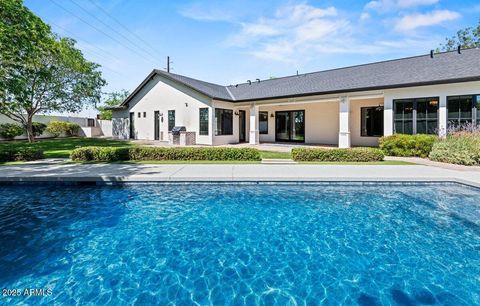
Active
$263,000
1
bds
|
1
ba
|
749
sqft
|
built
1980
3825 E Camelback Rd, Phoenix, AZ 85018
$-644
Cash flow
-12.8%
Cash-on-Cash Return
3.3%
Cap rate
0.6%
Rent to Value Ratio
139 out of 149 properties for sale in 85018
Limited Results Shown
Create a free account, or log in to reveal all property listings and enjoy the complete experience.
Active
$999,999
4
bds
|
2
ba
|
2,108
sqft
|
built
1953
4036 N 40th Pl, Phoenix, AZ 85018
$-2,137
Cash flow
-11.1%
Cash-on-Cash Return
3.1%
Cap rate
0.4%
Rent to Value Ratio
Active
$1,350,000
4
bds
|
3
ba
|
3,244
sqft
|
built
1954
4032 N 45th Pl, Phoenix, AZ 85018
$-2,217
Cash flow
-8.6%
Cash-on-Cash Return
3.7%
Cap rate
0.5%
Rent to Value Ratio
Active
$1,199,000
3
bds
|
3
ba
|
2,978
sqft
|
built
1978
4434 E Camelback Rd, Phoenix, AZ 85018
$-3,800
Cash flow
-16.5%
Cash-on-Cash Return
1.9%
Cap rate
0.3%
Rent to Value Ratio
Active
$570,000
3
bds
|
3
ba
|
1,443
sqft
|
built
2002
3034 N 39th St, Phoenix, AZ 85018
$-881
Cash flow
-8.1%
Cash-on-Cash Return
3.8%
Cap rate
0.6%
Rent to Value Ratio

Active
$1,149,000
3
bds
|
3
ba
|
2,334
sqft
|
built
1958
4435 N 35th St, Phoenix, AZ 85018
$-3,997
Cash flow
-18.1%
Cash-on-Cash Return
2.1%
Cap rate
0.3%
Rent to Value Ratio

Active
$3,598,000
5
bds
|
5
ba
|
5,120
sqft
|
built
1959
4710 N 41st Pl, Phoenix, AZ 85018
$-15,305
Cash flow
-22.2%
Cash-on-Cash Return
1.2%
Cap rate
0.2%
Rent to Value Ratio

Active
$3,149,000
4
bds
|
6
ba
|
4,371
sqft
|
built
2018
4416 N 37th Way, Phoenix, AZ 85018
$-10,927
Cash flow
-18.1%
Cash-on-Cash Return
2.1%
Cap rate
0.3%
Rent to Value Ratio

Active
$1,699,000
4
bds
|
4
ba
|
2,810
sqft
|
built
2018
3813 N 37th St, Phoenix, AZ 85018
$-6,036
Cash flow
-18.5%
Cash-on-Cash Return
2.0%
Cap rate
0.3%
Rent to Value Ratio

Active
$1,628,000
4
bds
|
4
ba
|
2,552
sqft
|
built
2018
4132 N 42nd St, Phoenix, AZ 85018
$-5,452
Cash flow
-17.5%
Cash-on-Cash Return
2.2%
Cap rate
0.3%
Rent to Value Ratio

Active
$1,500,000
4
bds
|
3
ba
|
2,638
sqft
|
built
1957
5118 E Mulberry Dr, Phoenix, AZ 85018
$-5,294
Cash flow
-18.4%
Cash-on-Cash Return
2.0%
Cap rate
0.3%
Rent to Value Ratio

Active
$1,995,000
5
bds
|
5
ba
|
3,805
sqft
|
built
2025
4124 E Indianola Ave, Phoenix, AZ 85018
$-8,993
Cash flow
-23.5%
Cash-on-Cash Return
0.9%
Cap rate
0.1%
Rent to Value Ratio

Active
$1,600,000
4
bds
|
3
ba
|
3,002
sqft
|
built
2021
3834 E Clarendon Ave, Phoenix, AZ 85018
$-3,351
Cash flow
-10.9%
Cash-on-Cash Return
3.8%
Cap rate
0.5%
Rent to Value Ratio

Active
$1,299,000
5
bds
|
4
ba
|
2,820
sqft
|
built
1956
5307 N 32nd Pl, Phoenix, AZ 85018
$-3,085
Cash flow
-12.4%
Cash-on-Cash Return
3.4%
Cap rate
0.5%
Rent to Value Ratio
Active
$1,850,000
5
bds
|
3
ba
|
2,650
sqft
|
built
1957
3308 N 51st St, Phoenix, AZ 85018
$-6,154
Cash flow
-17.4%
Cash-on-Cash Return
2.3%
Cap rate
0.3%
Rent to Value Ratio

Active
$3,150,000
4
bds
|
4
ba
|
3,450
sqft
|
built
2025
3301 E Elm St, Phoenix, AZ 85018
$-14,695
Cash flow
-24.3%
Cash-on-Cash Return
0.7%
Cap rate
0.1%
Rent to Value Ratio
Active
$2,399,000
5
bds
|
5
ba
|
3,540
sqft
|
built
2025
4911 E Amelia Ave, Phoenix, AZ 85018
$-11,096
Cash flow
-24.1%
Cash-on-Cash Return
0.7%
Cap rate
0.1%
Rent to Value Ratio
Active
$849,000
3
bds
|
2
ba
|
2,231
sqft
|
built
1979
4317 E Glenrosa Ave, Phoenix, AZ 85018
$-2,490
Cash flow
-15.3%
Cash-on-Cash Return
2.7%
Cap rate
0.4%
Rent to Value Ratio

Active
$2,000,000
3
bds
|
3
ba
|
2,094
sqft
|
built
1957
4596 E Calle Ventura, Phoenix, AZ 85018
$-7,412
Cash flow
-19.3%
Cash-on-Cash Return
1.2%
Cap rate
0.2%
Rent to Value Ratio

Active
$649,900
3
bds
|
2
ba
|
1,345
sqft
|
built
1953
4142 N 35th St, Phoenix, AZ 85018
$-1,842
Cash flow
-14.8%
Cash-on-Cash Return
2.9%
Cap rate
0.4%
Rent to Value Ratio
Active
$1,320,000
4
bds
|
3
ba
|
2,514
sqft
|
built
2016
3720 N 40th Pl, Phoenix, AZ 85018
$-2,882
Cash flow
-11.4%
Cash-on-Cash Return
3.6%
Cap rate
0.5%
Rent to Value Ratio
Active
$1,875,000
4
bds
|
4
ba
|
3,110
sqft
|
built
2018
4817 N 35th St, Phoenix, AZ 85018
$-5,123
Cash flow
-14.3%
Cash-on-Cash Return
3.0%
Cap rate
0.4%
Rent to Value Ratio

Active
$4,999,000
5
bds
|
6
ba
|
4,387
sqft
|
built
2023
4502 E Solano Dr, Phoenix, AZ 85018
$-21,032
Cash flow
-22.0%
Cash-on-Cash Return
1.2%
Cap rate
0.2%
Rent to Value Ratio

Active
$1,265,000
3
bds
|
2
ba
|
2,090
sqft
|
built
1980
3800 E Lincoln Dr, Phoenix, AZ 85018
$-5,177
Cash flow
-21.4%
Cash-on-Cash Return
1.4%
Cap rate
0.3%
Rent to Value Ratio
Active
$349,000
2
bds
|
2
ba
|
1,184
sqft
|
built
1980
3825 E Camelback Rd, Phoenix, AZ 85018
$-1,168
Cash flow
-17.5%
Cash-on-Cash Return
2.2%
Cap rate
0.5%
Rent to Value Ratio
Active
$1,795,000
3
bds
|
2
ba
|
2,428
sqft
|
built
1979
5804 N Echo Canyon Ln, Phoenix, AZ 85018
$-6,679
Cash flow
-19.4%
Cash-on-Cash Return
1.8%
Cap rate
0.3%
Rent to Value Ratio

Active
$740,000
3
bds
|
2
ba
|
1,681
sqft
|
built
1950
4020 N 34th St, Phoenix, AZ 85018
$-1,743
Cash flow
-12.3%
Cash-on-Cash Return
3.4%
Cap rate
0.5%
Rent to Value Ratio
Active
$3,999,000
4
bds
|
4
ba
|
4,379
sqft
|
built
1979
4616 N Royal Palm Cir, Phoenix, AZ 85018
$-15,536
Cash flow
-20.3%
Cash-on-Cash Return
1.6%
Cap rate
0.2%
Rent to Value Ratio
Active
$3,950,000
5
bds
|
6
ba
|
3,802
sqft
|
built
2004
5009 E Calle Redonda, Phoenix, AZ 85018
$-17,303
Cash flow
-22.9%
Cash-on-Cash Return
1.0%
Cap rate
0.1%
Rent to Value Ratio

Active
$879,000
4
bds
|
2
ba
|
1,494
sqft
|
built
1954
4314 E Montecito Ave, Phoenix, AZ 85018
$-2,624
Cash flow
-15.6%
Cash-on-Cash Return
2.7%
Cap rate
0.4%
Rent to Value Ratio
Active
$785,000
4
bds
|
2
ba
|
1,470
sqft
|
built
1954
4418 E Montecito Ave, Phoenix, AZ 85018
$-2,686
Cash flow
-17.9%
Cash-on-Cash Return
2.2%
Cap rate
0.3%
Rent to Value Ratio
Active
$1,890,000
4
bds
|
3
ba
|
2,570
sqft
|
built
1953
5960 E Orange Blossom Ln, Phoenix, AZ 85018
$-4,857
Cash flow
-13.4%
Cash-on-Cash Return
3.2%
Cap rate
0.4%
Rent to Value Ratio
Active
$1,050,000
3
bds
|
2
ba
|
1,610
sqft
|
built
1954
4440 E Campbell Ave, Phoenix, AZ 85018
$-3,753
Cash flow
-18.6%
Cash-on-Cash Return
2.0%
Cap rate
0.3%
Rent to Value Ratio
Active
$1,500,000
4
bds
|
3
ba
|
2,667
sqft
|
built
2019
4235 E Turney Ave, Phoenix, AZ 85018
$-2,140
Cash flow
-7.4%
Cash-on-Cash Return
4.6%
Cap rate
0.6%
Rent to Value Ratio
Active
$2,175,000
4
bds
|
5
ba
|
3,640
sqft
|
built
2025
4640 E Glenrosa Ave, Phoenix, AZ 85018
$-9,178
Cash flow
-22.0%
Cash-on-Cash Return
1.2%
Cap rate
0.2%
Rent to Value Ratio

Active
$2,295,000
4
bds
|
5
ba
|
3,655
sqft
|
built
2026
3828 E Monterosa St, Phoenix, AZ 85018
$-9,897
Cash flow
-22.5%
Cash-on-Cash Return
1.1%
Cap rate
0.2%
Rent to Value Ratio

Active
$1,138,000
4
bds
|
3
ba
|
2,529
sqft
|
built
1971
3016 N 49th St, Phoenix, AZ 85018
$-3,406
Cash flow
-15.6%
Cash-on-Cash Return
2.7%
Cap rate
0.4%
Rent to Value Ratio
Active
$10,495,000
5
bds
|
7
ba
|
7,455
sqft
|
built
2013
5446 E Exeter Blvd, Phoenix, AZ 85018
$-50,294
Cash flow
-25.0%
Cash-on-Cash Return
0.5%
Cap rate
0.1%
Rent to Value Ratio

Active
$687,500
3
bds
|
3
ba
|
2,196
sqft
|
built
2019
3200 N 39th St, Phoenix, AZ 85018
$-1,463
Cash flow
-11.1%
Cash-on-Cash Return
3.7%
Cap rate
0.6%
Rent to Value Ratio