85018 Investment Properties for Sale
Browse homes for sale and investment properties in 85018. Refine your search by price, property type, or more.
Best cash flowing properties in 85018
Active
$203,500
1
bds
|
1
ba
|
702
sqft
|
built
1969
3416 N 44th St, Phoenix, AZ 85018
$-269
Cash flow
-6.9%
Cash-on-Cash Return
4.1%
Cap rate
0.8%
Rent to Value Ratio

Active
$265,000
2
bds
|
2
ba
|
982
sqft
|
built
1974
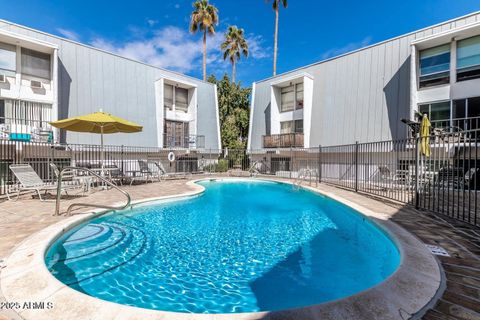
5525 E Thomas Rd, Phoenix, AZ 85018
$-409
Cash flow
-8.1%
Cash-on-Cash Return
3.8%
Cap rate
0.7%
Rent to Value Ratio
149 out of 159 properties for sale in 85018
Limited Results Shown
Create a free account, or log in to reveal all property listings and enjoy the complete experience.

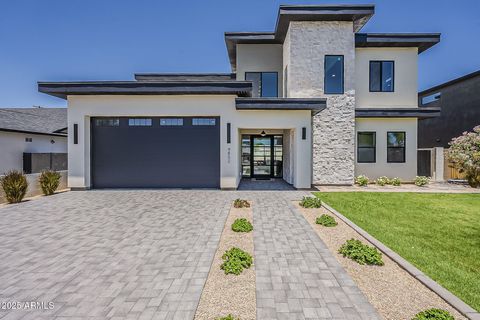
Active
$3,750,000
5
bds
|
7
ba
|
4,650
sqft
|
built
2025
4456 E Earll Dr, Phoenix, AZ 85018
$-15,439
Cash flow
-21.5%
Cash-on-Cash Return
0.7%
Cap rate
0.1%
Rent to Value Ratio

Active
$3,649,000
4
bds
|
5
ba
|
4,181
sqft
|
built
2025
3046 N 45th St, Phoenix, AZ 85018
$-13,159
Cash flow
-18.8%
Cash-on-Cash Return
1.4%
Cap rate
0.2%
Rent to Value Ratio
Active
$975,000
3
bds
|
3
ba
|
2,047
sqft
|
built
1950
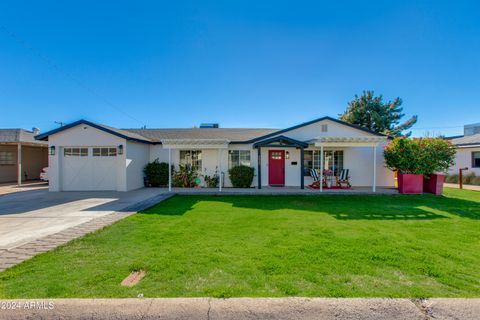
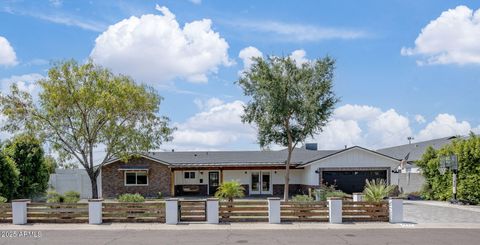
4035 E Indianola Ave, Phoenix, AZ 85018
$-1,424
Cash flow
-7.6%
Cash-on-Cash Return
3.9%
Cap rate
0.5%
Rent to Value Ratio
Active
$1,795,000
4
bds
|
4
ba
|
2,559
sqft
|
built
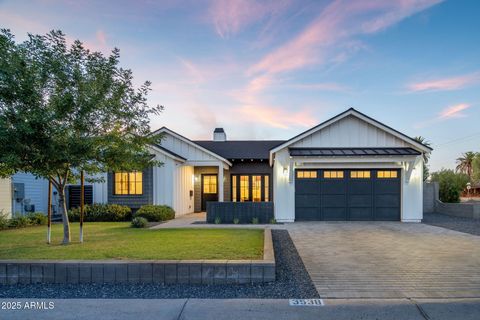
2020
4222 N 43rd St, Phoenix, AZ 85018
$-4,918
Cash flow
-14.3%
Cash-on-Cash Return
2.4%
Cap rate
0.3%
Rent to Value Ratio

Active
$425,000
2
bds
|
2
ba
|
1,135
sqft
|
built
1970
4201 E Camelback Rd, Phoenix, AZ 85018
$-1,007
Cash flow
-12.4%
Cash-on-Cash Return
2.8%
Cap rate
0.5%
Rent to Value Ratio
Active
$2,500,000
4
bds
|
3
ba
|
3,000
sqft
|
built
1953
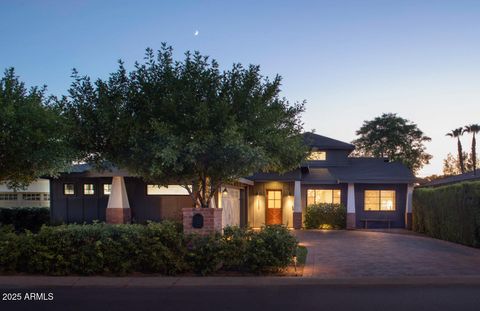
4101 E Medlock Dr, Phoenix, AZ 85018
$-7,761
Cash flow
-16.2%
Cash-on-Cash Return
2.0%
Cap rate
0.3%
Rent to Value Ratio

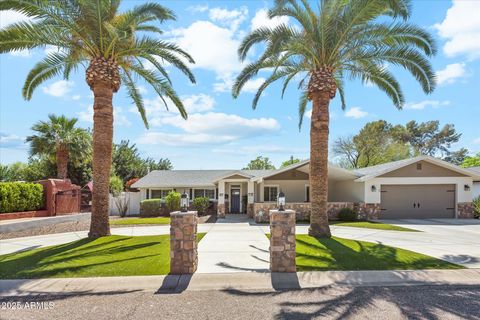
Active
$1,100,000
4
bds
|
2
ba
|
2,012
sqft
|
built
1952
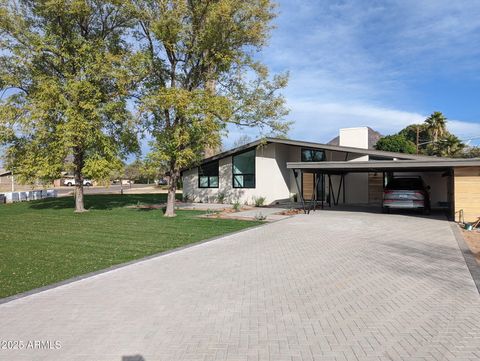
3809 N 35th St, Phoenix, AZ 85018
$-1,897
Cash flow
-9.0%
Cash-on-Cash Return
3.6%
Cap rate
0.5%
Rent to Value Ratio
Active
$1,650,000
4
bds
|
5
ba
|
3,023
sqft
|
built
1957
4333 E Indianola Ave, Phoenix, AZ 85018
$-4,972
Cash flow
-15.7%
Cash-on-Cash Return
2.1%
Cap rate
0.3%
Rent to Value Ratio

Active
$399,000
2
bds
|
2
ba
|
1,152
sqft
|
built
1967
3702 E Monterosa St, Phoenix, AZ 85018
$-968
Cash flow
-12.7%
Cash-on-Cash Return
2.8%
Cap rate
0.5%
Rent to Value Ratio
Active
$1,899,999
4
bds
|
4
ba
|
3,156
sqft
|
built
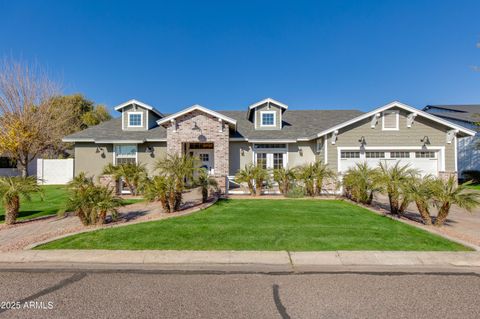
2019
3538 E Glenrosa Ave, Phoenix, AZ 85018
$-2,658
Cash flow
-7.3%
Cash-on-Cash Return
4.0%
Cap rate
0.5%
Rent to Value Ratio
Active
$2,100,000
4
bds
|
4
ba
|
3,007
sqft
|
built
2018
3838 E Devonshire Ave, Phoenix, AZ 85018
$-7,569
Cash flow
-18.8%
Cash-on-Cash Return
1.4%
Cap rate
0.2%
Rent to Value Ratio
Active
$779,000
4
bds
|
2
ba
|
1,450
sqft
|
built
1950
3111 N 34th St, Phoenix, AZ 85018
$-2,280
Cash flow
-15.3%
Cash-on-Cash Return
2.2%
Cap rate
0.3%
Rent to Value Ratio
Active
$2,299,999
5
bds
|
4
ba
|
3,152
sqft
|
built
2025
4852 E Piccadilly Rd, Phoenix, AZ 85018
$-9,112
Cash flow
-20.7%
Cash-on-Cash Return
0.9%
Cap rate
0.1%
Rent to Value Ratio

Active
$7,500,000
5
bds
|
6
ba
|
6,300
sqft
|
built
2018
5401 E Calle Del Medio, Phoenix, AZ 85018
$-33,133
Cash flow
-23.0%
Cash-on-Cash Return
0.4%
Cap rate
0.1%
Rent to Value Ratio

Active
$799,000
3
bds
|
2
ba
|
1,534
sqft
|
built
1952
3807 E Devonshire Ave, Phoenix, AZ 85018
$-2,004
Cash flow
-13.1%
Cash-on-Cash Return
2.7%
Cap rate
0.4%
Rent to Value Ratio

Active
$1,250,000
4
bds
|
2
ba
|
1,900
sqft
|
built
1953
4245 N 35th Way, Phoenix, AZ 85018
$-2,399
Cash flow
-10.0%
Cash-on-Cash Return
3.4%
Cap rate
0.5%
Rent to Value Ratio

Active
$1,200,000
6
bds
|
5
ba
|
2,318
sqft
|
built
1962
3217 E Flower St, Phoenix, AZ 85018
$-3,164
Cash flow
-13.8%
Cash-on-Cash Return
2.5%
Cap rate
0.3%
Rent to Value Ratio

Active
$295,000
2
bds
|
2
ba
|
1,184
sqft
|
built
1980
3825 E Camelback Rd, Phoenix, AZ 85018
$-811
Cash flow
-14.3%
Cash-on-Cash Return
2.4%
Cap rate
0.6%
Rent to Value Ratio

Active
$329,000
2
bds
|
2
ba
|
1,184
sqft
|
built
1980
3825 E Camelback Rd, Phoenix, AZ 85018
$-903
Cash flow
-14.3%
Cash-on-Cash Return
2.4%
Cap rate
0.5%
Rent to Value Ratio

Active
$2,395,000
5
bds
|
5
ba
|
4,085
sqft
|
built
2025
4114 E Roma Ave, Phoenix, AZ 85018
$-9,812
Cash flow
-21.4%
Cash-on-Cash Return
0.8%
Cap rate
0.1%
Rent to Value Ratio
Active
$1,899,000
3
bds
|
4
ba
|
3,355
sqft
|
built
1963
3511 E Coolidge St, Phoenix, AZ 85018
$-4,878
Cash flow
-13.4%
Cash-on-Cash Return
2.6%
Cap rate
0.4%
Rent to Value Ratio
Active
$1,110,000
3
bds
|
3
ba
|
2,840
sqft
|
built
1978
4434 E Camelback Rd, Phoenix, AZ 85018
$-3,726
Cash flow
-17.5%
Cash-on-Cash Return
1.7%
Cap rate
0.3%
Rent to Value Ratio
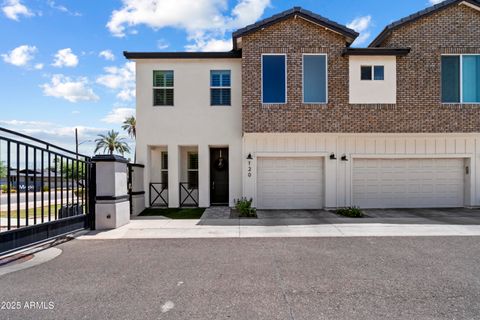
Active
$555,000
3
bds
|
3
ba
|
1,534
sqft
|
built
2017
3030 N 38th St, Phoenix, AZ 85018
$-1,338
Cash flow
-12.6%
Cash-on-Cash Return
2.8%
Cap rate
0.5%
Rent to Value Ratio
Active
$325,000
2
bds
|
2
ba
|
1,184
sqft
|
built
1980
3825 E Camelback Rd, Phoenix, AZ 85018
$-717
Cash flow
-11.5%
Cash-on-Cash Return
3.0%
Cap rate
0.6%
Rent to Value Ratio
Active
$560,000
3
bds
|
3
ba
|
1,443
sqft
|
built
2002
3034 N 39th St, Phoenix, AZ 85018
$-834
Cash flow
-7.8%
Cash-on-Cash Return
3.9%
Cap rate
0.6%
Rent to Value Ratio

Active
$3,495,000
5
bds
|
5
ba
|
5,120
sqft
|
built
1959
4710 N 41st Pl, Phoenix, AZ 85018
$-13,060
Cash flow
-19.5%
Cash-on-Cash Return
1.2%
Cap rate
0.2%
Rent to Value Ratio
Active
$3,149,000
4
bds
|
6
ba
|
4,371
sqft
|
built
2018
4416 N 37th Way, Phoenix, AZ 85018
$-9,389
Cash flow
-15.6%
Cash-on-Cash Return
2.1%
Cap rate
0.3%
Rent to Value Ratio

Active
$1,500,000
4
bds
|
3
ba
|
2,638
sqft
|
built
1957
5118 E Mulberry Dr, Phoenix, AZ 85018
$-4,561
Cash flow
-15.9%
Cash-on-Cash Return
2.0%
Cap rate
0.3%
Rent to Value Ratio

Active
$1,995,000
5
bds
|
5
ba
|
3,846
sqft
|
built
2025
4124 E Indianola Ave, Phoenix, AZ 85018
$-8,019
Cash flow
-21.0%
Cash-on-Cash Return
0.9%
Cap rate
0.1%
Rent to Value Ratio

Active
$1,525,000
4
bds
|
3
ba
|
3,002
sqft
|
built
2021
3834 E Clarendon Ave, Phoenix, AZ 85018
$-2,215
Cash flow
-7.6%
Cash-on-Cash Return
3.9%
Cap rate
0.5%
Rent to Value Ratio
Active
$1,795,000
5
bds
|
3
ba
|
2,650
sqft
|
built
1957
3308 N 51st St, Phoenix, AZ 85018
$-4,990
Cash flow
-14.5%
Cash-on-Cash Return
2.3%
Cap rate
0.3%
Rent to Value Ratio

Active
$2,899,000
4
bds
|
4
ba
|
3,450
sqft
|
built
2025
3301 E Elm St, Phoenix, AZ 85018
$-11,969
Cash flow
-21.5%
Cash-on-Cash Return
0.7%
Cap rate
0.1%
Rent to Value Ratio

Active
$849,000
3
bds
|
2
ba
|
2,231
sqft
|
built
1979
4317 E Glenrosa Ave, Phoenix, AZ 85018
$-2,076
Cash flow
-12.8%
Cash-on-Cash Return
2.7%
Cap rate
0.4%
Rent to Value Ratio

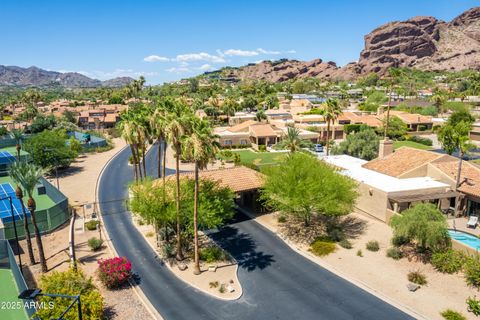
Active
$2,000,000
3
bds
|
3
ba
|
2,094
sqft
|
built
1957
4596 E Calle Ventura, Phoenix, AZ 85018
$-7,412
Cash flow
-19.3%
Cash-on-Cash Return
1.2%
Cap rate
0.2%
Rent to Value Ratio

Active
$649,900
3
bds
|
2
ba
|
1,345
sqft
|
built
1953
4142 N 35th St, Phoenix, AZ 85018
$-1,525
Cash flow
-12.2%
Cash-on-Cash Return
2.9%
Cap rate
0.4%
Rent to Value Ratio

Active
$1,295,000
4
bds
|
3
ba
|
2,514
sqft
|
built
2016
3720 N 40th Pl, Phoenix, AZ 85018
$-2,119
Cash flow
-8.5%
Cash-on-Cash Return
3.7%
Cap rate
0.5%
Rent to Value Ratio

Active
$1,874,900
4
bds
|
4
ba
|
3,110
sqft
|
built
2018
4817 N 35th St, Phoenix, AZ 85018
$-4,207
Cash flow
-11.7%
Cash-on-Cash Return
3.0%
Cap rate
0.4%
Rent to Value Ratio

Active
$4,750,000
5
bds
|
6
ba
|
4,387
sqft
|
built
2023
4502 E Solano Dr, Phoenix, AZ 85018
$-17,412
Cash flow
-19.1%
Cash-on-Cash Return
1.3%
Cap rate
0.2%
Rent to Value Ratio