

$5,950,000
Investment Summary
- Monthly Cash Flow
- -$29,054
- Cap Rate
- 0.3%
- Cash-on-Cash Return
- -25.5%
- Debt Coverage Ratio
- 0.05
- Internal Rate of Return (5 years)
- -20.6%
Cash Flow
Net Operating Income (NOI) minus mortgage payments.
Calculation:
NOI - Mortgage Payments
Cap Rate (Market Value)
Capitalization Rate is a rate of return that compares the yearly Net Operating Income (NOI) to the market value.
Calculation:
NOI / Market Value
Cash-on-Cash Return (CoC)
Annual Cash Flow / Cash Invested
Calculation:
Annual cash flow divided by initial cash invested.
Debt Coverage Ratio (DCR)
Net Operating Income (NOI) divided by total debt payments.
Calculation:
NOI / Total Debt Payments
Internal Rate of Return (IRR)
A metric for assessing profitability over time. IRR is the discount rate at which the net present value (NPV) of all future cash flows (positive and negative) from an investment equals zero — including both periodic cash flow (such as rent) and a projected sale at the end of the holding period. It represents the expected annualized return, accounting for income, expenses, and the recovery of capital through a future sale.
Property Description
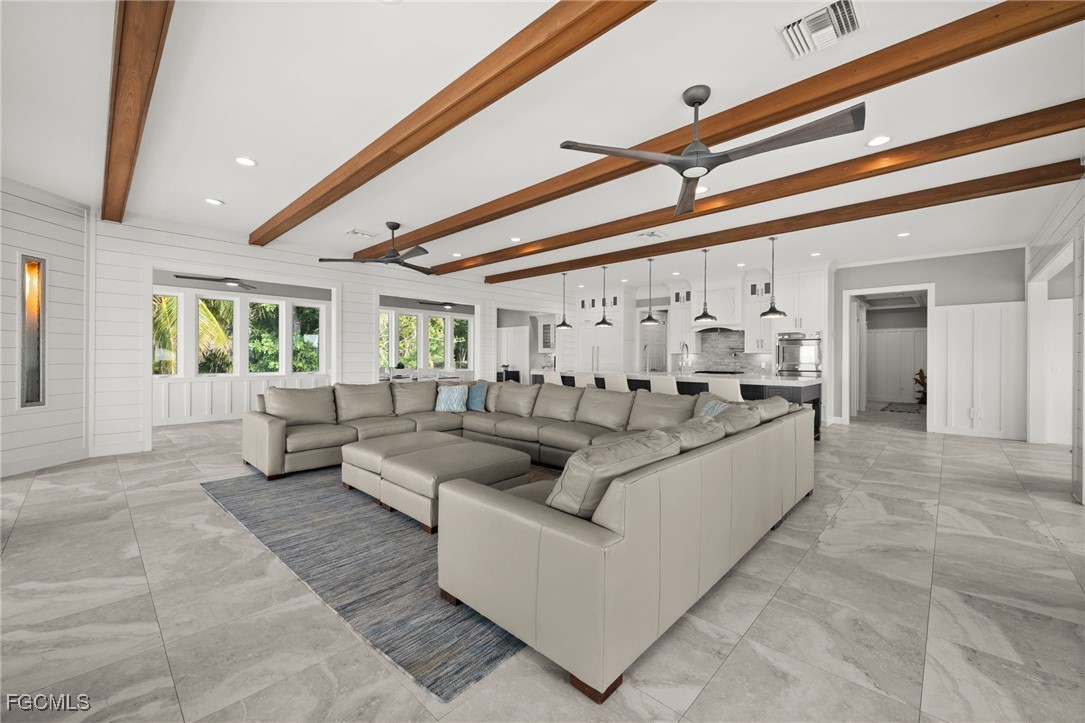
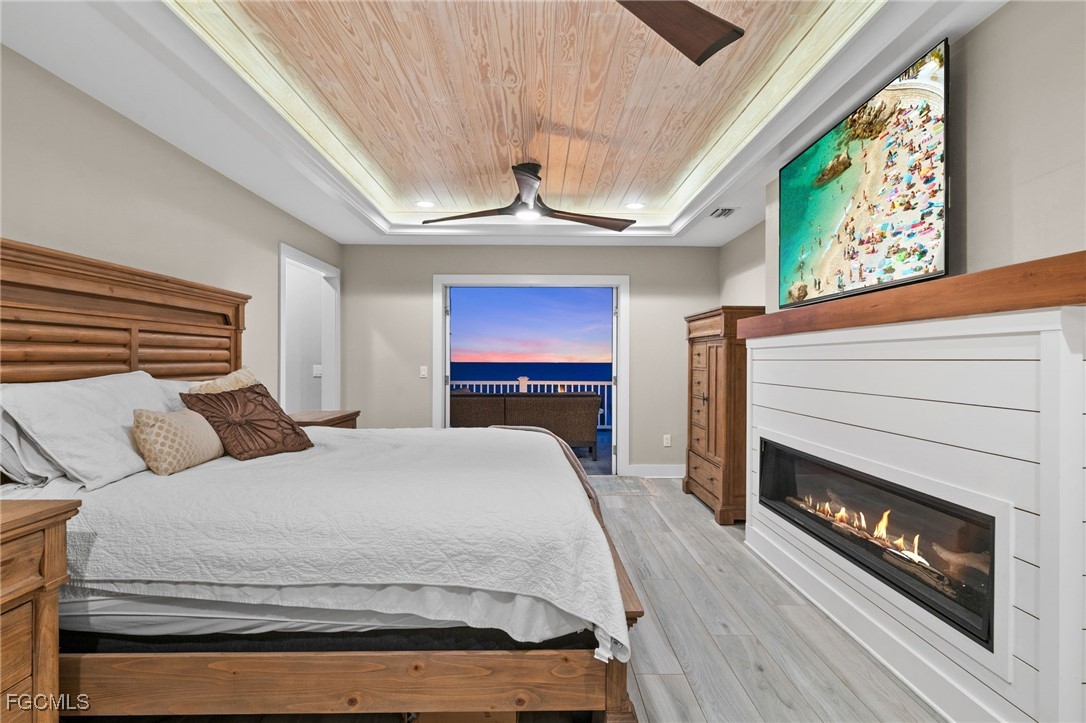
Experience the pinnacle of coastal luxury on Charlotte Harbor with this extraordinary estate, just 15 minutes from the famous Boca Grande Sandbar and some of the best tarpon fishing waters in the world. This home offers over 5,000 square feet of living space elevated above the flood zone and an astounding 227 feet of water frontage, making it one of the most in demand waterfront lots on Pine Island. With panoramic water views reaching up to 17 miles across the harbor, this home captures the true essence of Florida living, blending elegance, comfort, and unparalleled natural beauty. A recently built pool with an infinity-edge spa (completed in 2020) sets the tone for the home’s resort-style atmosphere, surrounded by lush landscaping, mature palms, and a trellis-covered walkway. Outdoor living is elevated with a fully equipped tiki bar, a large paver deck, landscape lighting, and a 300-foot private dock complete with a boat lift, included boat, and room to accommodate additional lifts. The gated and fenced yard adds both privacy and security, while two raised-platform generators and smart-metered propane tanks ensure year-round peace of mind. In 2021 this home was completely redone from the ground up. Inside, every detail has been thoughtfully curated. The expansive open-concept main floor features shiplap accent walls, woodgrain ceiling fans, and recessed wood panel ceilings throughout all five bedrooms. The living area centers around a dramatic Hellfire 360 contemporary fireplace, creating a warm and stylish focal point. The chef’s kitchen impresses with a massive Thermador refrigerator that blends seamlessly with custom cabinetry, an oversized island with integrated accessories, and a built-in bar perfect for entertaining. Speaking of fun, there's an additional 2,996 sq feet of finished space under air with full bathroom on the ground level making it perfect for unwinding after time at the beach. Each of the six bedrooms includes a full en-suite bathroom, and the master suite is a private retreat featuring a gas fireplace, a freestanding soaking tub, and a spacious walk-in shower with multiple heads, including a rain feature. Natural light pours into the home through impact-rated windows and sliding doors, illuminating every corner and highlighting the thoughtful coastal design. A spacious second-floor balcony invites quiet mornings and sunset views, while a built-in sound system with ceiling-mounted speakers enhances both indoor and outdoor ambiance. Additional highlights include a four-car garage, an elevator for effortless access between levels, a full irrigation system, and flood openings in the ground-level walls for added protection. The home is being offered fully furnished, making it move-in ready for year-round living or a luxurious seasonal escape. This rare and expansive waterfront property offers a once-in-a-lifetime opportunity to own a legacy home in one of Florida’s most scenic and peaceful coastal settings.
Build Your Team
Quickly find investor-friendly professionals who can help you succeed in real estate investing at any stage of the investing journey.


Agents
Match with investor-friendly agents who can help you find, analyze, and close your next deal


Lenders
Get the best funding…find investor-friendly lenders who specialize in your deal strategy


Property Managers
Transition to passive investing. Find a trusted property management partnership that lasts.


Tax Pros & Accountants
Taxes and financial reporting made easy—find experts to create tax savings strategies, file taxes, and more
Location
Property Details
Parking
- Description: AttachedCarport
- Details: Attached, Circular Driveway, Driveway, Garage, Paved, Garage Door Opener
- Garage Spaces: 4
- Spaces Total: 0
Bedroom Information
- # of Bedrooms: 6
Bathroom Information
- # of Baths (Full): 6
- # of Baths (Total): 7.0
Interior Features
- # of Rooms: 0
- # of Stories: 3
- Fireplace: Yes
Exterior Features
- Foundation: Pillar/Post/Pier
- Roof Type: IRR/Cathedral
- Roof Material: Metal
- Pool: Yes
Land Information
- Land Use: Residential
- Land Use Subtype: Single Family Residential
Lot Information
- Parcel ID: 3043220100037.0010
- Lot Size: 0 sqft
Property Information
- Property Type: Single Family Residence
- Style: Multi Level, Two Story
- Year Built: 1987
Tax Information
- Annual Tax: $20,993
Utilities
- Water & Sewer: Public
- Heating: Central, Electric
- Cooling: Central Air, Ceiling Fan(s), Electric, Gas
Location
- County: Lee
Listing Details
Investment Summary
- Monthly Cash Flow
- -$29,054
- Cap Rate
- 0.3%
- Cash-on-Cash Return
- -25.5%
- Debt Coverage Ratio
- 0.05
- Internal Rate of Return (5 years)
- -20.6%
Cash Flow
Net Operating Income (NOI) minus mortgage payments.
Calculation:
NOI - Mortgage Payments
Cap Rate (Market Value)
Capitalization Rate is a rate of return that compares the yearly Net Operating Income (NOI) to the market value.
Calculation:
NOI / Market Value
Cash-on-Cash Return (CoC)
Annual Cash Flow / Cash Invested
Calculation:
Annual cash flow divided by initial cash invested.
Debt Coverage Ratio (DCR)
Net Operating Income (NOI) divided by total debt payments.
Calculation:
NOI / Total Debt Payments
Internal Rate of Return (IRR)
A metric for assessing profitability over time. IRR is the discount rate at which the net present value (NPV) of all future cash flows (positive and negative) from an investment equals zero — including both periodic cash flow (such as rent) and a projected sale at the end of the holding period. It represents the expected annualized return, accounting for income, expenses, and the recovery of capital through a future sale.
Purchase Details
Purchase PriceThe price paid for the property. Purchase price:
| $5,950,000 |
|---|---|
Amount FinancedThe amount of the purchase financed through a loan. Amount financed:
| -$4,760,000 |
Down paymentThe initial payment made towards the purchase. Down payment:
| $1,190,000 |
Closing CostsFees and expenses associated with purchasing a property, typically ranging from 2% to 5% of the home’s purchase price, paid at the end of a home purchase to cover services like lending, title transfer, and taxes. Closing costs:
| $178,500 |
Rehab CostsCosts incurred to repair or improve the property, including: roof, flooring, exterior siding, kitchen, exterior paint, bathrooms, etc. Rehab costs:
| $0 |
Initial Cash InvestedThe total initial cash invested in the property. Calculation:Down payment + Buying costs + Rehab costs Initial cash invested:
| $1,368,500 |
Square Feet (SQFT)The total square footage of the property. Square feet:
| 5,151 |
Cost Per Square FootCost per square foot of the property. Calculation:Purchase Price / Square Feet Cost per square foot:
| $1,155 |
Monthly Rent Per Square FootMonthly rent divided by the number of square feet. This ratio helps investors compare rental income efficiency across properties, markets, and unit sizes Calculation:Monthly Rent / Square Feet Monthly rent per square foot:
| $0.89 |
Financing Details
Loan AmountThe total sum of money borrowed from a lender to finance a property purchase. Calculation:Purchase Price - Down Payment
Loan amount:
| $4,760,000 |
|---|---|
Loan to Value Ratio (LTV)Loan amount divided by the market value of the property. Calculation:Loan Amount / Market Value
Loan to value ratio:
| 80.0% |
Loan TypeThe type of loan (e.g., fixed, adjustable).
Loan type:
| Amortizing |
TermThe loan repayment period in years.
Term:
| 30 years |
Interest RateThe percentage a lender charges on the borrowed amount of a loan, determining the cost of borrowing money.
Interest rate:
| 6.625% |
Principal & Interest (PI)The principal is the portion of the loan payment that reduces the loan balance. The interest is the lender's charge for borrowing money. Calculation:(P * r * (1 + r) ** n) / ((1 + r) ** n - 1) Where:
P = Loan amount (principal)
Principal & interest:
| $30,479 |
Property TaxesAnnual taxes levied by local governments on real estate properties. These taxes fund public services like schools, roads, and emergency services.
Property tax:
| $1,749 |
InsuranceThe costs for insurance coverage to protect against financial losses due to risks like fire, natural disasters, theft, liability, or tenant-related damages. Calculation:Assumes 7% of gross rental income, unless insurance rates are specified.
Insurance:
| $322 |
Private Mortgage Insurance (PMI)A fee that borrowers pay when they take out a conventional loan with a loan-to-value (LTV) ratio above 80%.
Private mortgage insurance (PMI):
| $0 |
Monthly PaymentThe fixed amount a borrower pays each month to repay a loan. It typically includes principal and interest (P&I) and may also cover property taxes, insurance, HOA fees, and PMI if escrowed. Monthly payment:
| $32,550 |
Operating Income
| % Rent | Monthly | Yearly | |
|---|---|---|---|
Gross RentThe total rental income received from tenants before deducting any expenses. Includes base rent, late fees, pet fees, parking fees, and other recurring charges.
Gross rent:
| $4,600 | $55,200 | |
Vacancy LossExpected loss of rent due to vacancies.
Vacancy loss:
(6%)
| 6% | -$276 | -$3,312 |
Operating IncomeGross rental income minus vacancy loss. Calculation:Gross rent - Vacancy loss
Operating income:
| $4,324 | $51,888 |
Operating Expenses
| % Rent | Monthly | Yearly | |
|---|---|---|---|
Property TaxesAnnual taxes levied by local governments on real estate properties. These taxes fund public services like schools, roads, and emergency services. | 38% | -$1,749 | -$20,993 |
InsuranceThe costs for insurance coverage to protect against financial losses due to risks like fire, natural disasters, theft, liability, or tenant-related damages. Calculation:Assumes 7% of gross rental income, unless insurance rates are specified. | 7% | -$322 | -$3,864 |
Property ManagementThe costs associated with hiring a property manager to handle the day-to-day operations of a rental property. Includes management fees, leasing fes, eviction fees, etc. Calculation:Assumes 8% of gross rental income. | 8% | -$368 | -$4,416 |
Repairs & MaintenanceOngoing costs for routine upkeep and minor fixes needed to keep a property in good working condition. Calculation:Assumes 5% of gross rental income. Varies by property age and condition. | 5% | -$230 | -$2,760 |
Capital ExpensesLarge, infrequent costs for major improvements or replacements, like a new roof, HVAC system, or appliances. Calculation:Assumes 5% of gross rental income. Varies by property age. | 5% | -$230 | -$2,760 |
HOA FeesRegular dues paid to a Homeowners Association for community maintenance, amenities, and management. Similar fees include: Condo Association Fees, Co-op Maintenance Fees, etc. | n/a | n/a | n/a |
Operating ExpensesRecurring costs required to maintain and manage a rental property, including property taxes, insurance, maintenance, repairs, utilities (if paid by the owner), property management fees, and other day-to-day expenses. Calculation:Insurance + Property Taxes + Property Management + Repairs & Maintenance + Capital Expenditures + HOA Fees | 63% | -$2,899 | -$34,793 |
Cash Flow
| Monthly | Yearly | |
|---|---|---|
Net Operating Income (NOI)The income generated from a property after deducting all operating expenses but before deducting mortgage payments, taxes, and capital expenditures. Calculation:Gross Operating Income - Operating Expenses
Net operating income:
| $1,425 | $17,100 |
Mortgage PaymentThe fixed amount a borrower pays each month to repay a loan. It typically includes principal and interest (P&I) and may also cover property taxes, insurance, HOA fees, and PMI if escrowed. | -$30,479 | -$365,748 |
Cash FlowNet Operating Income (NOI) minus mortgage payments. Calculation:NOI - Mortgage Payments | $29,054 | $348,648 |