
$789,000
Investment Summary
- Monthly Cash Flow
- -$1,939
- Cap Rate
- 2.7%
- Cash-on-Cash Return
- -12.8%
- Debt Coverage Ratio
- 0.48
- Internal Rate of Return (5 years)
- -8.4%
Cash Flow
Net Operating Income (NOI) minus mortgage payments.
Calculation:
NOI - Mortgage Payments
Cap Rate (Market Value)
Capitalization Rate is a rate of return that compares the yearly Net Operating Income (NOI) to the market value.
Calculation:
NOI / Market Value
Cash-on-Cash Return (CoC)
Annual Cash Flow / Cash Invested
Calculation:
Annual cash flow divided by initial cash invested.
Debt Coverage Ratio (DCR)
Net Operating Income (NOI) divided by total debt payments.
Calculation:
NOI / Total Debt Payments
Internal Rate of Return (IRR)
A metric for assessing profitability over time. IRR is the discount rate at which the net present value (NPV) of all future cash flows (positive and negative) from an investment equals zero — including both periodic cash flow (such as rent) and a projected sale at the end of the holding period. It represents the expected annualized return, accounting for income, expenses, and the recovery of capital through a future sale.
Property Description
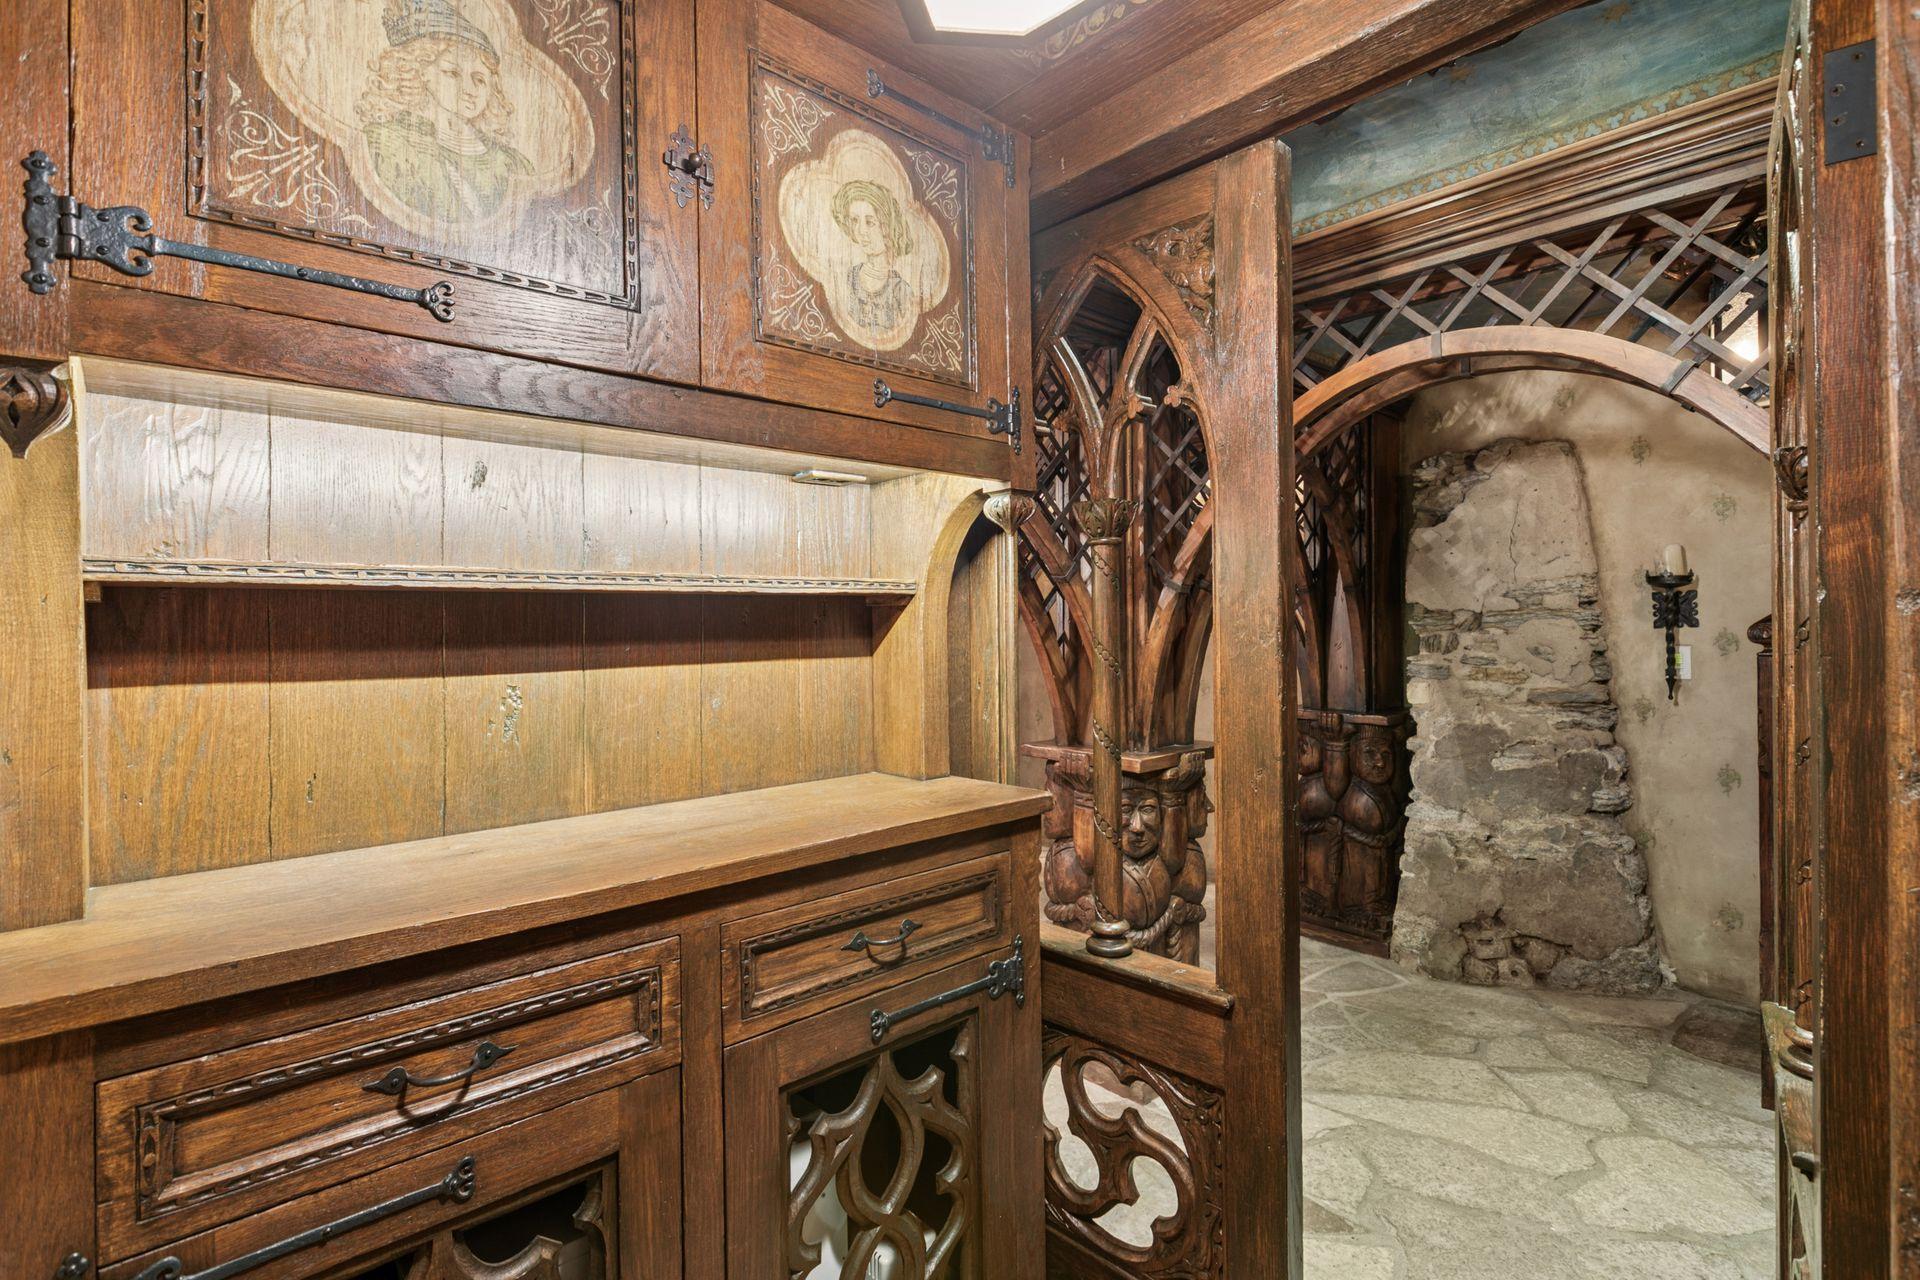
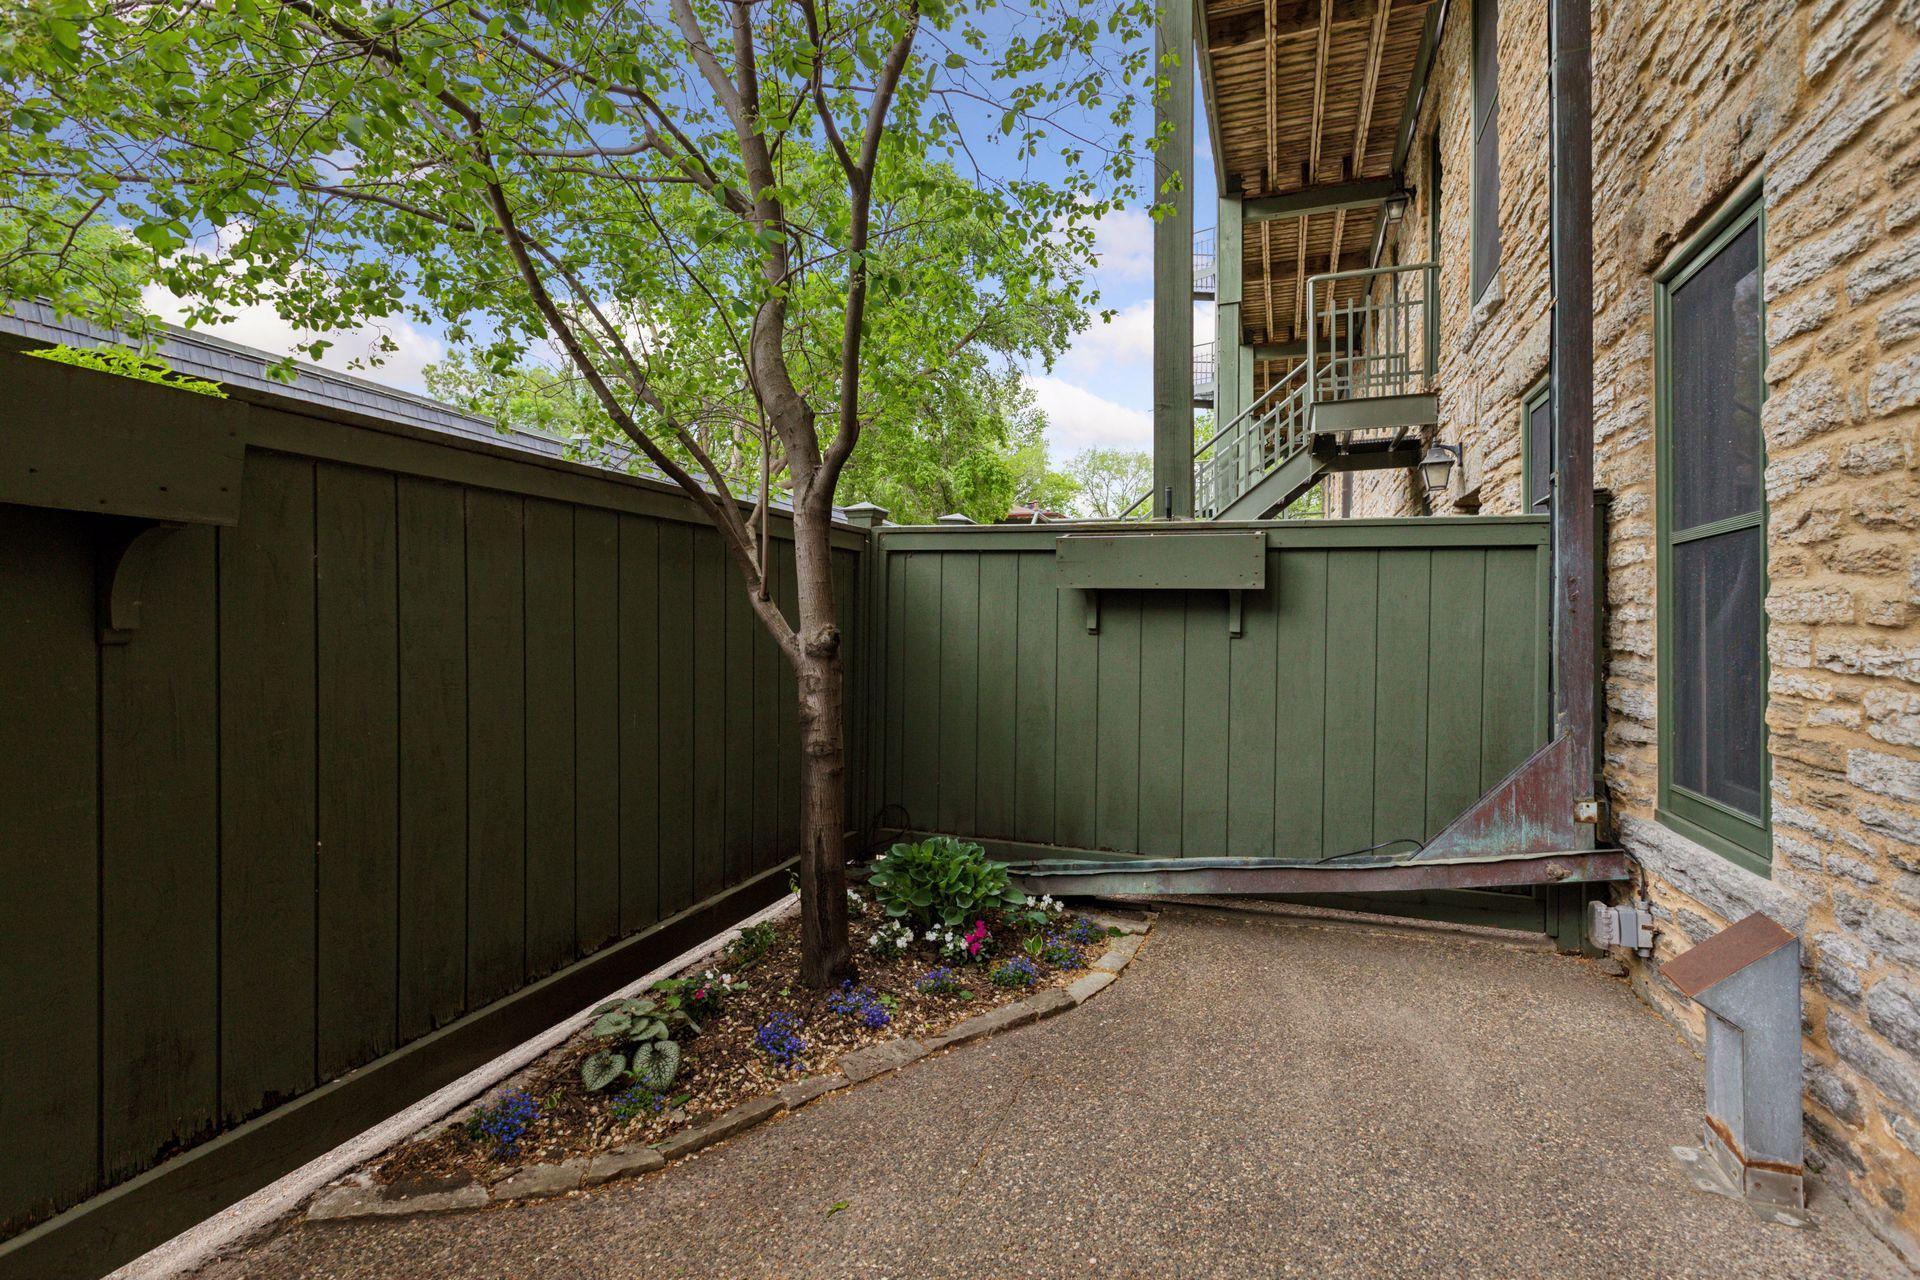
Sought after quiet and serene Nicollet Island in-between downtown Minneapolis and Artistic Northeast Minneapolis boasts over $3 million in renovations. Rarely available, this fully custom historic registered property built in 1877 in the French 2nd Empire style is an architectural gem that offers an unparalleled living experience. Step into the grand foyer, where only four exclusive residences reside. This unit unveils a world of wonder behind its 8-foot doors. Hand-painted 9 and 10-foot ceilings evoke the grandeur and scenes of the Palace of Versailles, transporting you to another era. Admire custom wood stair railings, gleaming hardwood floors, and the warmth of a Heat-N-Glow gas fireplace in the main living and sitting room. Immerse yourself in a world of luxury with velvet-clad walls, a groin vaulted ceiling, a solid marble floor, and exquisite custom wood framing. The Gourmet Kitchen: Indulge your culinary passions in this masterpiece featuring barrel ceilings, authenticated chandeliers, copper-stamped ceiling tiles, an AGA range, under-cabinet lighting, a walk-in pantry, built-in Sub Zero and Fischer and Paykel appliances, and custom mosaic backsplashes. A Fusion of Cultures: Descend one level to a realm of Asian influence, where marble floors, intricate wood carvings, ornate metal work, coffered hand painted ceilings, and Soji screen-inspired doors and wall dividers create a serene atmosphere. Primary Ensuite: Unwind in a luxurious primary ensuite featuring a solid stone tub with a custom dragon faucet carved from a single slab. Enjoy the rejuvenating experience of a separate private steam shower with stone floors. The Second Bedroom/Den is a versatile space and showcases a wood clad and beamed ceiling, a cork floor with walnut inlay, custom stained glass windows, quarter-sawn oak wainscoting, and a picture rail, and bookcase. From here step out onto the private fenced back patio with ornamental tree, and savor the tranquility of summer evenings. Descend one level further down to a unique sublevel, a masterpiece featuring hand-painted walls and ceilings, hand-carved wood pillars, arched woven lattice with backlighting, and a captivating waterfall feature on the stone wall. Complete with a wet bar and a beverage fridge with ice maker, makes this space is perfect for hosting unforgettable gatherings, game nights, and more. Every surface of this extraordinary residence is a testament to meticulous local craftsmanship and exquisite design. And just outside your door is the River and City Skyline view. You can enjoy the trails and parkways of the Grand Rounds Scenic Byway that showcase parks and lakes, gardens, historical sites, and diverse neighborhoods. Including award wining restaurants, music venues, The Guthrie Theater, and parks that feature amphitheaters, annual festivals and all the eclectic vibrancy that is the Twin Cities. Consistently rated one of the best places to live in the country.
Build Your Team
Quickly find investor-friendly professionals who can help you succeed in real estate investing at any stage of the investing journey.


Agents
Match with investor-friendly agents who can help you find, analyze, and close your next deal


Lenders
Get the best funding…find investor-friendly lenders who specialize in your deal strategy


Property Managers
Transition to passive investing. Find a trusted property management partnership that lasts.


Tax Pros & Accountants
Taxes and financial reporting made easy—find experts to create tax savings strategies, file taxes, and more
Location
Property Details
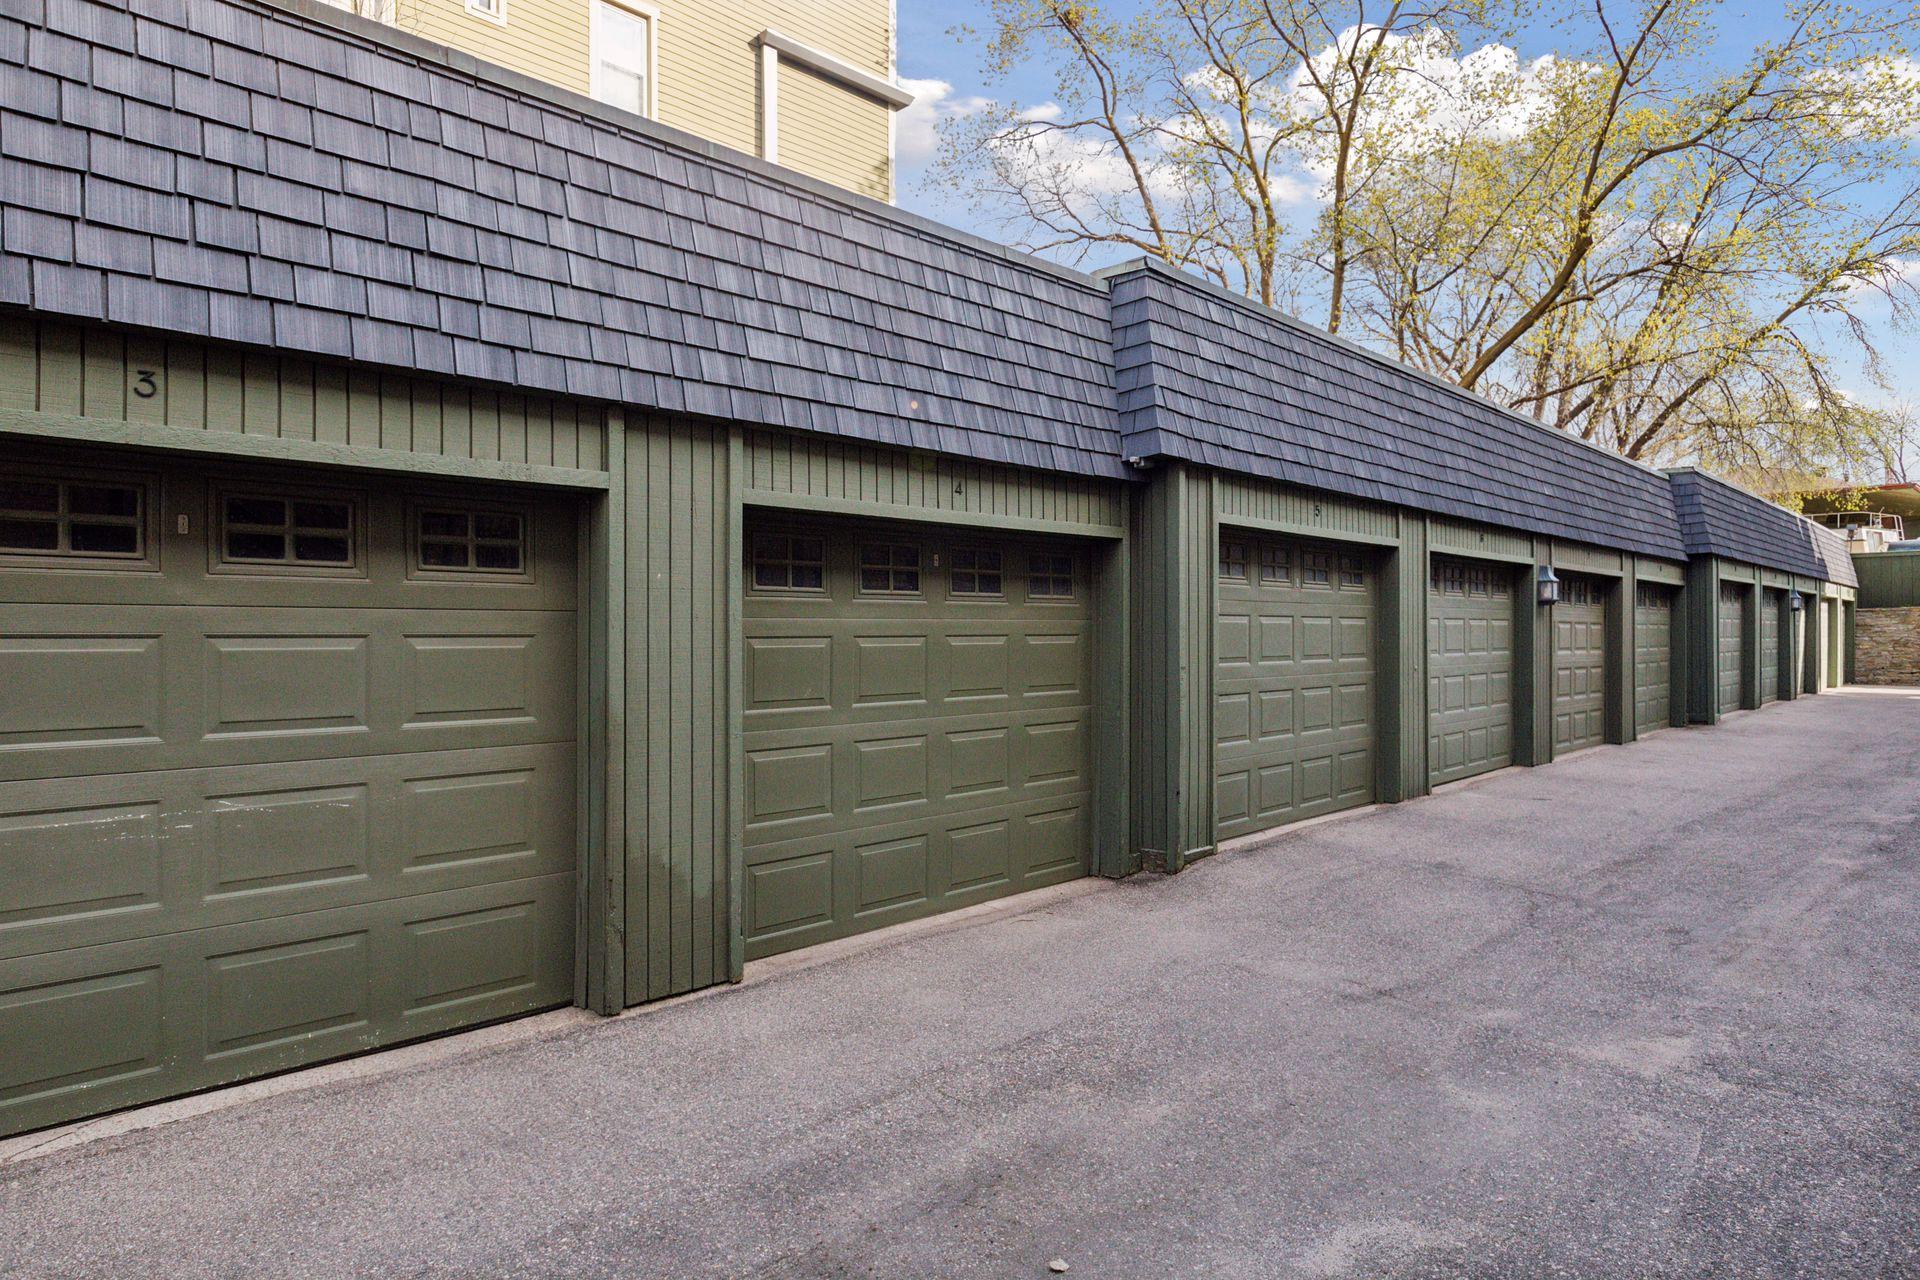
Parking
- Description: Assigned, Detached, Asphalt, Electric, Garage Door Opener, Other, More Parking Offsite for Fee, Storage, Open
- Details: Assigned, Garage Door Opener, Storage, Other
- Garage Spaces: 1
- Spaces Total: 0
Bedroom Information
- # of Bedrooms: 2
Bathroom Information
- # of Baths (Full): 1
- # of Baths (Partial): 1
- # of Baths (Total): 2.0
Interior Features
- # of Rooms: 8
- # of Stories: 2
- Basement: Yes
- Basement Description: Full
- Fireplace: Yes
Exterior Features
- Exterior Walls Materials: Rock, Stone
- Foundation: Brick/Mortar, Stone
- Roof Type: Flat
- Roof Material: Flat, Rubber
HOA
- Has HOA: Yes
- Association: Omega
- HOA Fee: $1,029/monthly
Land Information
- Land Use: Residential
- Land Use Subtype: Condominium Unit
Lot Information
- Parcel ID: 2302924230045
- Lot Size: 21780 sqft
Property Information
- Property Type: Townhouse
- Style: (TH) Side x Side
- Year Built: 1877
Tax Information
- Annual Tax: $7,509
Utilities
- Water & Sewer: Public
- Heating: Forced Air
- Cooling: Central Air
Location
- County: Hennepin
Listing Details
Investment Summary
- Monthly Cash Flow
- -$1,939
- Cap Rate
- 2.7%
- Cash-on-Cash Return
- -12.8%
- Debt Coverage Ratio
- 0.48
- Internal Rate of Return (5 years)
- -8.4%
Cash Flow
Net Operating Income (NOI) minus mortgage payments.
Calculation:
NOI - Mortgage Payments
Cap Rate (Market Value)
Capitalization Rate is a rate of return that compares the yearly Net Operating Income (NOI) to the market value.
Calculation:
NOI / Market Value
Cash-on-Cash Return (CoC)
Annual Cash Flow / Cash Invested
Calculation:
Annual cash flow divided by initial cash invested.
Debt Coverage Ratio (DCR)
Net Operating Income (NOI) divided by total debt payments.
Calculation:
NOI / Total Debt Payments
Internal Rate of Return (IRR)
A metric for assessing profitability over time. IRR is the discount rate at which the net present value (NPV) of all future cash flows (positive and negative) from an investment equals zero — including both periodic cash flow (such as rent) and a projected sale at the end of the holding period. It represents the expected annualized return, accounting for income, expenses, and the recovery of capital through a future sale.
Purchase Details
Purchase PriceThe price paid for the property. Purchase price:
| $789,000 |
|---|---|
Amount FinancedThe amount of the purchase financed through a loan. Amount financed:
| -$631,200 |
Down paymentThe initial payment made towards the purchase. Down payment:
| $157,800 |
Closing CostsFees and expenses associated with purchasing a property, typically ranging from 2% to 5% of the home’s purchase price, paid at the end of a home purchase to cover services like lending, title transfer, and taxes. Closing costs:
| $23,670 |
Rehab CostsCosts incurred to repair or improve the property, including: roof, flooring, exterior siding, kitchen, exterior paint, bathrooms, etc. Rehab costs:
| $0 |
Initial Cash InvestedThe total initial cash invested in the property. Calculation:Down payment + Buying costs + Rehab costs Initial cash invested:
| $181,470 |
Square Feet (SQFT)The total square footage of the property. Square feet:
| 1,799 |
Cost Per Square FootCost per square foot of the property. Calculation:Purchase Price / Square Feet Cost per square foot:
| $439 |
Monthly Rent Per Square FootMonthly rent divided by the number of square feet. This ratio helps investors compare rental income efficiency across properties, markets, and unit sizes Calculation:Monthly Rent / Square Feet Monthly rent per square foot:
| $2.78 |
Financing Details
Loan AmountThe total sum of money borrowed from a lender to finance a property purchase. Calculation:Purchase Price - Down Payment
Loan amount:
| $631,200 |
|---|---|
Loan to Value Ratio (LTV)Loan amount divided by the market value of the property. Calculation:Loan Amount / Market Value
Loan to value ratio:
| 80.0% |
Loan TypeThe type of loan (e.g., fixed, adjustable).
Loan type:
| Amortizing |
TermThe loan repayment period in years.
Term:
| 30 years |
Interest RateThe percentage a lender charges on the borrowed amount of a loan, determining the cost of borrowing money.
Interest rate:
| 5.875% |
Principal & Interest (PI)The principal is the portion of the loan payment that reduces the loan balance. The interest is the lender's charge for borrowing money. Calculation:(P * r * (1 + r) ** n) / ((1 + r) ** n - 1) Where:
P = Loan amount (principal)
Principal & interest:
| $3,734 |
Property TaxesAnnual taxes levied by local governments on real estate properties. These taxes fund public services like schools, roads, and emergency services.
Property tax:
| $626 |
InsuranceThe costs for insurance coverage to protect against financial losses due to risks like fire, natural disasters, theft, liability, or tenant-related damages. Calculation:Assumes 7% of gross rental income, unless insurance rates are specified.
Insurance:
| $350 |
Private Mortgage Insurance (PMI)A fee that borrowers pay when they take out a conventional loan with a loan-to-value (LTV) ratio above 80%.
Private mortgage insurance (PMI):
| $0 |
Monthly PaymentThe fixed amount a borrower pays each month to repay a loan. It typically includes principal and interest (P&I) and may also cover property taxes, insurance, HOA fees, and PMI if escrowed. Monthly payment:
| $4,710 |
Operating Income
| % Rent | Monthly | Yearly | |
|---|---|---|---|
Gross RentThe total rental income received from tenants before deducting any expenses. Includes base rent, late fees, pet fees, parking fees, and other recurring charges.
Gross rent:
| $5,000 | $60,000 | |
Vacancy LossExpected loss of rent due to vacancies.
Vacancy loss:
(6%)
| 6% | -$300 | -$3,600 |
Operating IncomeGross rental income minus vacancy loss. Calculation:Gross rent - Vacancy loss
Operating income:
| $4,700 | $56,400 |
Operating Expenses
| % Rent | Monthly | Yearly | |
|---|---|---|---|
Property TaxesAnnual taxes levied by local governments on real estate properties. These taxes fund public services like schools, roads, and emergency services. | 13% | -$626 | -$7,509 |
InsuranceThe costs for insurance coverage to protect against financial losses due to risks like fire, natural disasters, theft, liability, or tenant-related damages. Calculation:Assumes 7% of gross rental income, unless insurance rates are specified. | 7% | -$350 | -$4,200 |
Property ManagementThe costs associated with hiring a property manager to handle the day-to-day operations of a rental property. Includes management fees, leasing fes, eviction fees, etc. Calculation:Assumes 8% of gross rental income. | 8% | -$400 | -$4,800 |
Repairs & MaintenanceOngoing costs for routine upkeep and minor fixes needed to keep a property in good working condition. Calculation:Assumes 5% of gross rental income. Varies by property age and condition. | 5% | -$250 | -$3,000 |
Capital ExpensesLarge, infrequent costs for major improvements or replacements, like a new roof, HVAC system, or appliances. Calculation:Assumes 5% of gross rental income. Varies by property age. | 5% | -$250 | -$3,000 |
HOA FeesRegular dues paid to a Homeowners Association for community maintenance, amenities, and management. Similar fees include: Condo Association Fees, Co-op Maintenance Fees, etc. | 21% | -$1,029 | -$12,348 |
Operating ExpensesRecurring costs required to maintain and manage a rental property, including property taxes, insurance, maintenance, repairs, utilities (if paid by the owner), property management fees, and other day-to-day expenses. Calculation:Insurance + Property Taxes + Property Management + Repairs & Maintenance + Capital Expenditures + HOA Fees | 58% | -$2,905 | -$34,857 |
Cash Flow
| Monthly | Yearly | |
|---|---|---|
Net Operating Income (NOI)The income generated from a property after deducting all operating expenses but before deducting mortgage payments, taxes, and capital expenditures. Calculation:Gross Operating Income - Operating Expenses
Net operating income:
| $1,795 | $21,540 |
Mortgage PaymentThe fixed amount a borrower pays each month to repay a loan. It typically includes principal and interest (P&I) and may also cover property taxes, insurance, HOA fees, and PMI if escrowed. | -$3,734 | -$44,808 |
Cash FlowNet Operating Income (NOI) minus mortgage payments. Calculation:NOI - Mortgage Payments | -$1,939 | -$23,268 |