Minneapolis, MN Investment Properties for Sale
Browse homes for sale and investment properties in Minneapolis, MN. Refine your search by price, property type, or more.
Best cash flowing properties in Minneapolis, MN
Active
$60,000
0
bds
|
1
ba
|
554
sqft
|
built
1929
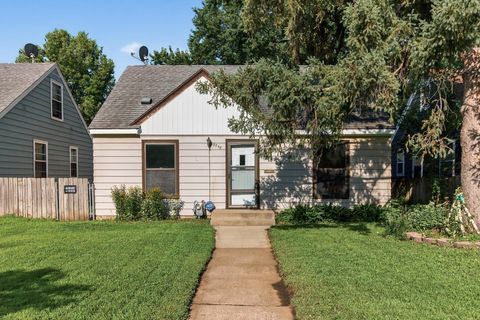
2615 Park Ave, Minneapolis, MN 55407
$2,677
Cash flow
52.0%
Cash-on-Cash Return
53.5%
Cap rate
8.3%
Rent to Value Ratio
Active
$200,000
4
bds
|
2
ba
|
1,605
sqft
|
built
1900
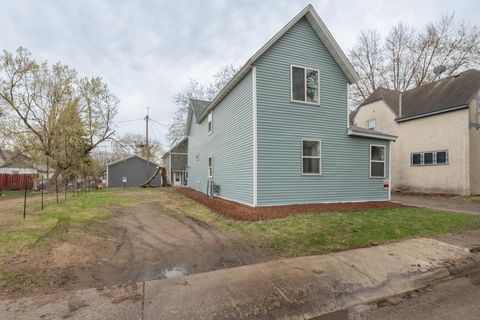
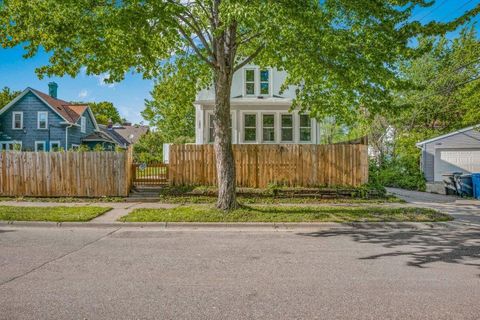
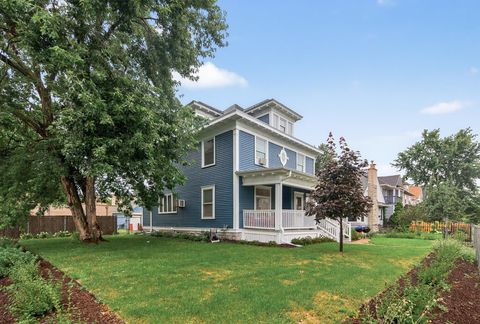
1811 Polk St NE, Minneapolis, MN 55418
$597
Cash flow
15.6%
Cash-on-Cash Return
9.3%
Cap rate
1.3%
Rent to Value Ratio
380 out of 555 properties for sale in Minneapolis, MN
Limited Results Shown
Create a free account, or log in to reveal all property listings and enjoy the complete experience.
Active
$275,000
1
bds
|
1
ba
|
978
sqft
|
built
1926
521 S 7th St, Minneapolis, MN 55415
$-892
Cash flow
-16.9%
Cash-on-Cash Return
1.8%
Cap rate
0.7%
Rent to Value Ratio
Active
$283,900
2
bds
|
2
ba
|
1,197
sqft
|
built
1981
121 Washington Ave S, Minneapolis, MN 55401
$-1,022
Cash flow
-18.8%
Cash-on-Cash Return
1.4%
Cap rate
0.7%
Rent to Value Ratio
Active
$250,000
1
bds
|
2
ba
|
860
sqft
|
built
2006
317 Groveland Ave, Minneapolis, MN 55403
$-247
Cash flow
-5.2%
Cash-on-Cash Return
4.5%
Cap rate
1.0%
Rent to Value Ratio
Active
$1,000,000
3
bds
|
3
ba
|
2,350
sqft
|
built
2006
215 10th Ave S, Minneapolis, MN 55415
$-4,947
Cash flow
-25.8%
Cash-on-Cash Return
-0.3%
Cap rate
0.4%
Rent to Value Ratio
Active
$239,900
3
bds
|
1
ba
|
1,513
sqft
|
built
1924
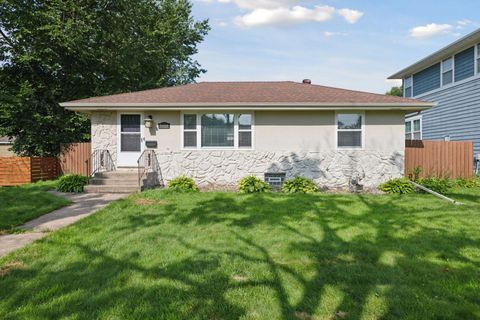
3301 Beard Ave N, Minneapolis, MN 55422
$-113
Cash flow
-2.5%
Cash-on-Cash Return
5.1%
Cap rate
0.8%
Rent to Value Ratio
Active
$900,000
5
bds
|
4
ba
|
4,322
sqft
|
built
1994
16035 36th Pl N, Minneapolis, MN 55446
$-2,496
Cash flow
-14.5%
Cash-on-Cash Return
2.4%
Cap rate
0.4%
Rent to Value Ratio
Active
$349,000
3
bds
|
2
ba
|
1,694
sqft
|
built
1956
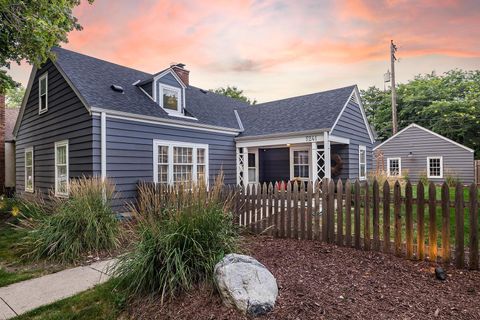
5414 27th Ave S, Minneapolis, MN 55417
$-117
Cash flow
-1.7%
Cash-on-Cash Return
5.3%
Cap rate
0.8%
Rent to Value Ratio
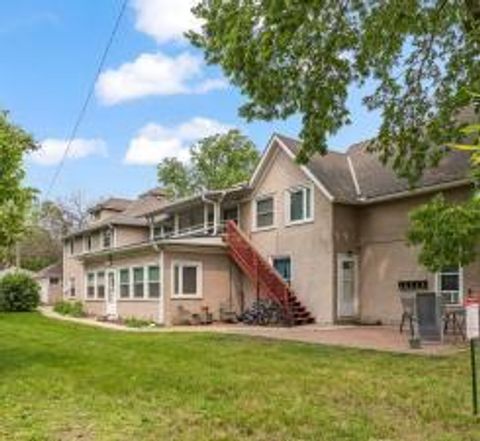
Active
$435,000
6
bds
|
2
ba
|
2,484
sqft
|
built
1900
823 20th Ave NE, Minneapolis, MN 55418
$-1,175
Cash flow
-14.1%
Cash-on-Cash Return
2.4%
Cap rate
0.5%
Rent to Value Ratio
Active
$699,000
3
bds
|
2
ba
|
2,344
sqft
|
built
1948
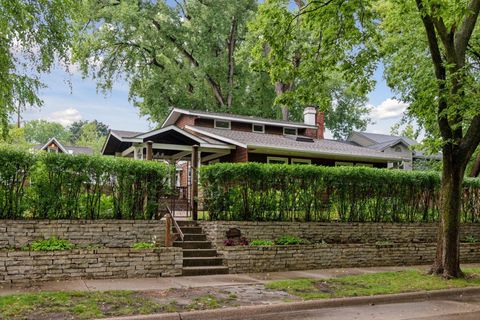
5241 Abbott Ave S, Minneapolis, MN 55410
$-1,575
Cash flow
-11.8%
Cash-on-Cash Return
3.0%
Cap rate
0.5%
Rent to Value Ratio
Active
$210,000
2
bds
|
2
ba
|
1,040
sqft
|
built
1965
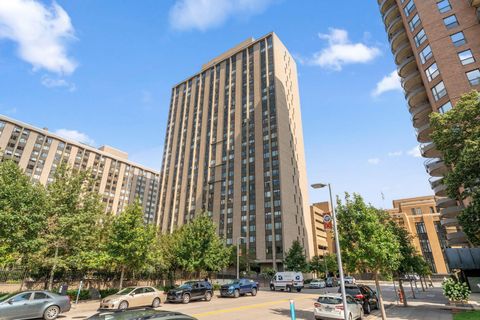
19 S 1st St, Minneapolis, MN 55401
$-1,067
Cash flow
-26.5%
Cash-on-Cash Return
-0.4%
Cap rate
0.8%
Rent to Value Ratio
Active
$365,000
3
bds
|
1
ba
|
1,345
sqft
|
built
1950
2622 Idaho Ave S, Minneapolis, MN 55426
$-217
Cash flow
-3.1%
Cash-on-Cash Return
5.0%
Cap rate
0.7%
Rent to Value Ratio
Active
$495,000
7
bds
|
4
ba
|
2,775
sqft
|
built
1903
3033 Park Ave, Minneapolis, MN 55407
$-1,315
Cash flow
-13.9%
Cash-on-Cash Return
2.5%
Cap rate
0.5%
Rent to Value Ratio
Active
$475,000
3
bds
|
2
ba
|
1,914
sqft
|
built
1993
5501 Humboldt Cir, Minneapolis, MN 55419
$-1,228
Cash flow
-13.5%
Cash-on-Cash Return
2.6%
Cap rate
0.6%
Rent to Value Ratio

Active
$1,495,000
2
bds
|
3
ba
|
2,533
sqft
|
built
1927
510 Groveland Ave, Minneapolis, MN 55403
$-9,853
Cash flow
-34.4%
Cash-on-Cash Return
-2.2%
Cap rate
0.3%
Rent to Value Ratio
Active
$178,000
7
bds
|
2
ba
|
2,788
sqft
|
built
1924
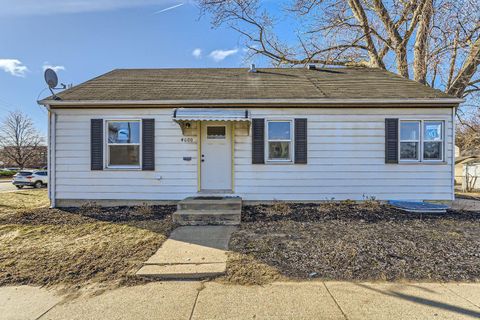
905 Queen Ave N, Minneapolis, MN 55411
$78
Cash flow
2.3%
Cash-on-Cash Return
6.2%
Cap rate
1.1%
Rent to Value Ratio
Active
$749,900
5
bds
|
3
ba
|
3,219
sqft
|
built
1960
4937 Sheridan Ave S, Minneapolis, MN 55410
$-2,907
Cash flow
-20.2%
Cash-on-Cash Return
1.0%
Cap rate
0.3%
Rent to Value Ratio
Active
$649,000
3
bds
|
4
ba
|
3,700
sqft
|
built
1919
741 Kenwood Pkwy, Minneapolis, MN 55403
$-1,221
Cash flow
-9.8%
Cash-on-Cash Return
3.4%
Cap rate
0.6%
Rent to Value Ratio

Active
$275,000
3
bds
|
2
ba
|
1,125
sqft
|
built
1917
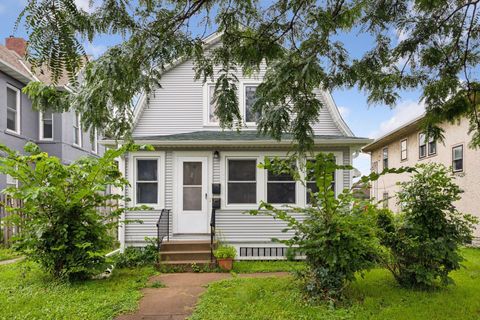
3835 Vincent Ave N, Minneapolis, MN 55412
$-89
Cash flow
-1.7%
Cash-on-Cash Return
5.3%
Cap rate
0.8%
Rent to Value Ratio

Active
$699,900
4
bds
|
3
ba
|
2,857
sqft
|
built
1941
1017 Thomas Ave S, Minneapolis, MN 55405
$-1,631
Cash flow
-12.2%
Cash-on-Cash Return
2.9%
Cap rate
0.6%
Rent to Value Ratio
Active
$299,900
2
bds
|
1
ba
|
933
sqft
|
built
1926
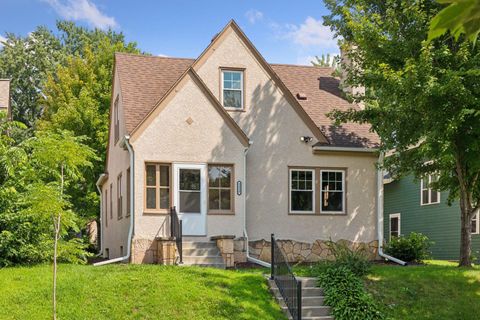
5641 Pillsbury Ave S, Minneapolis, MN 55419
$-324
Cash flow
-5.6%
Cash-on-Cash Return
4.4%
Cap rate
0.7%
Rent to Value Ratio
Active
$365,000
3
bds
|
2
ba
|
1,542
sqft
|
built
1953
4004 19th Ave S, Minneapolis, MN 55407
$-796
Cash flow
-11.4%
Cash-on-Cash Return
3.1%
Cap rate
0.5%
Rent to Value Ratio
Active
$249,900
5
bds
|
2
ba
|
1,514
sqft
|
built
1900
2504 Humboldt Ave N, Minneapolis, MN 55411
$-398
Cash flow
-8.3%
Cash-on-Cash Return
3.8%
Cap rate
0.6%
Rent to Value Ratio
Active
$329,900
4
bds
|
2
ba
|
1,500
sqft
|
built
1931
3530 Girard Ave N, Minneapolis, MN 55412
$-364
Cash flow
-5.8%
Cash-on-Cash Return
4.4%
Cap rate
0.6%
Rent to Value Ratio
Active
$249,900
3
bds
|
2
ba
|
1,840
sqft
|
built
1908
2924 Emerson Ave N, Minneapolis, MN 55411
$-237
Cash flow
-4.9%
Cash-on-Cash Return
4.5%
Cap rate
0.7%
Rent to Value Ratio
Active
$849,900
3
bds
|
3
ba
|
2,946
sqft
|
built
1900
3518 Chowen Pl, Minneapolis, MN 55416
$-2,156
Cash flow
-13.2%
Cash-on-Cash Return
2.6%
Cap rate
0.5%
Rent to Value Ratio
Active
$700,000
4
bds
|
2
ba
|
2,479
sqft
|
built
1909
3129 Holmes Ave S, Minneapolis, MN 55408
$-1,665
Cash flow
-12.4%
Cash-on-Cash Return
2.8%
Cap rate
0.5%
Rent to Value Ratio
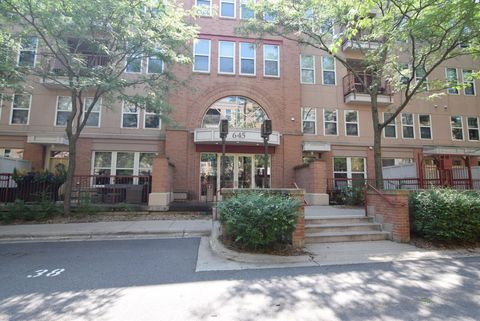
Active
$307,900
1
bds
|
2
ba
|
960
sqft
|
built
1999
645 N 1st St, Minneapolis, MN 55401
$-523
Cash flow
-8.9%
Cash-on-Cash Return
3.6%
Cap rate
0.9%
Rent to Value Ratio
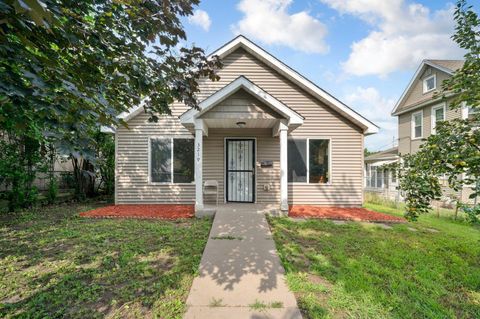
Active
$195,000
1
bds
|
1
ba
|
676
sqft
|
built
2010
3219 Lyndale Ave N, Minneapolis, MN 55412
$-133
Cash flow
-3.6%
Cash-on-Cash Return
4.9%
Cap rate
0.7%
Rent to Value Ratio
Active
$765,000
4
bds
|
3
ba
|
2,230
sqft
|
built
1952
5109 Abbott Ave S, Minneapolis, MN 55410
$-1,095
Cash flow
-7.5%
Cash-on-Cash Return
4.0%
Cap rate
0.6%
Rent to Value Ratio
Active
$299,900
3
bds
|
1
ba
|
1,580
sqft
|
built
1950
5748 25th Ave S, Minneapolis, MN 55417
$-210
Cash flow
-3.7%
Cash-on-Cash Return
4.8%
Cap rate
0.8%
Rent to Value Ratio
Active
$249,900
3
bds
|
2
ba
|
1,340
sqft
|
built
1911
1912 15th Ave N, Minneapolis, MN 55411
$-44
Cash flow
-0.9%
Cash-on-Cash Return
5.5%
Cap rate
0.8%
Rent to Value Ratio

Active
$1,369,900
5
bds
|
5
ba
|
5,289
sqft
|
built
1993
16720 45th Ave N, Minneapolis, MN 55446
$-3,960
Cash flow
-15.1%
Cash-on-Cash Return
2.2%
Cap rate
0.4%
Rent to Value Ratio
Active
$375,000
5
bds
|
2
ba
|
1,776
sqft
|
built
1949
4600 4th Ave S, Minneapolis, MN 55419
$-393
Cash flow
-5.5%
Cash-on-Cash Return
4.4%
Cap rate
0.6%
Rent to Value Ratio
Active
$419,000
7
bds
|
2
ba
|
2,486
sqft
|
built
1890
3208 Pleasant Ave, Minneapolis, MN 55408
$-1,170
Cash flow
-14.6%
Cash-on-Cash Return
2.3%
Cap rate
0.5%
Rent to Value Ratio
Active
$459,900
6
bds
|
3
ba
|
2,603
sqft
|
built
1900
3048 Columbus Ave, Minneapolis, MN 55407
$-244
Cash flow
-2.8%
Cash-on-Cash Return
5.0%
Cap rate
0.8%
Rent to Value Ratio
Active
$988,900
9
bds
|
4
ba
|
4,808
sqft
|
built
1913
3912 Blaisdell Ave, Minneapolis, MN 55409
$-3,946
Cash flow
-20.8%
Cash-on-Cash Return
0.9%
Cap rate
0.3%
Rent to Value Ratio
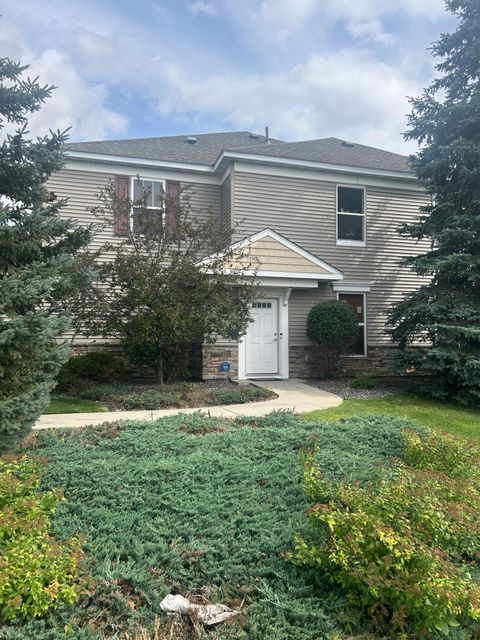
Active
$279,900
2
bds
|
3
ba
|
1,618
sqft
|
built
2006
5729 75th Ln N, Minneapolis, MN 55443
$-352
Cash flow
-6.6%
Cash-on-Cash Return
4.2%
Cap rate
0.8%
Rent to Value Ratio
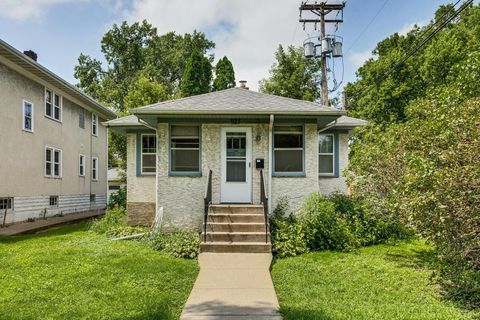
Active
$275,000
2
bds
|
1
ba
|
1,403
sqft
|
built
1927
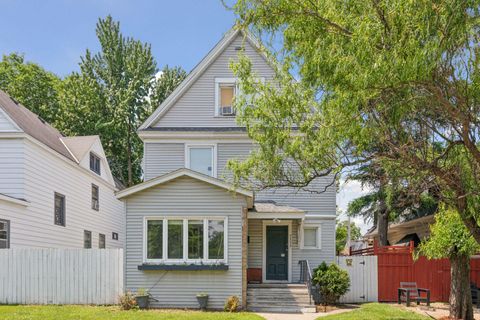
925 19th Ave SE, Minneapolis, MN 55414
$64
Cash flow
1.2%
Cash-on-Cash Return
6.0%
Cap rate
0.8%
Rent to Value Ratio