Minneapolis, MN Investment Properties for Sale
Browse homes for sale and investment properties in Minneapolis, MN. Refine your search by price, property type, or more.
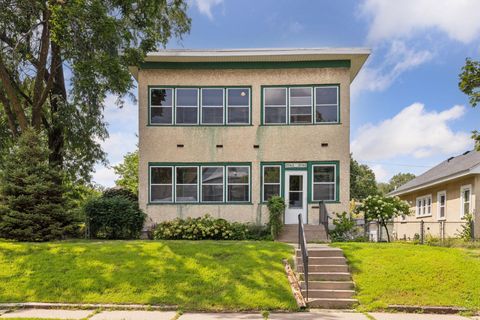
Best cash flowing properties in Minneapolis, MN
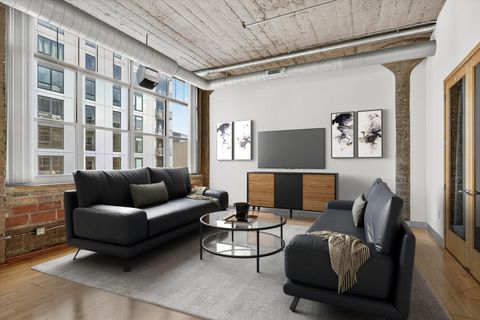
Active
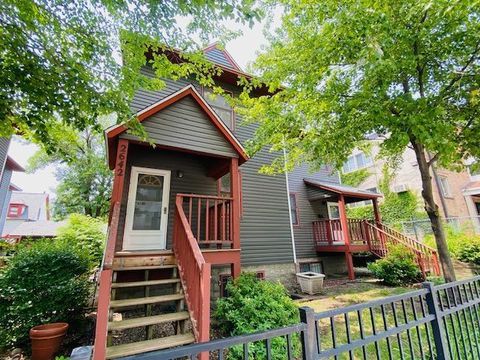
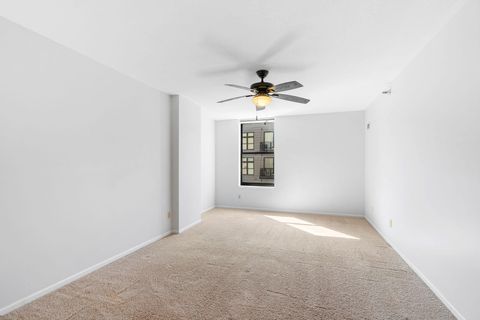
$130,000
1
bds
|
2
ba
|
1,884
sqft
|
built
1988
2642 1st Ave S, Minneapolis, MN 55408
$543
Cash flow
21.8%
Cash-on-Cash Return
10.7%
Cap rate
1.7%
Rent to Value Ratio
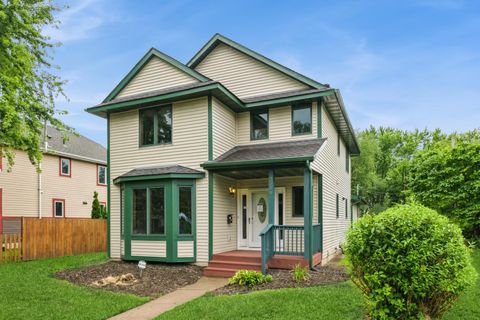
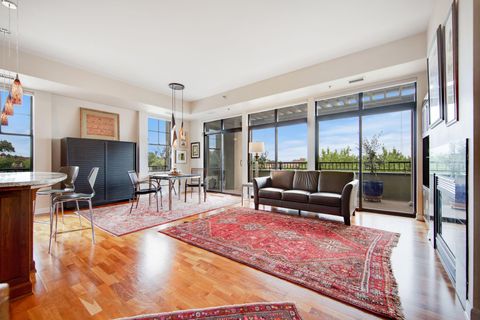
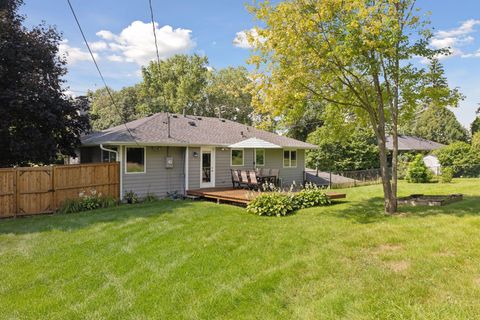
Active
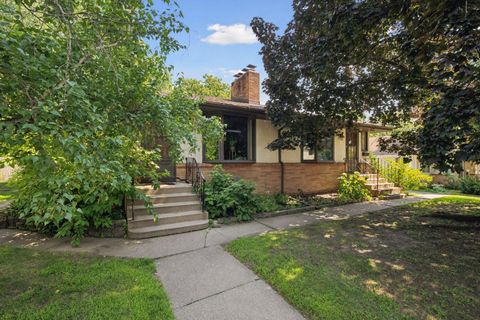
$289,900
5
bds
|
4
ba
|
2,319
sqft
|
built
1996
2921 Golden Valley Rd, Minneapolis, MN 55411
$159
Cash flow
2.9%
Cash-on-Cash Return
6.3%
Cap rate
1.0%
Rent to Value Ratio
550 out of 739 properties for sale in Minneapolis, MN
Limited Results Shown
Create a free account, or log in to reveal all property listings and enjoy the complete experience.
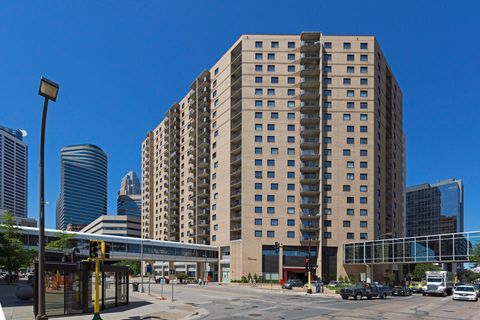
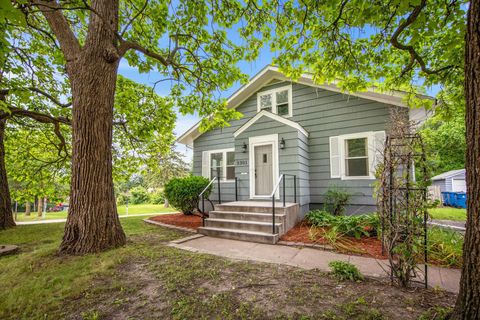
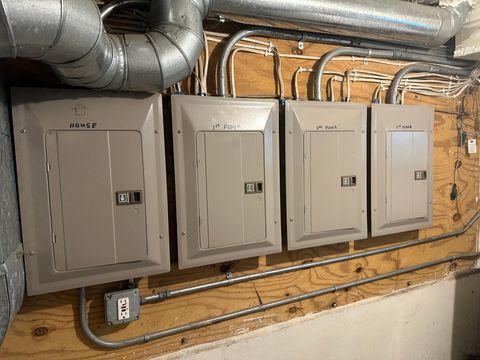
Active
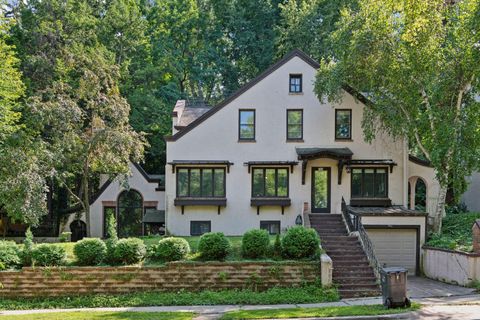
$283,900
2
bds
|
2
ba
|
1,197
sqft
|
built
1981
121 Washington Ave S, Minneapolis, MN 55401
$-1,022
Cash flow
-18.8%
Cash-on-Cash Return
1.4%
Cap rate
0.7%
Rent to Value Ratio
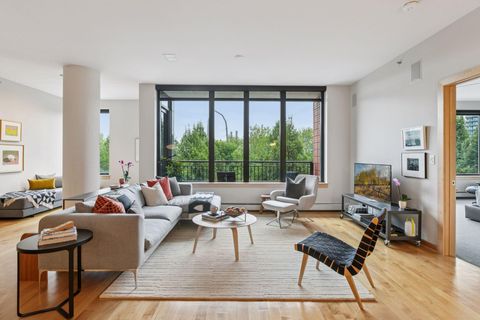
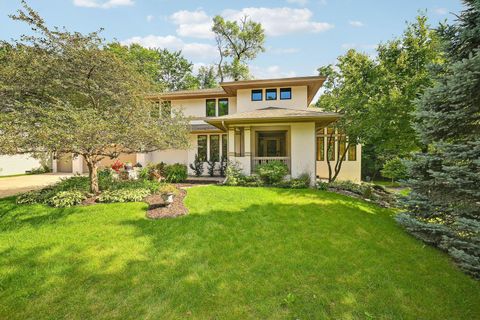
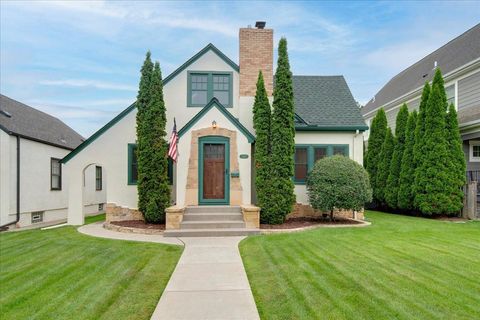
Active
$1,000,000
3
bds
|
3
ba
|
2,350
sqft
|
built
2006
215 10th Ave S, Minneapolis, MN 55415
$-4,947
Cash flow
-25.8%
Cash-on-Cash Return
-0.3%
Cap rate
0.4%
Rent to Value Ratio
Active
$259,900
2
bds
|
1
ba
|
1,352
sqft
|
built
1926
521 S 7th St, Minneapolis, MN 55415
$-1,017
Cash flow
-20.4%
Cash-on-Cash Return
1.0%
Cap rate
0.8%
Rent to Value Ratio
Active
$460,000
2
bds
|
2
ba
|
1,404
sqft
|
built
2006
317 Groveland Ave, Minneapolis, MN 55403
$-1,726
Cash flow
-19.6%
Cash-on-Cash Return
1.2%
Cap rate
0.6%
Rent to Value Ratio
Active
$239,900
3
bds
|
1
ba
|
1,513
sqft
|
built
1924
3301 Beard Ave N, Minneapolis, MN 55422
$-113
Cash flow
-2.5%
Cash-on-Cash Return
5.1%
Cap rate
0.8%
Rent to Value Ratio
Active
$900,000
5
bds
|
4
ba
|
4,322
sqft
|
built
1994
16035 36th Pl N, Minneapolis, MN 55446
$-2,496
Cash flow
-14.5%
Cash-on-Cash Return
2.4%
Cap rate
0.4%
Rent to Value Ratio
Active
$349,000
3
bds
|
2
ba
|
1,694
sqft
|
built
1956
5414 27th Ave S, Minneapolis, MN 55417
$-117
Cash flow
-1.7%
Cash-on-Cash Return
5.3%
Cap rate
0.8%
Rent to Value Ratio
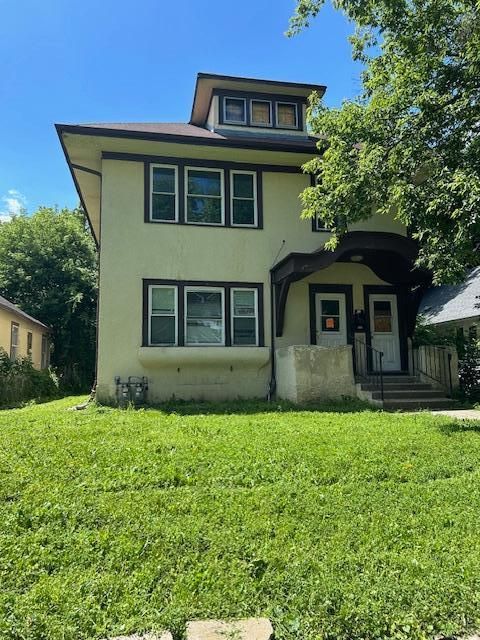
Active
$435,000
6
bds
|
2
ba
|
2,484
sqft
|
built
1900
823 20th Ave NE, Minneapolis, MN 55418
$-1,175
Cash flow
-14.1%
Cash-on-Cash Return
2.4%
Cap rate
0.5%
Rent to Value Ratio
Active
$359,900
3
bds
|
2
ba
|
1,463
sqft
|
built
1926
3822 Washburn Ave N, Minneapolis, MN 55412
$-411
Cash flow
-6.0%
Cash-on-Cash Return
4.3%
Cap rate
0.6%
Rent to Value Ratio
Active
$210,000
2
bds
|
2
ba
|
1,040
sqft
|
built
1965
19 S 1st St, Minneapolis, MN 55401
$-1,067
Cash flow
-26.5%
Cash-on-Cash Return
-0.4%
Cap rate
0.8%
Rent to Value Ratio
Active
$365,000
3
bds
|
1
ba
|
1,345
sqft
|
built
1950
2622 Idaho Ave S, Minneapolis, MN 55426
$-217
Cash flow
-3.1%
Cash-on-Cash Return
5.0%
Cap rate
0.7%
Rent to Value Ratio
Active
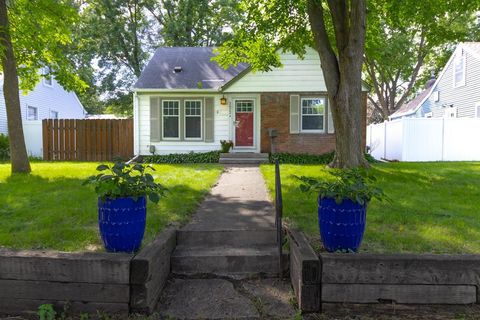
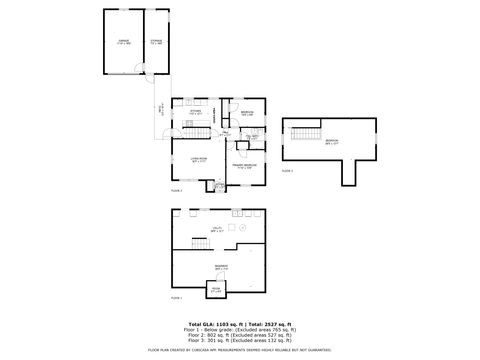
$290,000
3
bds
|
1
ba
|
1,103
sqft
|
built
1951
5243 Georgia Ave N, Minneapolis, MN 55428
$-265
Cash flow
-4.8%
Cash-on-Cash Return
4.6%
Cap rate
0.7%
Rent to Value Ratio
Active
$875,000
3
bds
|
3
ba
|
2,640
sqft
|
built
1948
2129 Kenwood Pkwy, Minneapolis, MN 55405
$-2,794
Cash flow
-16.7%
Cash-on-Cash Return
1.8%
Cap rate
0.4%
Rent to Value Ratio
Active
$330,000
3
bds
|
3
ba
|
1,935
sqft
|
built
2007
9538 Scott Cir N, Minneapolis, MN 55443
$-473
Cash flow
-7.5%
Cash-on-Cash Return
4.0%
Cap rate
0.8%
Rent to Value Ratio
Active
$1,240,000
4
bds
|
4
ba
|
4,285
sqft
|
built
1984
10810 Mississippi Blvd NW, Minneapolis, MN 55433
$-3,656
Cash flow
-15.4%
Cash-on-Cash Return
2.1%
Cap rate
0.4%
Rent to Value Ratio
Active
$699,000
3
bds
|
2
ba
|
2,344
sqft
|
built
1948
5241 Abbott Ave S, Minneapolis, MN 55410
$-1,575
Cash flow
-11.8%
Cash-on-Cash Return
3.0%
Cap rate
0.5%
Rent to Value Ratio
Active
$260,000
2
bds
|
1
ba
|
882
sqft
|
built
1953
3567 Pierce St NE, Minneapolis, MN 55418
$-75
Cash flow
-1.5%
Cash-on-Cash Return
5.3%
Cap rate
0.8%
Rent to Value Ratio
Active
$875,000
4
bds
|
3
ba
|
2,290
sqft
|
built
1915
4332 Xerxes Ave S, Minneapolis, MN 55410
$-3,405
Cash flow
-20.3%
Cash-on-Cash Return
1.0%
Cap rate
0.3%
Rent to Value Ratio
Active
$399,999
4
bds
|
2
ba
|
2,232
sqft
|
built
1913
3740 13th Ave S, Minneapolis, MN 55407
$-767
Cash flow
-10.0%
Cash-on-Cash Return
3.4%
Cap rate
0.6%
Rent to Value Ratio
Active
$450,000
3
bds
|
2
ba
|
1,909
sqft
|
built
1954
2610 Noble Ave N, Minneapolis, MN 55422
$-660
Cash flow
-7.7%
Cash-on-Cash Return
3.9%
Cap rate
0.6%
Rent to Value Ratio
Active
$495,000
7
bds
|
4
ba
|
2,775
sqft
|
built
1903
3033 Park Ave, Minneapolis, MN 55407
$-1,315
Cash flow
-13.9%
Cash-on-Cash Return
2.5%
Cap rate
0.5%
Rent to Value Ratio
Active
$850,000
4
bds
|
2
ba
|
2,649
sqft
|
built
1932
5105 Drew Ave S, Minneapolis, MN 55410
$-2,503
Cash flow
-15.4%
Cash-on-Cash Return
2.1%
Cap rate
0.4%
Rent to Value Ratio
Active
$325,000
2
bds
|
1
ba
|
1,143
sqft
|
built
1989
401 S 1st St, Minneapolis, MN 55401
$-752
Cash flow
-12.1%
Cash-on-Cash Return
2.9%
Cap rate
0.9%
Rent to Value Ratio
Active
$749,900
5
bds
|
3
ba
|
3,219
sqft
|
built
1960
4937 Sheridan Ave S, Minneapolis, MN 55410
$-2,907
Cash flow
-20.2%
Cash-on-Cash Return
1.0%
Cap rate
0.3%
Rent to Value Ratio
Active
$649,000
3
bds
|
4
ba
|
3,700
sqft
|
built
1919
741 Kenwood Pkwy, Minneapolis, MN 55403
$-1,221
Cash flow
-9.8%
Cash-on-Cash Return
3.4%
Cap rate
0.6%
Rent to Value Ratio
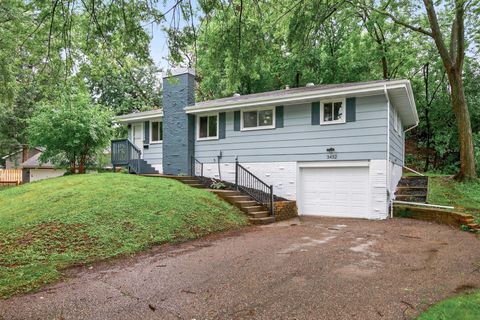
Active
$400,000
3
bds
|
2
ba
|
1,609
sqft
|
built
1964
3432 Yukon Ave S, Minneapolis, MN 55426
$-951
Cash flow
-12.4%
Cash-on-Cash Return
2.8%
Cap rate
0.5%
Rent to Value Ratio

Active
$275,000
3
bds
|
2
ba
|
1,125
sqft
|
built
1917
3835 Vincent Ave N, Minneapolis, MN 55412
$-89
Cash flow
-1.7%
Cash-on-Cash Return
5.3%
Cap rate
0.8%
Rent to Value Ratio

Active
$1,495,000
2
bds
|
3
ba
|
2,533
sqft
|
built
1927
510 Groveland Ave, Minneapolis, MN 55403
$-9,853
Cash flow
-34.4%
Cash-on-Cash Return
-2.2%
Cap rate
0.3%
Rent to Value Ratio
Active
$178,000
7
bds
|
2
ba
|
2,788
sqft
|
built
1924
905 Queen Ave N, Minneapolis, MN 55411
$78
Cash flow
2.3%
Cash-on-Cash Return
6.2%
Cap rate
1.1%
Rent to Value Ratio
Active
$475,000
3
bds
|
2
ba
|
1,914
sqft
|
built
1993
5501 Humboldt Cir, Minneapolis, MN 55419
$-1,228
Cash flow
-13.5%
Cash-on-Cash Return
2.6%
Cap rate
0.6%
Rent to Value Ratio

Active
$699,900
4
bds
|
3
ba
|
2,857
sqft
|
built
1941
1017 Thomas Ave S, Minneapolis, MN 55405
$-1,631
Cash flow
-12.2%
Cash-on-Cash Return
2.9%
Cap rate
0.6%
Rent to Value Ratio
Active
$299,900
2
bds
|
1
ba
|
933
sqft
|
built
1926
5641 Pillsbury Ave S, Minneapolis, MN 55419
$-324
Cash flow
-5.6%
Cash-on-Cash Return
4.4%
Cap rate
0.7%
Rent to Value Ratio
Active
$365,000
3
bds
|
2
ba
|
1,542
sqft
|
built
1953
4004 19th Ave S, Minneapolis, MN 55407
$-796
Cash flow
-11.4%
Cash-on-Cash Return
3.1%
Cap rate
0.5%
Rent to Value Ratio
Active
$249,900
5
bds
|
2
ba
|
1,514
sqft
|
built
1900
2504 Humboldt Ave N, Minneapolis, MN 55411
$-398
Cash flow
-8.3%
Cash-on-Cash Return
3.8%
Cap rate
0.6%
Rent to Value Ratio

Active
$395,000
3
bds
|
2
ba
|
2,199
sqft
|
built
1983
5146 Newton Ave N, Minneapolis, MN 55430
$-402
Cash flow
-5.3%
Cash-on-Cash Return
4.5%
Cap rate
0.7%
Rent to Value Ratio
Active
$359,900
3
bds
|
2
ba
|
1,616
sqft
|
built
1950
5921 Xerxes Ave S, Minneapolis, MN 55410
$-152
Cash flow
-2.2%
Cash-on-Cash Return
5.2%
Cap rate
0.8%
Rent to Value Ratio
Active
$329,900
4
bds
|
2
ba
|
1,500
sqft
|
built
1931
3530 Girard Ave N, Minneapolis, MN 55412
$-364
Cash flow
-5.8%
Cash-on-Cash Return
4.4%
Cap rate
0.6%
Rent to Value Ratio
Active
$249,900
3
bds
|
2
ba
|
1,840
sqft
|
built
1908
2924 Emerson Ave N, Minneapolis, MN 55411
$-237
Cash flow
-4.9%
Cash-on-Cash Return
4.5%
Cap rate
0.7%
Rent to Value Ratio