

$409,900
Investment Summary
- Monthly Cash Flow
- -$620
- Cap Rate
- 3.9%
- Cash-on-Cash Return
- -7.9%
- Debt Coverage Ratio
- 0.68
- Internal Rate of Return (5 years)
- -3.7%
Cash Flow
Net Operating Income (NOI) minus mortgage payments.
Calculation:
NOI - Mortgage Payments
Cap Rate (Market Value)
Capitalization Rate is a rate of return that compares the yearly Net Operating Income (NOI) to the market value.
Calculation:
NOI / Market Value
Cash-on-Cash Return (CoC)
Annual Cash Flow / Cash Invested
Calculation:
Annual cash flow divided by initial cash invested.
Debt Coverage Ratio (DCR)
Net Operating Income (NOI) divided by total debt payments.
Calculation:
NOI / Total Debt Payments
Internal Rate of Return (IRR)
A metric for assessing profitability over time. IRR is the discount rate at which the net present value (NPV) of all future cash flows (positive and negative) from an investment equals zero — including both periodic cash flow (such as rent) and a projected sale at the end of the holding period. It represents the expected annualized return, accounting for income, expenses, and the recovery of capital through a future sale.
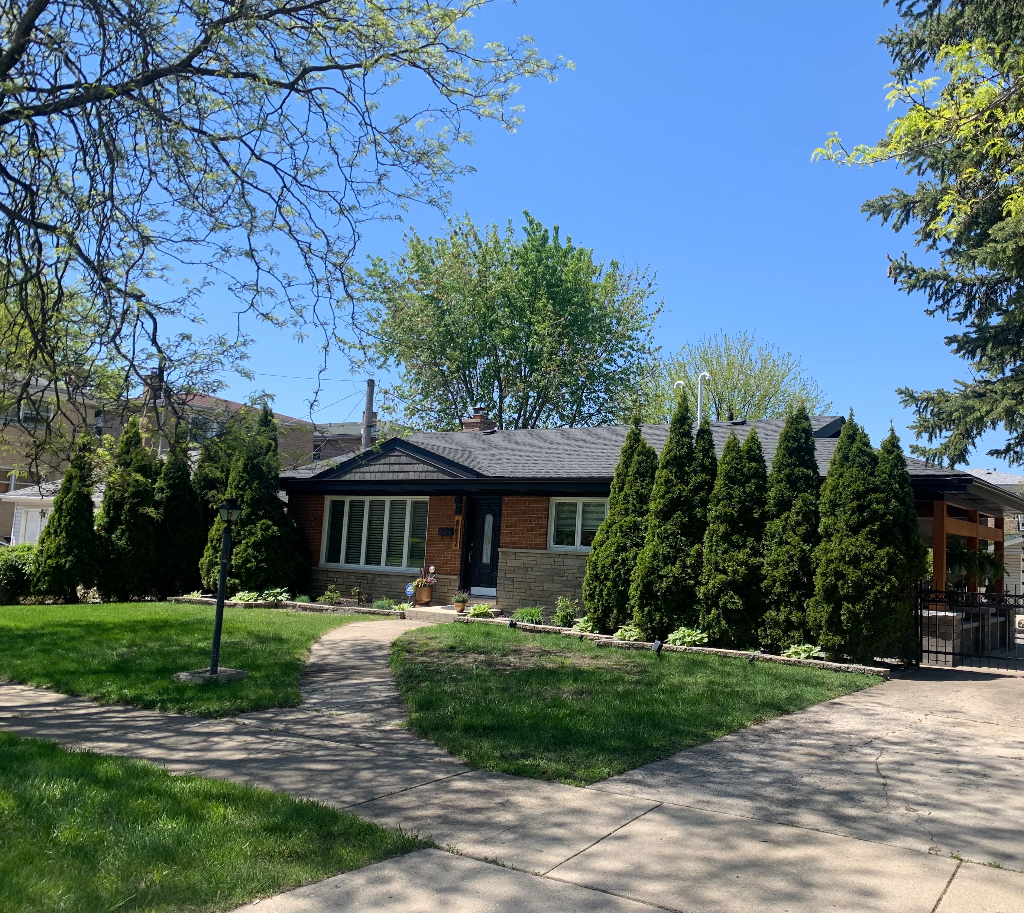
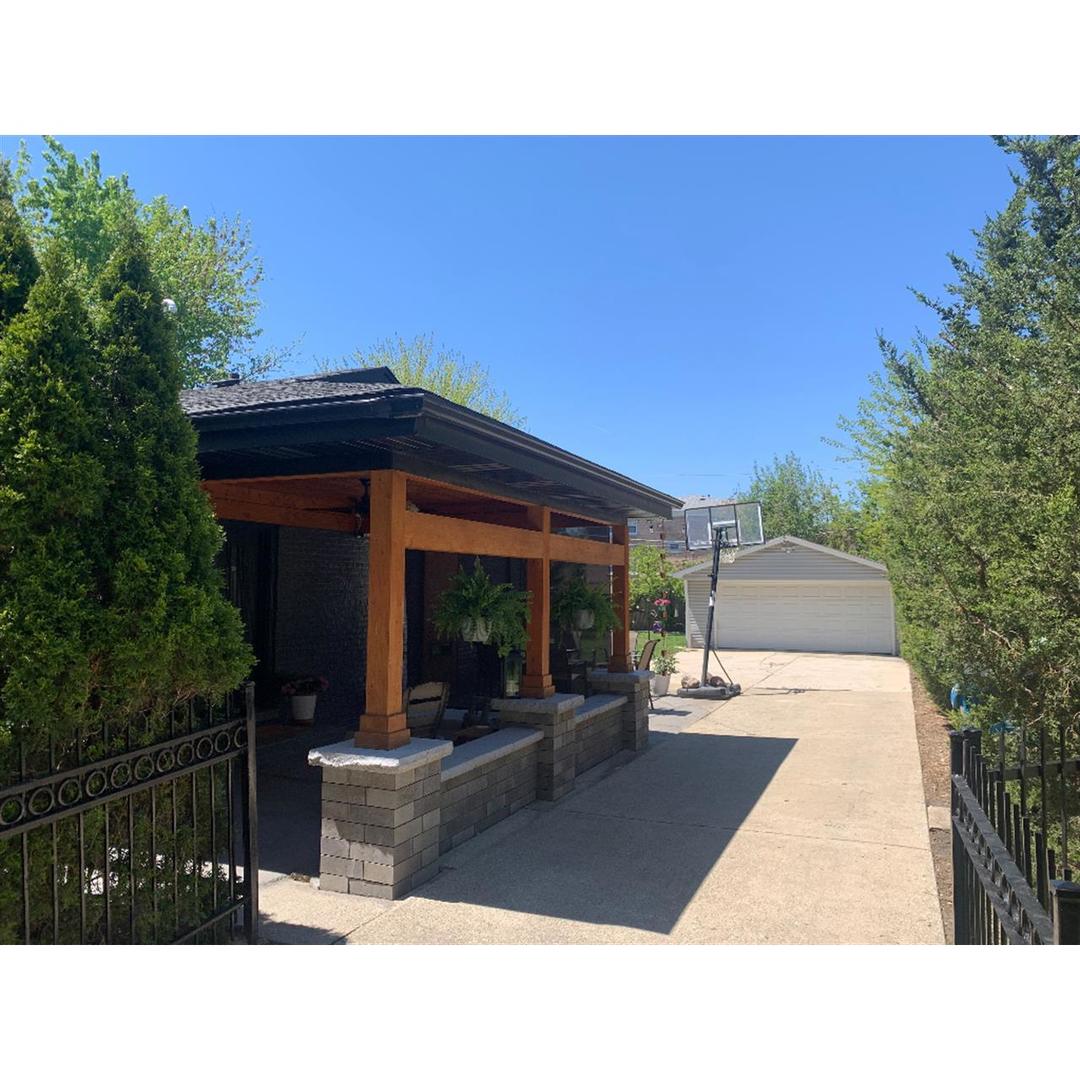
Property Description
Custom Kitchen Cabinets (2011), Newer Windows All Throughout (2012), Newer HVAC (Approx. 2016), New Siding (Approx. 2018), New Roof (Approx. 2019), New Patio (2022), Remodeled 2nd Level Bath (2023). Here You Have a Really Charming, Well-Kept, and RARE Split Level With SUB-Crawlspace On A HUGE Deep Lot In Burbank! Inside, This Home Is Designed for Entertaining Gatherings with an Open Concept Layout That Includes a Welcoming Living Room and Eat-In Kitchen. The Kitchen Features Deep and Oversized Custom-Built Cherry Wood Cabinetry That Includes a Cornered Glass Front Display and a Beautiful Built-In Wine Cabinet. Also features: a Custom Deep Walk-In Kitchen Pantry; Front Faced Privacy Windows; Custom Window Treatments; Original Hardwood Flooring; Recessed Lighting; and Custom Wood-Trim Throughout. The Upper-Level features 3 bedrooms, a full bath, and an attic for extra storage. The Inviting Lower Level Features a Gas Burning Fireplace, A Second Bath, Laundry Space, deep closet for storage, and Features a Walk-Out Patio With Doors That Open To The HUGE Yard And Entertaining Space. Outside, This Home Features a Long-Gated Driveway That Leads to The Detached 2.5 Car Garage, Providing Ample Space for Vehicles, Storage, and to Run and Play. If You Like to Host and Be Outdoors, You Will Appreciate This Inviting Newly Remodeled Outdoor Space Made of Stone and Cedar. Features New Landscaping Front and Back and Fully Matured Evergreen Trees for Added Privacy. Move-In Ready. Don't Miss the Opportunity To Own This Inviting Home In A Sought-After Area, Where Every Detail Is Designed For Comfortable and Chic Living, and Much Much More! Close Proximity To I-294, I-55, 95th Street, 87th Street, Harlem, Oak Lawn Pavilion, Starbucks, and MORE!
Build Your Team
Quickly find investor-friendly professionals who can help you succeed in real estate investing at any stage of the investing journey.


Agents
Match with investor-friendly agents who can help you find, analyze, and close your next deal


Lenders
Get the best funding…find investor-friendly lenders who specialize in your deal strategy


Property Managers
Transition to passive investing. Find a trusted property management partnership that lasts.


Tax Pros & Accountants
Taxes and financial reporting made easy—find experts to create tax savings strategies, file taxes, and more
Location
Property Details
Parking
- Description: Detached Garage
- Details: Concrete, Garage Door Opener, On Site, Detached, Garage
- Garage Spaces: 2
- Spaces Total: 2
Bedroom Information
- # of Bedrooms: 3
Bathroom Information
- # of Baths (Full): 2
- # of Baths (Partial): 1
- # of Baths (Total): 2.0
Interior Features
- # of Rooms: 5
- Attic: Yes
- Basement: Yes
- Basement Description: Unfinished, Walk-Out Access
- Fireplace: Yes
Exterior Features
- Exterior Walls Materials: Masonry
- Foundation: Block
Land Information
- Land Use: Residential
- Land Use Subtype: Single Family Residential
Lot Information
- Parcel ID: 1931321008
- Lot Size: 0 sqft
Property Information
- Property Type: Single Family Residence
- Year Built: 1962
Tax Information
- Annual Tax: $7,349
Utilities
- Water & Sewer: Public
- Heating: Natural Gas
- Cooling: Central Air
Location
- County: Cook
Listing Details
Investment Summary
- Monthly Cash Flow
- -$620
- Cap Rate
- 3.9%
- Cash-on-Cash Return
- -7.9%
- Debt Coverage Ratio
- 0.68
- Internal Rate of Return (5 years)
- -3.7%
Cash Flow
Net Operating Income (NOI) minus mortgage payments.
Calculation:
NOI - Mortgage Payments
Cap Rate (Market Value)
Capitalization Rate is a rate of return that compares the yearly Net Operating Income (NOI) to the market value.
Calculation:
NOI / Market Value
Cash-on-Cash Return (CoC)
Annual Cash Flow / Cash Invested
Calculation:
Annual cash flow divided by initial cash invested.
Debt Coverage Ratio (DCR)
Net Operating Income (NOI) divided by total debt payments.
Calculation:
NOI / Total Debt Payments
Internal Rate of Return (IRR)
A metric for assessing profitability over time. IRR is the discount rate at which the net present value (NPV) of all future cash flows (positive and negative) from an investment equals zero — including both periodic cash flow (such as rent) and a projected sale at the end of the holding period. It represents the expected annualized return, accounting for income, expenses, and the recovery of capital through a future sale.
Purchase Details
Purchase PriceThe price paid for the property. Purchase price:
| $409,900 |
|---|---|
Amount FinancedThe amount of the purchase financed through a loan. Amount financed:
| -$327,920 |
Down paymentThe initial payment made towards the purchase. Down payment:
| $81,980 |
Closing CostsFees and expenses associated with purchasing a property, typically ranging from 2% to 5% of the home’s purchase price, paid at the end of a home purchase to cover services like lending, title transfer, and taxes. Closing costs:
| $12,297 |
Rehab CostsCosts incurred to repair or improve the property, including: roof, flooring, exterior siding, kitchen, exterior paint, bathrooms, etc. Rehab costs:
| $0 |
Initial Cash InvestedThe total initial cash invested in the property. Calculation:Down payment + Buying costs + Rehab costs Initial cash invested:
| $94,277 |
Square Feet (SQFT)The total square footage of the property. Square feet:
| 1,515 |
Cost Per Square FootCost per square foot of the property. Calculation:Purchase Price / Square Feet Cost per square foot:
| $271 |
Monthly Rent Per Square FootMonthly rent divided by the number of square feet. This ratio helps investors compare rental income efficiency across properties, markets, and unit sizes Calculation:Monthly Rent / Square Feet Monthly rent per square foot:
| $1.85 |
Financing Details
Loan AmountThe total sum of money borrowed from a lender to finance a property purchase. Calculation:Purchase Price - Down Payment
Loan amount:
| $327,920 |
|---|---|
Loan to Value Ratio (LTV)Loan amount divided by the market value of the property. Calculation:Loan Amount / Market Value
Loan to value ratio:
| 80.0% |
Loan TypeThe type of loan (e.g., fixed, adjustable).
Loan type:
| Amortizing |
TermThe loan repayment period in years.
Term:
| 30 years |
Interest RateThe percentage a lender charges on the borrowed amount of a loan, determining the cost of borrowing money.
Interest rate:
| 5.875% |
Principal & Interest (PI)The principal is the portion of the loan payment that reduces the loan balance. The interest is the lender's charge for borrowing money. Calculation:(P * r * (1 + r) ** n) / ((1 + r) ** n - 1) Where:
P = Loan amount (principal)
Principal & interest:
| $1,940 |
Property TaxesAnnual taxes levied by local governments on real estate properties. These taxes fund public services like schools, roads, and emergency services.
Property tax:
| $612 |
InsuranceThe costs for insurance coverage to protect against financial losses due to risks like fire, natural disasters, theft, liability, or tenant-related damages. Calculation:Assumes 7% of gross rental income, unless insurance rates are specified.
Insurance:
| $196 |
Private Mortgage Insurance (PMI)A fee that borrowers pay when they take out a conventional loan with a loan-to-value (LTV) ratio above 80%.
Private mortgage insurance (PMI):
| $0 |
Monthly PaymentThe fixed amount a borrower pays each month to repay a loan. It typically includes principal and interest (P&I) and may also cover property taxes, insurance, HOA fees, and PMI if escrowed. Monthly payment:
| $2,748 |
Operating Income
| % Rent | Monthly | Yearly | |
|---|---|---|---|
Gross RentThe total rental income received from tenants before deducting any expenses. Includes base rent, late fees, pet fees, parking fees, and other recurring charges.
Gross rent:
| $2,800 | $33,600 | |
Vacancy LossExpected loss of rent due to vacancies.
Vacancy loss:
(6%)
| 6% | -$168 | -$2,016 |
Operating IncomeGross rental income minus vacancy loss. Calculation:Gross rent - Vacancy loss
Operating income:
| $2,632 | $31,584 |
Operating Expenses
| % Rent | Monthly | Yearly | |
|---|---|---|---|
Property TaxesAnnual taxes levied by local governments on real estate properties. These taxes fund public services like schools, roads, and emergency services. | 22% | -$612 | -$7,349 |
InsuranceThe costs for insurance coverage to protect against financial losses due to risks like fire, natural disasters, theft, liability, or tenant-related damages. Calculation:Assumes 7% of gross rental income, unless insurance rates are specified. | 7% | -$196 | -$2,352 |
Property ManagementThe costs associated with hiring a property manager to handle the day-to-day operations of a rental property. Includes management fees, leasing fes, eviction fees, etc. Calculation:Assumes 8% of gross rental income. | 8% | -$224 | -$2,688 |
Repairs & MaintenanceOngoing costs for routine upkeep and minor fixes needed to keep a property in good working condition. Calculation:Assumes 5% of gross rental income. Varies by property age and condition. | 5% | -$140 | -$1,680 |
Capital ExpensesLarge, infrequent costs for major improvements or replacements, like a new roof, HVAC system, or appliances. Calculation:Assumes 5% of gross rental income. Varies by property age. | 5% | -$140 | -$1,680 |
HOA FeesRegular dues paid to a Homeowners Association for community maintenance, amenities, and management. Similar fees include: Condo Association Fees, Co-op Maintenance Fees, etc. | n/a | n/a | n/a |
Operating ExpensesRecurring costs required to maintain and manage a rental property, including property taxes, insurance, maintenance, repairs, utilities (if paid by the owner), property management fees, and other day-to-day expenses. Calculation:Insurance + Property Taxes + Property Management + Repairs & Maintenance + Capital Expenditures + HOA Fees | 47% | -$1,312 | -$15,749 |
Cash Flow
| Monthly | Yearly | |
|---|---|---|
Net Operating Income (NOI)The income generated from a property after deducting all operating expenses but before deducting mortgage payments, taxes, and capital expenditures. Calculation:Gross Operating Income - Operating Expenses
Net operating income:
| $1,320 | $15,840 |
Mortgage PaymentThe fixed amount a borrower pays each month to repay a loan. It typically includes principal and interest (P&I) and may also cover property taxes, insurance, HOA fees, and PMI if escrowed. | -$1,940 | -$23,280 |
Cash FlowNet Operating Income (NOI) minus mortgage payments. Calculation:NOI - Mortgage Payments | $620 | $7,440 |