


Updated 13 days ago on . Most recent reply

September Las Vegas Rental Market Update
It's September, and it's time for another Las Vegas rental market update. For a more comprehensive look at the Las Vegas investment market, please DM me for a link to our blog. There, you'll find detailed information on investing, both in general and specifically in Las Vegas.
Before I continue, note that unless otherwise stated, the charts only include properties that match the following profile.
- Type: Single-family
- Configuration: 1,000 SF to 3,000 SF, 2+ bedrooms, 2+ baths, 2+ garages, minimum lot size is 3,000 SF.
- Price range: $320,000 to $475,000
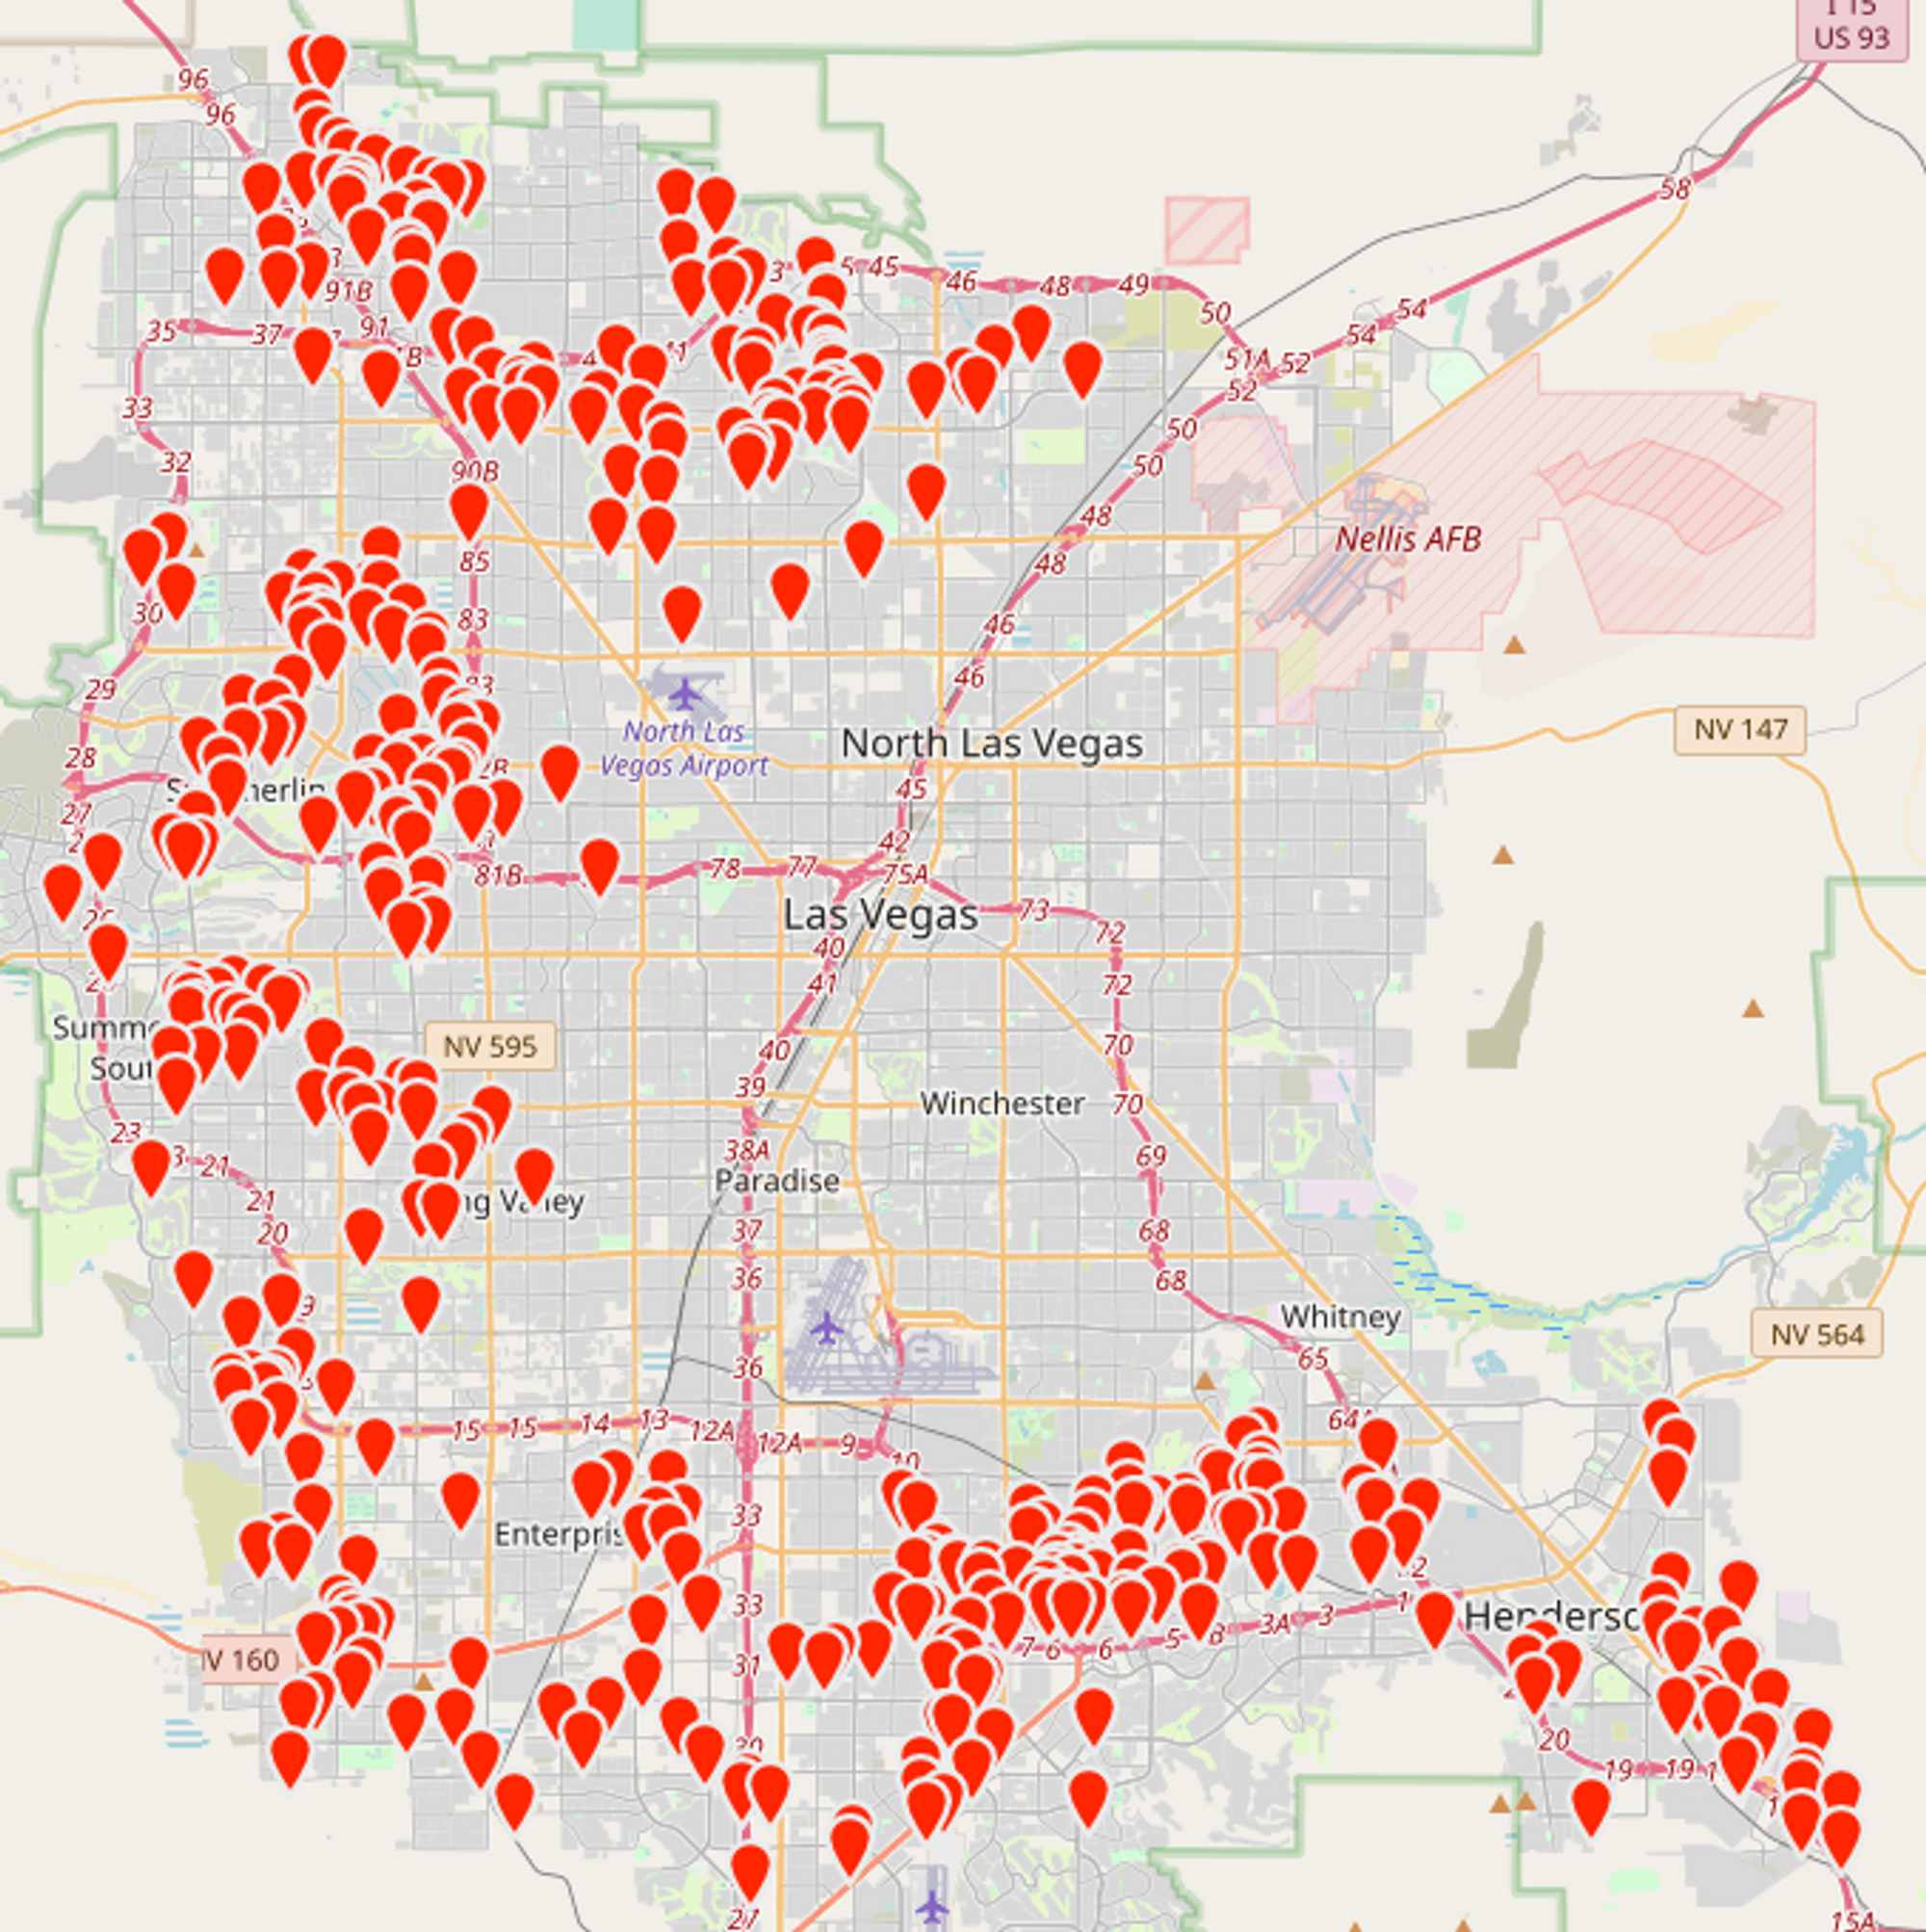
- Location: See the map below
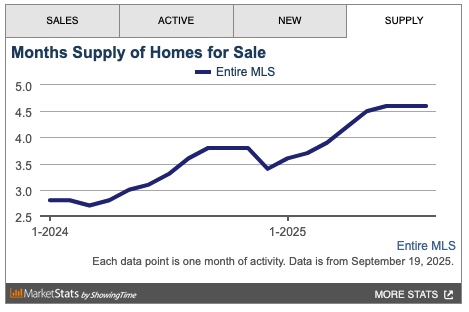
Overall Market Inventory
The chart below, from the MLS, includes ALL property types and price ranges. The overall inventory has stabilized.
Rental Market Trends
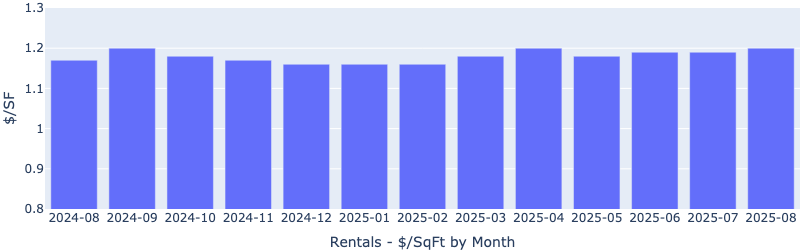
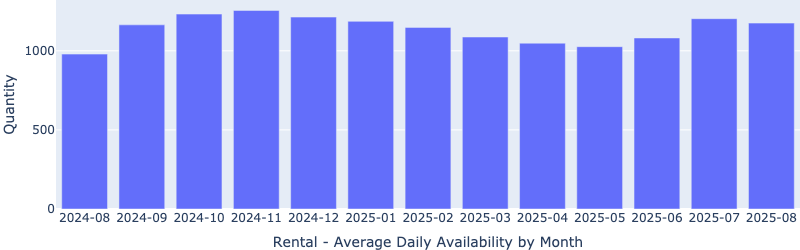
The charts below are only relevant to the property profile that we target.
Rentals - Median $/SF by Month
Rents increased slightly in August. YoY is up 3%. Despite global and domestic tensions, rents remained stable.
Rentals - Availability by Month
The number of homes for rent decreased slightly MoM in August, bucking the usual seasonal trend.
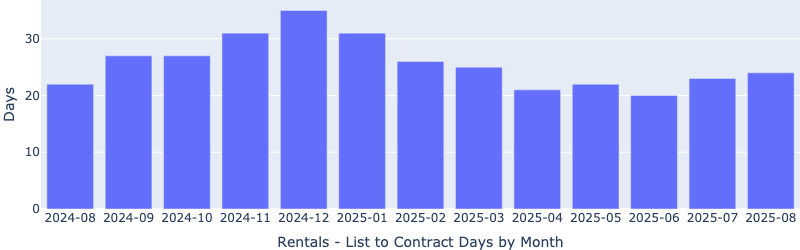
Rentals - Median Time to Rent
Time to rent increased marginally MoM (from 23 days to 24 days), but remained healthy.
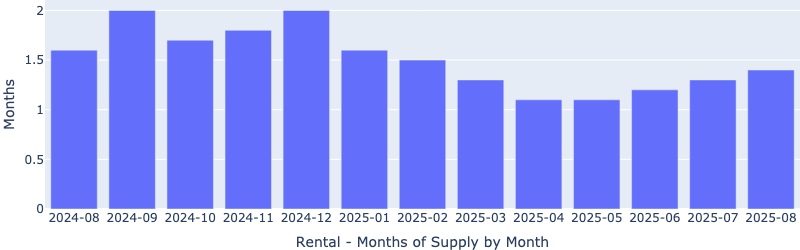
Rentals - Months of Supply
There are only 1.4 months of supply for our target rental property profile. This low inventory will continue to pressure up rents.
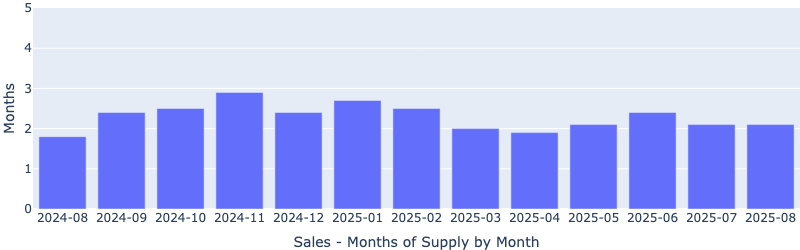
Sales - Months of Supply
Inventory remains at two months, indicating our segment is still a seller's market.
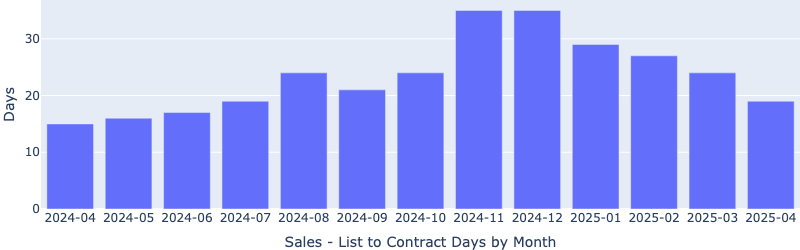
Sales - Median $/SF by Month
The price per square foot unexpectedly fell in August. While we typically see a slight slowdown when school begins mid-month, this drop was larger than normal. Since the time to sell actually decreased (see chart below) and the inventory (months of supply) remained stable, my guess is that all the negative news and global uncertainty pushed some sellers to cut prices.
I also looked into distressed single-family home sales, and there’s no sign of trouble. The numbers are very low:
- Short sales: 38, about 0.0084% of all single-family homes
- Bank owned (REO): 37, about 0.0082%
- Foreclosures started: 33, about 0.0073%
Why invest in Las Vegas?
The goal is to achieve and maintain financial freedom. Financial freedom means more than just matching your current income—it's about sustaining your lifestyle permanently. To accomplish this, you need income growth that exceeds inflation. Without this growth, you won't be able to keep up with the rising costs of goods and services.
What causes rents (and prices) to increase?
Supply & Demand
Unlike financial markets, real estate prices and rents are driven by supply and demand. What is the supply and demand situation in Las Vegas?
Supply
Las Vegas is unique because it is a tiny island of privately owned land in an ocean of federal land. See the 2022 aerial view below.
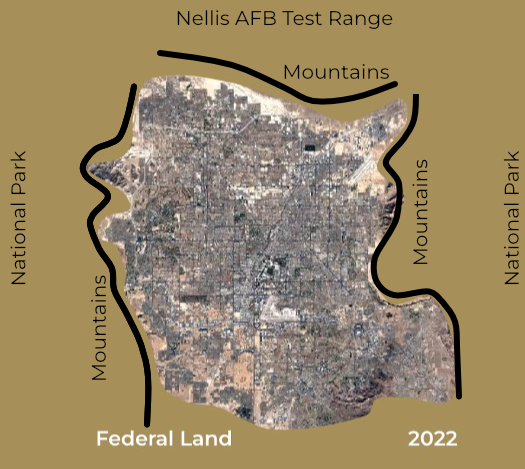
Very little undeveloped private land is left in the Las Vegas Valley, and desirable areas cost more than $1 million per acre. Consequently, new homes in these locations start at $550,000. Homes that appeal to our target tenant segment range from $350,000 to $475,000, so the supply of housing we target remains almost the same regardless of how many new homes are built.
Demand
Population growth drives housing demand. Las Vegas's average annual population growth is between 2% and 3%. What draws people to Las Vegas? Jobs. Depending on the report, there is between $26B and $30B under construction, and the last job fair had over 20,000 open jobs.
In Conclusion
While nothing is guaranteed, the combination of population growth and limited land for expansion virtually assures that prices and rents will continue to increase.
Thanks for reading my post. Reach out if you have questions or would like to discuss investing in Las Vegas.
- Eric Fernwood
- [email protected]
- 702-358-8884
