$3,995,000
Investment Summary
- Monthly Cash Flow
- -$15,679
- Cap Rate
- 1.4%
- Cash-on-Cash Return
- -20.5%
- Debt Coverage Ratio
- 0.23
- Internal Rate of Return (5 years)
- -15.8%
Cash Flow
Net Operating Income (NOI) minus mortgage payments.
Calculation:
NOI - Mortgage Payments
Cap Rate (Market Value)
Capitalization Rate is a rate of return that compares the yearly Net Operating Income (NOI) to the market value.
Calculation:
NOI / Market Value
Cash-on-Cash Return (CoC)
Annual Cash Flow / Cash Invested
Calculation:
Annual cash flow divided by initial cash invested.
Debt Coverage Ratio (DCR)
Net Operating Income (NOI) divided by total debt payments.
Calculation:
NOI / Total Debt Payments
Internal Rate of Return (IRR)
A metric for assessing profitability over time. IRR is the discount rate at which the net present value (NPV) of all future cash flows (positive and negative) from an investment equals zero — including both periodic cash flow (such as rent) and a projected sale at the end of the holding period. It represents the expected annualized return, accounting for income, expenses, and the recovery of capital through a future sale.
Property Description
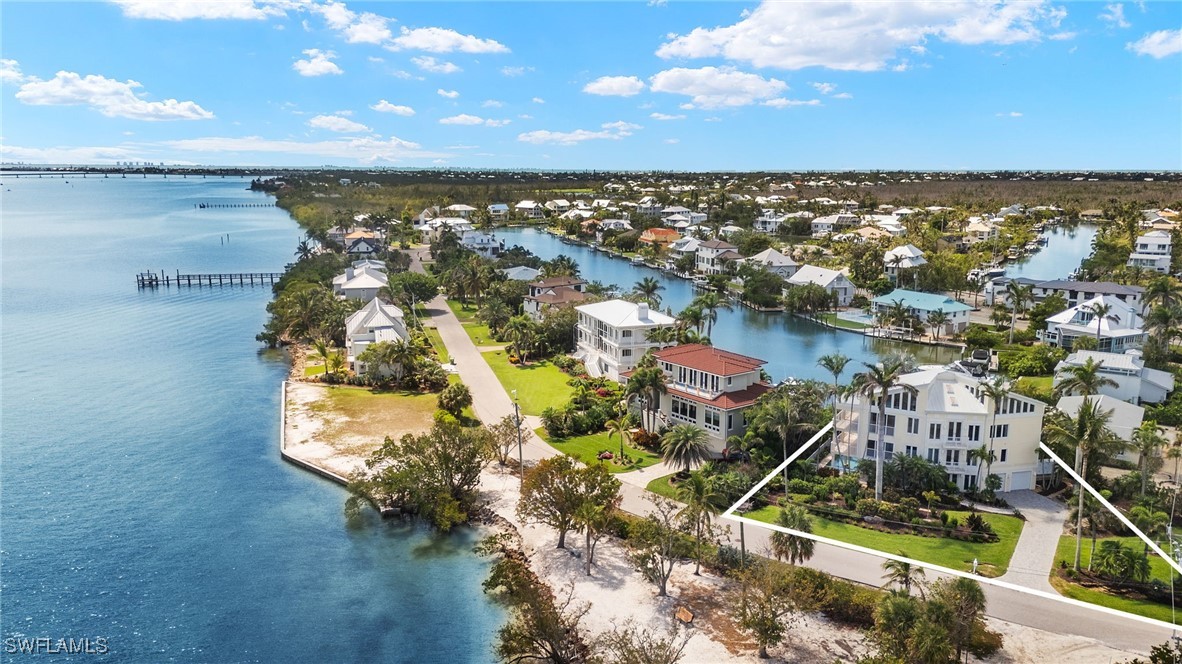
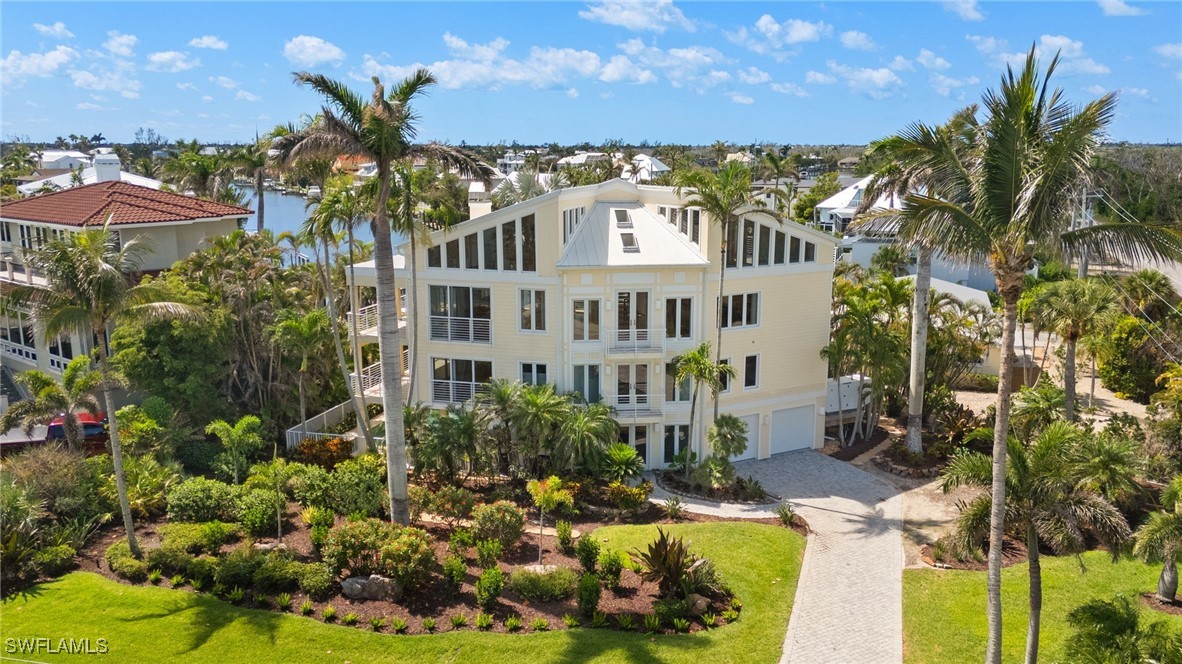
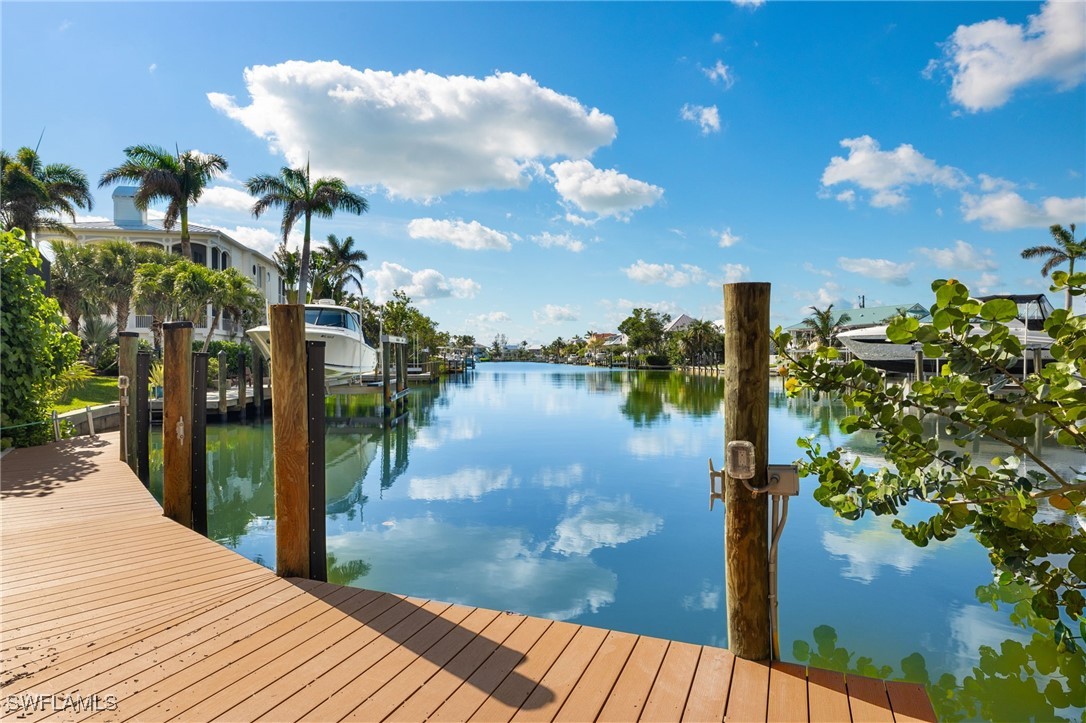
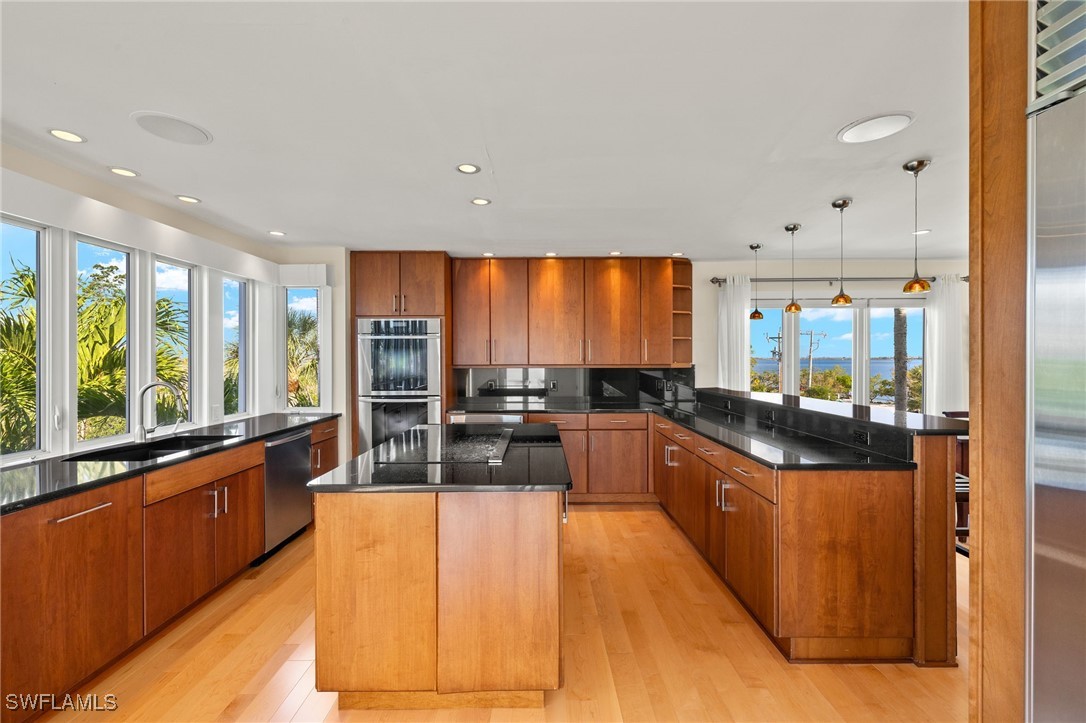
Luxury coastal living redefined – a waterfront sanctuary on Sanibel Island. Where the wide bay meets the deep canal, this extraordinary residence delivers a lifestyle that feels more like living aboard a private yacht than a traditional home. Surrounded by water at front and back, with sweeping views of the bay to one side and one of Sanibel’s widest, deepest sailboat-access canals to the other, this home offers an unrivaled island experience. A lush expanse of protected mangrove tidal marshland wraps the property, ensuring privacy and a sense of coastal seclusion. A boater’s dream. A designer’s vision. Positioned on a direct-access canal with no bridges—ideal for sailboats and large vessels—this property sits in one of the desirable locations for serious boaters. Designed with a reverse floor plan to elevate your views where they matter most, every space feels intentional and luxurious. High above it all, two-story ceilings with clerestory windows flood the interiors with light, while wraparound lanais and expansive outdoor decks on every level invite you to watch dolphins cruise the canal or pelicans dive into the bay. ultimate entertaining meets yacht-inspired sophistication. The kitchen is a showpiece—crafted for entertaining and inspired by luxury marine design. Custom teak-front cabinetry, created by a designer for Tiara Yachts, sets the tone. Sub-Zero refrigeration, freezer and wine towers, dual Miele wall ovens and warming drawer, wet bar with wine refrigerator and standalone ice maker mean you’re fully equipped for any gathering, from sunset cocktails to seafood feasts. In the main living area, a sleek gas fireplace adds ambiance, featuring a motorized enclosure to discreetly hide the TV when not in use. Smart home features include a Lutron lighting system and Hunter Douglas automated window treatments throughout. A primary suite like no other. The owner’s suite is a masterstroke of design, channeling the elegance of a multimillion-dollar yacht. An oversized double vanity is constructed using flawless granite slabs that also form the raised platform beneath the two-person Jacuzzi tub. A walk-through dressing area with bespoke teak cabinetry by the same Tiara yacht designer, balances form and function with nautical precision. Seamless indoor-outdoor living on the east side of the home, a semi-covered pool provides a spot to unwind after a day on the water—whether basking in the sun or relaxing in the shade. And with a 47-kilowatt whole-home generator powered by a buried 1,000-gallon propane tank, peace of mind comes built in. This is not just a home—it’s a coastal escape engineered for those who demand excellence, adventure and tranquility in equal measure. Sanibel waterfront living at its peak. Welcome aboard.
Build Your Team
Quickly find investor-friendly professionals who can help you succeed in real estate investing at any stage of the investing journey.


Agents
Match with investor-friendly agents who can help you find, analyze, and close your next deal


Lenders
Get the best funding…find investor-friendly lenders who specialize in your deal strategy


Property Managers
Transition to passive investing. Find a trusted property management partnership that lasts.


Tax Pros & Accountants
Taxes and financial reporting made easy—find experts to create tax savings strategies, file taxes, and more
Location
Property Details
Parking
- Description: Mixed
- Details: Attached, Garage
- Garage Spaces: 2
- Spaces Total: 0
Bedroom Information
- # of Bedrooms: 4
Bathroom Information
- # of Baths (Full): 3
- # of Baths (Total): 4.0
Interior Features
- # of Stories: 2
- Fireplace: Yes
Exterior Features
- Foundation: Raised
- Roof Type: IRR/Cathedral
- Roof Material: Metal
- Pool: Yes
HOA
- Has HOA: Yes
- Additional HOA Fee: $75/annually
Land Information
- Land Use: Residential
- Land Use Subtype: Single Family Residential
Lot Information
- Parcel ID: 184623T40060A.0310
- Lot Size: 0 sqft
Property Information
- Property Type: Single Family Residence
- Style: Two Story, See Remarks
- Year Built: 1988
Tax Information
- Annual Tax: $17,032
Utilities
- Water & Sewer: Public
- Heating: Central, Electric
- Cooling: Central Air, Ceiling Fan(s), Electric, Zoned
Location
- County: Lee
Listing Details
Investment Summary
- Monthly Cash Flow
- -$15,679
- Cap Rate
- 1.4%
- Cash-on-Cash Return
- -20.5%
- Debt Coverage Ratio
- 0.23
- Internal Rate of Return (5 years)
- -15.8%
Cash Flow
Net Operating Income (NOI) minus mortgage payments.
Calculation:
NOI - Mortgage Payments
Cap Rate (Market Value)
Capitalization Rate is a rate of return that compares the yearly Net Operating Income (NOI) to the market value.
Calculation:
NOI / Market Value
Cash-on-Cash Return (CoC)
Annual Cash Flow / Cash Invested
Calculation:
Annual cash flow divided by initial cash invested.
Debt Coverage Ratio (DCR)
Net Operating Income (NOI) divided by total debt payments.
Calculation:
NOI / Total Debt Payments
Internal Rate of Return (IRR)
A metric for assessing profitability over time. IRR is the discount rate at which the net present value (NPV) of all future cash flows (positive and negative) from an investment equals zero — including both periodic cash flow (such as rent) and a projected sale at the end of the holding period. It represents the expected annualized return, accounting for income, expenses, and the recovery of capital through a future sale.
Purchase Details
Purchase PriceThe price paid for the property. Purchase price:
| $3,995,000 |
|---|---|
Amount FinancedThe amount of the purchase financed through a loan. Amount financed:
| -$3,196,000 |
Down paymentThe initial payment made towards the purchase. Down payment:
| $799,000 |
Closing CostsFees and expenses associated with purchasing a property, typically ranging from 2% to 5% of the home’s purchase price, paid at the end of a home purchase to cover services like lending, title transfer, and taxes. Closing costs:
| $119,850 |
Rehab CostsCosts incurred to repair or improve the property, including: roof, flooring, exterior siding, kitchen, exterior paint, bathrooms, etc. Rehab costs:
| $0 |
Initial Cash InvestedThe total initial cash invested in the property. Calculation:Down payment + Buying costs + Rehab costs Initial cash invested:
| $918,850 |
Square Feet (SQFT)The total square footage of the property. Square feet:
| 3,976 |
Cost Per Square FootCost per square foot of the property. Calculation:Purchase Price / Square Feet Cost per square foot:
| $1,005 |
Monthly Rent Per Square FootMonthly rent divided by the number of square feet. This ratio helps investors compare rental income efficiency across properties, markets, and unit sizes Calculation:Monthly Rent / Square Feet Monthly rent per square foot:
| $2.26 |
Financing Details
Loan AmountThe total sum of money borrowed from a lender to finance a property purchase. Calculation:Purchase Price - Down Payment
Loan amount:
| $3,196,000 |
|---|---|
Loan to Value Ratio (LTV)Loan amount divided by the market value of the property. Calculation:Loan Amount / Market Value
Loan to value ratio:
| 80.0% |
Loan TypeThe type of loan (e.g., fixed, adjustable).
Loan type:
| Amortizing |
TermThe loan repayment period in years.
Term:
| 30 years |
Interest RateThe percentage a lender charges on the borrowed amount of a loan, determining the cost of borrowing money.
Interest rate:
| 6.625% |
Principal & Interest (PI)The principal is the portion of the loan payment that reduces the loan balance. The interest is the lender's charge for borrowing money. Calculation:(P * r * (1 + r) ** n) / ((1 + r) ** n - 1) Where:
P = Loan amount (principal)
Principal & interest:
| $20,464 |
Property TaxesAnnual taxes levied by local governments on real estate properties. These taxes fund public services like schools, roads, and emergency services.
Property tax:
| $1,419 |
InsuranceThe costs for insurance coverage to protect against financial losses due to risks like fire, natural disasters, theft, liability, or tenant-related damages. Calculation:Assumes 7% of gross rental income, unless insurance rates are specified.
Insurance:
| $630 |
Private Mortgage Insurance (PMI)A fee that borrowers pay when they take out a conventional loan with a loan-to-value (LTV) ratio above 80%.
Private mortgage insurance (PMI):
| $0 |
Monthly PaymentThe fixed amount a borrower pays each month to repay a loan. It typically includes principal and interest (P&I) and may also cover property taxes, insurance, HOA fees, and PMI if escrowed. Monthly payment:
| $22,513 |
Operating Income
| % Rent | Monthly | Yearly | |
|---|---|---|---|
Gross RentThe total rental income received from tenants before deducting any expenses. Includes base rent, late fees, pet fees, parking fees, and other recurring charges.
Gross rent:
| $9,000 | $108,000 | |
Vacancy LossExpected loss of rent due to vacancies.
Vacancy loss:
(6%)
| 6% | -$540 | -$6,480 |
Operating IncomeGross rental income minus vacancy loss. Calculation:Gross rent - Vacancy loss
Operating income:
| $8,460 | $101,520 |
Operating Expenses
| % Rent | Monthly | Yearly | |
|---|---|---|---|
Property TaxesAnnual taxes levied by local governments on real estate properties. These taxes fund public services like schools, roads, and emergency services. | 16% | -$1,419 | -$17,033 |
InsuranceThe costs for insurance coverage to protect against financial losses due to risks like fire, natural disasters, theft, liability, or tenant-related damages. Calculation:Assumes 7% of gross rental income, unless insurance rates are specified. | 7% | -$630 | -$7,560 |
Property ManagementThe costs associated with hiring a property manager to handle the day-to-day operations of a rental property. Includes management fees, leasing fes, eviction fees, etc. Calculation:Assumes 8% of gross rental income. | 8% | -$720 | -$8,640 |
Repairs & MaintenanceOngoing costs for routine upkeep and minor fixes needed to keep a property in good working condition. Calculation:Assumes 5% of gross rental income. Varies by property age and condition. | 5% | -$450 | -$5,400 |
Capital ExpensesLarge, infrequent costs for major improvements or replacements, like a new roof, HVAC system, or appliances. Calculation:Assumes 5% of gross rental income. Varies by property age. | 5% | -$450 | -$5,400 |
HOA FeesRegular dues paid to a Homeowners Association for community maintenance, amenities, and management. Similar fees include: Condo Association Fees, Co-op Maintenance Fees, etc. | 0% | -$6 | -$72 |
Operating ExpensesRecurring costs required to maintain and manage a rental property, including property taxes, insurance, maintenance, repairs, utilities (if paid by the owner), property management fees, and other day-to-day expenses. Calculation:Insurance + Property Taxes + Property Management + Repairs & Maintenance + Capital Expenditures + HOA Fees | 41% | -$3,675 | -$44,105 |
Cash Flow
| Monthly | Yearly | |
|---|---|---|
Net Operating Income (NOI)The income generated from a property after deducting all operating expenses but before deducting mortgage payments, taxes, and capital expenditures. Calculation:Gross Operating Income - Operating Expenses
Net operating income:
| $4,785 | $57,420 |
Mortgage PaymentThe fixed amount a borrower pays each month to repay a loan. It typically includes principal and interest (P&I) and may also cover property taxes, insurance, HOA fees, and PMI if escrowed. | -$20,464 | -$245,568 |
Cash FlowNet Operating Income (NOI) minus mortgage payments. Calculation:NOI - Mortgage Payments | $15,679 | $188,148 |