33957 Investment Properties for Sale
Browse homes for sale and investment properties in 33957. Refine your search by price, property type, or more.
Best cash flowing properties in 33957
Active
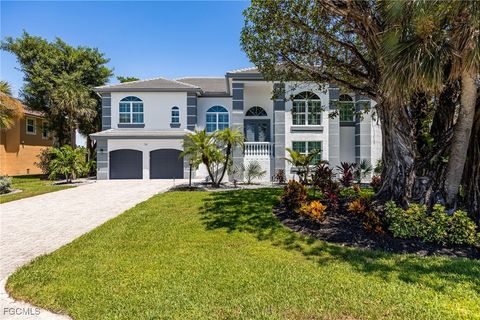
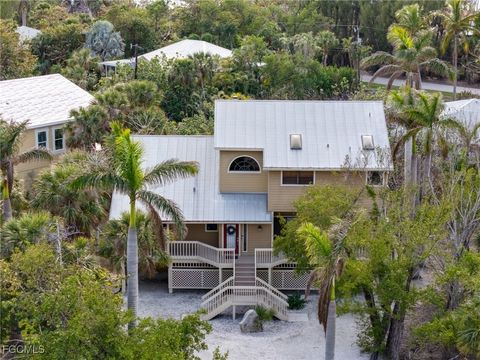
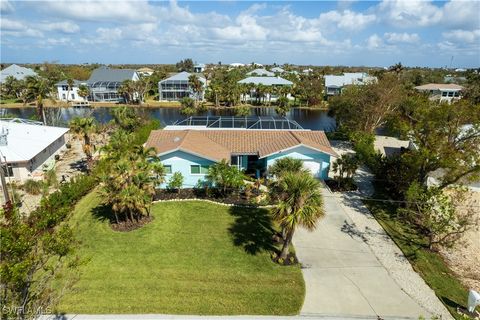
$650,000
3
bds
|
3
ba
|
3,106
sqft
|
built
1982
1866 Ardsley Way, Sanibel, FL 33957
$-298
Cash flow
-2.4%
Cash-on-Cash Return
5.6%
Cap rate
0.8%
Rent to Value Ratio
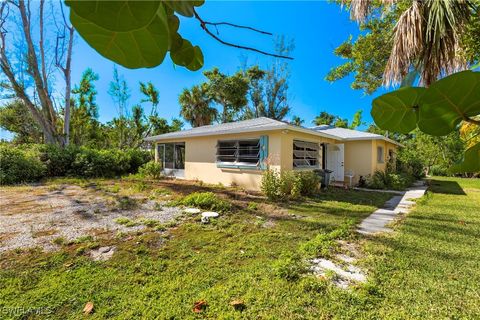
Active
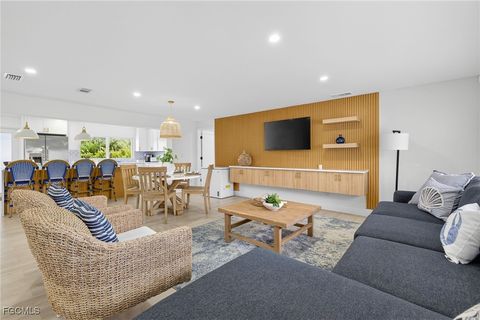
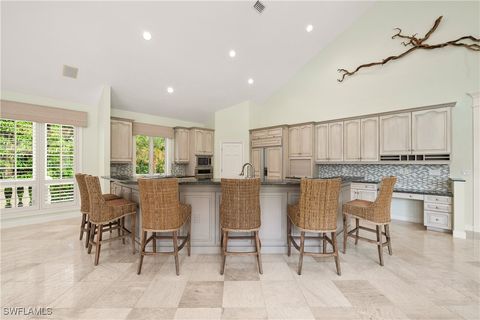
$530,000
3
bds
|
2
ba
|
1,864
sqft
|
built
1974
1632 Serenity Ln, Sanibel, FL 33957
$-366
Cash flow
-3.6%
Cash-on-Cash Return
5.3%
Cap rate
0.7%
Rent to Value Ratio
216 out of 240 properties for sale in 33957
Limited Results Shown
Create a free account, or log in to reveal all property listings and enjoy the complete experience.
Active
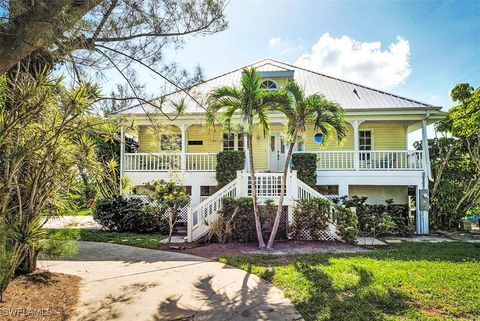
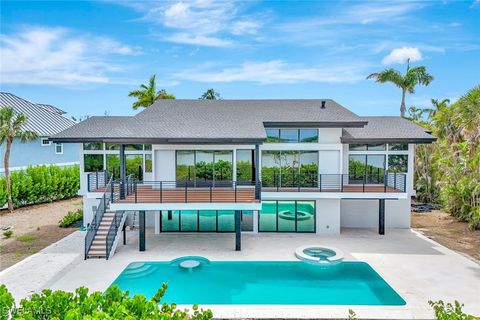
$699,000
3
bds
|
2
ba
|
1,536
sqft
|
built
2001
1846 Farm Trl, Sanibel, FL 33957
$-1,201
Cash flow
-9.0%
Cash-on-Cash Return
4.1%
Cap rate
0.7%
Rent to Value Ratio
Active
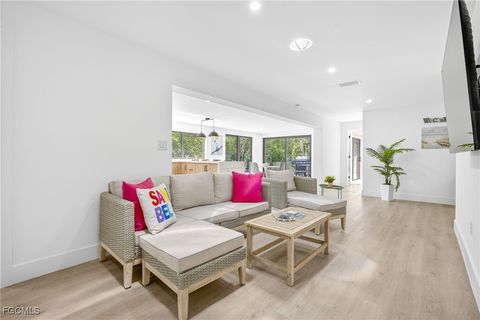
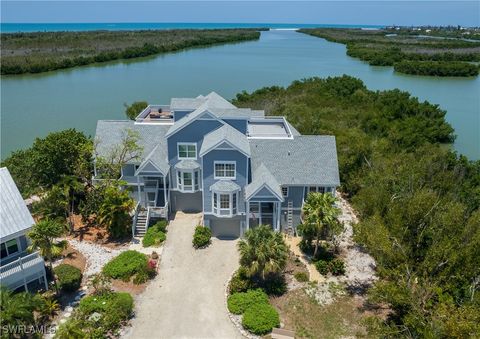
$1,999,000
3
bds
|
2
ba
|
2,015
sqft
|
built
2021
5750 Sanibel Captiva Rd, Sanibel, FL 33957
$-5,526
Cash flow
-14.4%
Cash-on-Cash Return
2.8%
Cap rate
0.4%
Rent to Value Ratio
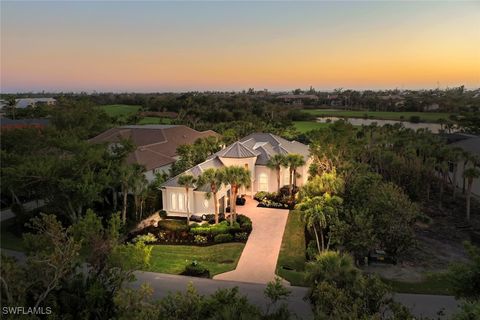
Active
$2,273,000
3
bds
|
5
ba
|
2,740
sqft
|
built
1998
710 Birdie View Pt, Sanibel, FL 33957
$-8,452
Cash flow
-19.4%
Cash-on-Cash Return
1.7%
Cap rate
0.3%
Rent to Value Ratio
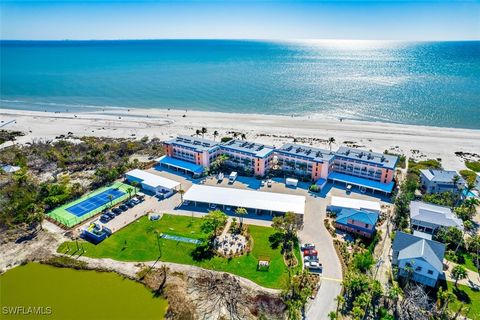
Active
$599,999
3
bds
|
2
ba
|
1,243
sqft
|
built
1985
9297 Kincaid Ct, Sanibel, FL 33957
$-825
Cash flow
-7.2%
Cash-on-Cash Return
4.5%
Cap rate
0.7%
Rent to Value Ratio
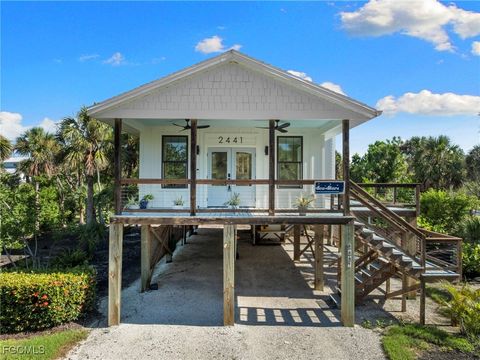
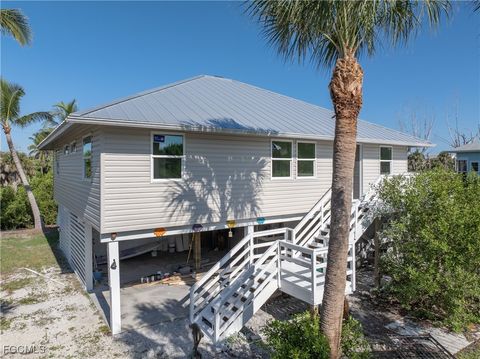
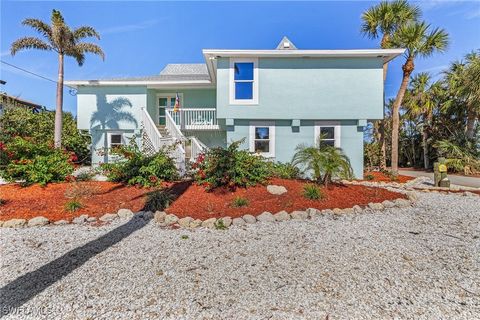
Active
$869,000
4
bds
|
4
ba
|
2,021
sqft
|
built
2019
2441 Shop Rd, Sanibel, FL 33957
$-840
Cash flow
-5.0%
Cash-on-Cash Return
5.0%
Cap rate
0.7%
Rent to Value Ratio
Active
$1,100,000
3
bds
|
2
ba
|
1,415
sqft
|
built
1978
1739 Jewel Box Dr, Sanibel, FL 33957
$-3,578
Cash flow
-17.0%
Cash-on-Cash Return
2.2%
Cap rate
0.4%
Rent to Value Ratio
Active
$3,999,999
5
bds
|
6
ba
|
4,922
sqft
|
built
2015
330 Cowry Ct, Sanibel, FL 33957
$-16,557
Cash flow
-21.6%
Cash-on-Cash Return
1.2%
Cap rate
0.2%
Rent to Value Ratio
Active
$1,575,000
5
bds
|
3
ba
|
0
sqft
|
built
1980
610 Donax St, Sanibel, FL 33957
$-5,331
Cash flow
-17.7%
Cash-on-Cash Return
2.1%
Cap rate
0.3%
Rent to Value Ratio
Active
$675,000
2
bds
|
2
ba
|
1,030
sqft
|
built
1975
1246 Fulgur St, Sanibel, FL 33957
$-2,641
Cash flow
-20.4%
Cash-on-Cash Return
1.5%
Cap rate
0.5%
Rent to Value Ratio
Active
$999,900
3
bds
|
4
ba
|
2,244
sqft
|
built
1982
487 E Gulf Dr, Sanibel, FL 33957
$-4,435
Cash flow
-23.1%
Cash-on-Cash Return
0.8%
Cap rate
0.6%
Rent to Value Ratio
Active
$1,150,000
3
bds
|
2
ba
|
1,812
sqft
|
built
1964
5885 Pine Tree Dr, Sanibel, FL 33957
$-2,872
Cash flow
-13.0%
Cash-on-Cash Return
3.2%
Cap rate
0.5%
Rent to Value Ratio
Active
$2,548,000
3
bds
|
3
ba
|
2,995
sqft
|
built
1975
4724 Rue Belle Mer, Sanibel, FL 33957
$-9,843
Cash flow
-20.2%
Cash-on-Cash Return
1.5%
Cap rate
0.2%
Rent to Value Ratio
Active
$425,000
2
bds
|
2
ba
|
888
sqft
|
built
1974
1653 Atlanta Plaza Dr, Sanibel, FL 33957
$-423
Cash flow
-5.2%
Cash-on-Cash Return
5.0%
Cap rate
0.7%
Rent to Value Ratio
Active
$550,000
3
bds
|
2
ba
|
1,293
sqft
|
built
1975
1683 Atlanta Plaza Dr, Sanibel, FL 33957
$-569
Cash flow
-5.4%
Cash-on-Cash Return
4.9%
Cap rate
0.7%
Rent to Value Ratio
Active
$1,190,000
4
bds
|
3
ba
|
2,170
sqft
|
built
1979
720 Durion Ct, Sanibel, FL 33957
$-1,877
Cash flow
-8.2%
Cash-on-Cash Return
4.3%
Cap rate
0.6%
Rent to Value Ratio
Active
$999,000
3
bds
|
2
ba
|
1,642
sqft
|
built
1981
640 Oliva St, Sanibel, FL 33957
$-1,802
Cash flow
-9.4%
Cash-on-Cash Return
4.0%
Cap rate
0.6%
Rent to Value Ratio
Active
$1,899,000
4
bds
|
4
ba
|
2,534
sqft
|
built
2015
3191 Twin Lakes Ln, Sanibel, FL 33957
$-5,453
Cash flow
-15.0%
Cash-on-Cash Return
2.7%
Cap rate
0.4%
Rent to Value Ratio
Active
$699,000
3
bds
|
2
ba
|
1,512
sqft
|
built
1979
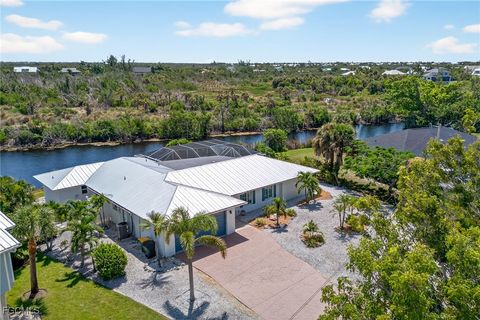
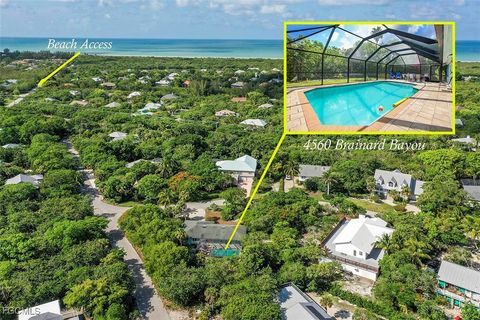
4560 Brainard Bayou Rd, Sanibel, FL 33957
$-366
Cash flow
-2.7%
Cash-on-Cash Return
5.5%
Cap rate
0.8%
Rent to Value Ratio
Active
$400,000
1
bds
|
1
ba
|
558
sqft
|
built
1977
1250 Tennisplace Ct, Sanibel, FL 33957
$-1,910
Cash flow
-24.9%
Cash-on-Cash Return
0.4%
Cap rate
0.6%
Rent to Value Ratio
Active
$1,495,000
3
bds
|
2
ba
|
1,819
sqft
|
built
1971
941 Pecten Ct, Sanibel, FL 33957
$-3,930
Cash flow
-13.7%
Cash-on-Cash Return
3.0%
Cap rate
0.5%
Rent to Value Ratio
Active
$1,325,000
3
bds
|
3
ba
|
2,265
sqft
|
built
1984
1286 Par View Dr, Sanibel, FL 33957
$-3,076
Cash flow
-12.1%
Cash-on-Cash Return
3.4%
Cap rate
0.5%
Rent to Value Ratio
Active
$674,000
3
bds
|
2
ba
|
1,650
sqft
|
built
1974
1657 Atlanta Plaza Dr, Sanibel, FL 33957
$-534
Cash flow
-4.1%
Cash-on-Cash Return
5.2%
Cap rate
0.7%
Rent to Value Ratio
Active
$1,100,000
2
bds
|
2
ba
|
1,243
sqft
|
built
1974
2445 W Gulf Dr, Sanibel, FL 33957
$-2,752
Cash flow
-13.1%
Cash-on-Cash Return
3.1%
Cap rate
0.4%
Rent to Value Ratio
Active
$699,000
2
bds
|
2
ba
|
1,079
sqft
|
built
1976
2321 W Gulf Dr, Sanibel, FL 33957
$-2,871
Cash flow
-21.4%
Cash-on-Cash Return
1.2%
Cap rate
0.5%
Rent to Value Ratio
Active
$1,750,000
2
bds
|
2
ba
|
1,563
sqft
|
built
1978
2929 W Gulf Dr, Sanibel, FL 33957
$-6,545
Cash flow
-19.5%
Cash-on-Cash Return
1.7%
Cap rate
0.3%
Rent to Value Ratio
Active
$899,000
3
bds
|
2
ba
|
1,218
sqft
|
built
1973
760 Sextant Dr, Sanibel, FL 33957
$-2,001
Cash flow
-11.6%
Cash-on-Cash Return
3.5%
Cap rate
0.4%
Rent to Value Ratio
Active
$1,099,000
4
bds
|
3
ba
|
2,512
sqft
|
built
1987
1241 Junonia St, Sanibel, FL 33957
$-2,396
Cash flow
-11.4%
Cash-on-Cash Return
3.5%
Cap rate
0.6%
Rent to Value Ratio
Active
$989,000
4
bds
|
3
ba
|
1,714
sqft
|
built
1979
1377 Sand Castle Rd, Sanibel, FL 33957
$-3,173
Cash flow
-16.7%
Cash-on-Cash Return
2.3%
Cap rate
0.4%
Rent to Value Ratio
Active
$1,195,000
3
bds
|
3
ba
|
3,568
sqft
|
built
1988
3366 Barra Cir, Sanibel, FL 33957
$-2,862
Cash flow
-12.5%
Cash-on-Cash Return
3.3%
Cap rate
0.5%
Rent to Value Ratio
Active
$899,000
4
bds
|
3
ba
|
1,714
sqft
|
built
1969
1105 Skiff Pl, Sanibel, FL 33957
$-2,919
Cash flow
-16.9%
Cash-on-Cash Return
2.3%
Cap rate
0.4%
Rent to Value Ratio
Active
$465,000
2
bds
|
2
ba
|
1,528
sqft
|
built
1971
837 Casa Ybel Rd, Sanibel, FL 33957
$-1,328
Cash flow
-14.9%
Cash-on-Cash Return
2.7%
Cap rate
0.6%
Rent to Value Ratio
Active
$2,495,000
3
bds
|
4
ba
|
2,916
sqft
|
built
2002
5729 Baltusrol Ct, Sanibel, FL 33957
$-8,599
Cash flow
-18.0%
Cash-on-Cash Return
2.0%
Cap rate
0.3%
Rent to Value Ratio
Active
$999,000
2
bds
|
2
ba
|
930
sqft
|
built
1975
2230 Camino Del Mar Dr, Sanibel, FL 33957
$-2,165
Cash flow
-11.3%
Cash-on-Cash Return
3.5%
Cap rate
0.4%
Rent to Value Ratio
Active
$924,900
3
bds
|
4
ba
|
1,640
sqft
|
built
1981
465 Lake Murex Cir, Sanibel, FL 33957
$-2,204
Cash flow
-12.4%
Cash-on-Cash Return
3.3%
Cap rate
0.5%
Rent to Value Ratio
Active
$849,000
3
bds
|
2
ba
|
1,611
sqft
|
built
1973
566 Boulder Dr, Sanibel, FL 33957
$-983
Cash flow
-6.0%
Cash-on-Cash Return
4.8%
Cap rate
0.7%
Rent to Value Ratio
Active
$2,750,000
6
bds
|
8
ba
|
6,273
sqft
|
built
1997
2969 Wulfert Rd, Sanibel, FL 33957
$-12,019
Cash flow
-22.8%
Cash-on-Cash Return
0.9%
Cap rate
0.3%
Rent to Value Ratio
Active
$1,990,000
4
bds
|
4
ba
|
3,266
sqft
|
built
1999
5435 Osprey Ct, Sanibel, FL 33957
$-5,455
Cash flow
-14.3%
Cash-on-Cash Return
2.9%
Cap rate
0.5%
Rent to Value Ratio
Active
$1,795,000
3
bds
|
4
ba
|
2,460
sqft
|
built
1990
5438 Shearwater Dr, Sanibel, FL 33957
$-7,085
Cash flow
-20.6%
Cash-on-Cash Return
1.4%
Cap rate
0.3%
Rent to Value Ratio