
$2,273,000
Investment Summary
- Monthly Cash Flow
- -$8,452
- Cap Rate
- 1.7%
- Cash-on-Cash Return
- -19.4%
- Debt Coverage Ratio
- 0.27
- Internal Rate of Return (5 years)
- -14.7%
Cash Flow
Net Operating Income (NOI) minus mortgage payments.
Calculation:
NOI - Mortgage Payments
Cap Rate (Market Value)
Capitalization Rate is a rate of return that compares the yearly Net Operating Income (NOI) to the market value.
Calculation:
NOI / Market Value
Cash-on-Cash Return (CoC)
Annual Cash Flow / Cash Invested
Calculation:
Annual cash flow divided by initial cash invested.
Debt Coverage Ratio (DCR)
Net Operating Income (NOI) divided by total debt payments.
Calculation:
NOI / Total Debt Payments
Internal Rate of Return (IRR)
A metric for assessing profitability over time. IRR is the discount rate at which the net present value (NPV) of all future cash flows (positive and negative) from an investment equals zero — including both periodic cash flow (such as rent) and a projected sale at the end of the holding period. It represents the expected annualized return, accounting for income, expenses, and the recovery of capital through a future sale.
Property Description
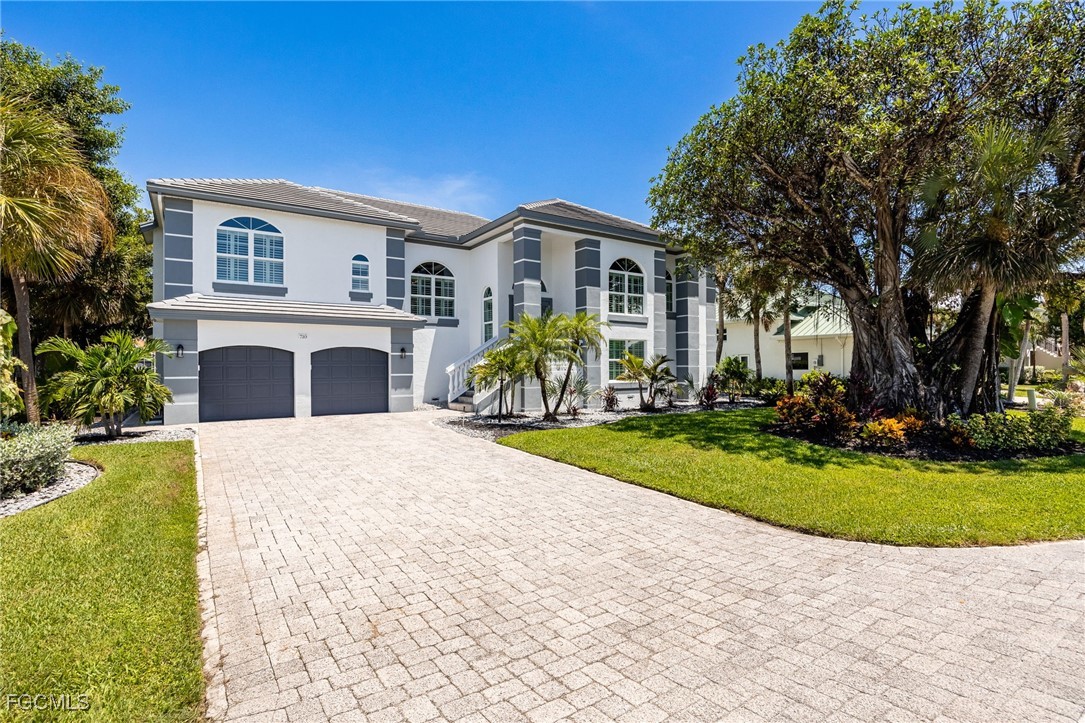
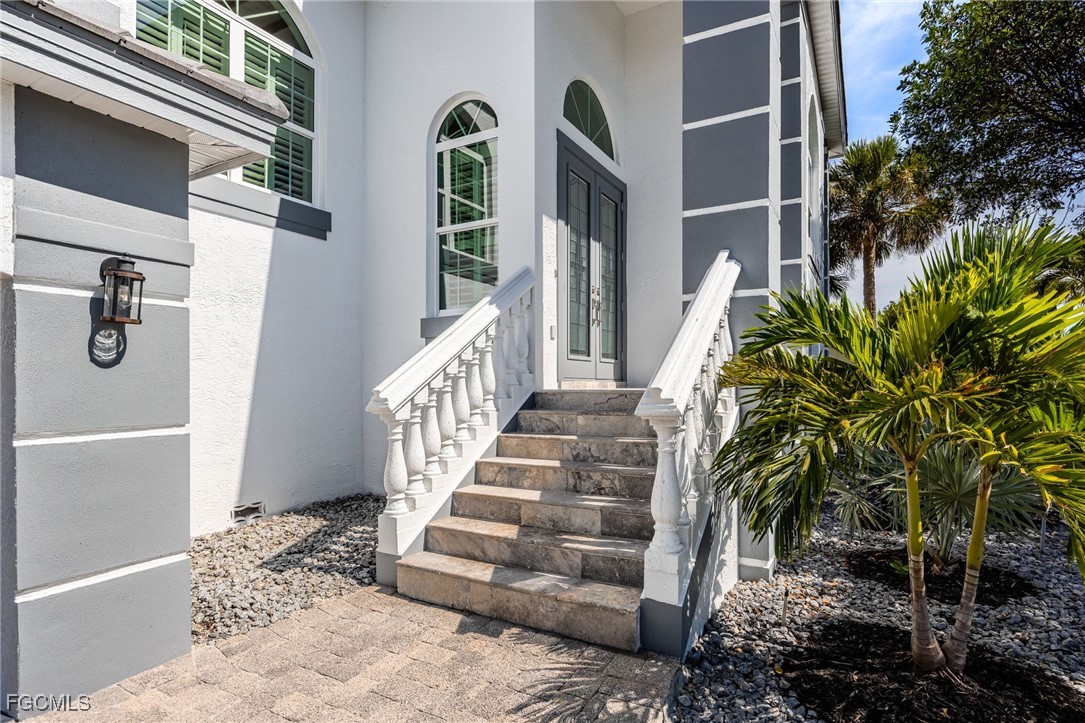
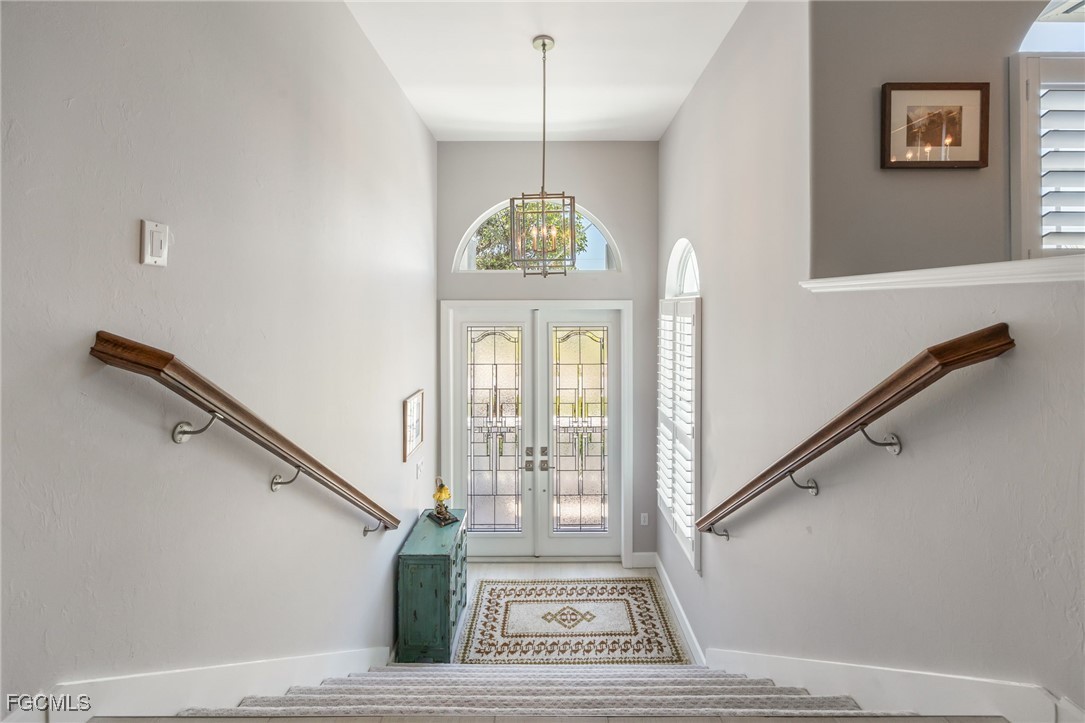
VACATION AND LIVE THE LUXURIOUS TROPICAL ISLAND LIFE WITHOUT GETTING ON A PLANE! Literally walk to the beach from your home whereas most have to fly! Sanibel and Captiva Islands are of known as two of the most prestigious and desired islands in the world! Known for the abundance of shelling, soft white sand, dolphin and pelican watching, swimming, boating, shaded bike/jog path, wildlife preserves, golfing, dining, specialty boutiques, etc. This small island packs a punch when it comes to amenities and pleasures alike. Just beyond the very mature and gorgeous Banyan tree that adorns the manicured front lawn you will find a gem! Enter this property from the natural stone steps and landing of a mediterranean style verandah to find a gorgeous double leaded glass entry door. The foyer is generous with a large and comfortable step up stairway that leads to the main living area. WINDOWS AND LIGHT ARE EVERYWHERE which mesmerizes you with view of the Sanibel river, tropical foliage, the pool and spa, and the Sanibel Golf Course. The home was recently painted and tastefully remodeled in 2021 to represent elegance, comfort and pleasing aesthetics. Roof 2022, impact windows 2025. A few updates include: pool cage, custom interior shutters, upscale LED lighting, ceramic tile flooring, carpeted bedrooms, stucco on concrete and finished floors in the first level pool house, and partially coffered celling adornments. Additional fun items also include: An ornamental fireplace that can be used for visual or heating purposes, a dumb waiter for that lazy quick and easy drop off, vacuum system, extra water heater to eliminate the wait for hot water when the house is full of guests, extended garage to accommodate your golf cart, heated pool, and outdoor shower. The split floorpan is spacious and well designed. Enjoy the views while creating delicious meals for your guests in the gourmet style kitchen equipped with a walk in pantry, Viking double convection oven, propane burners, a griddle, an on demand hot water faucet, Samsung refrigerator/freezer that offers extra freezer convertibility when needed, Quartz counters, island with ample seating area for visiting with the chef, high cabinets, and an eat in breakfast area to name a few. Start a serene morning while sipping on your favorite delight on the large tiled lanai as you watch the sunrise over the glistening river, listen to birds sing and watch the wildlife start their morning business, then go for a swim. The lanai is also equipped with sunshades if you prefer a more private experience. The over 2000 Sq ft first floor area can be used for a pool party house, play area, hobbies, guest overflow, or storage. The golf course is under a sensational and much anticipated redesign that will unveil a friendly play and reasonable challenge in mind. It will also include a respite from the heat along the course offering beverages, refreshments, restroom areas and a clubhouse to include a new vacation friendly restaurant.
Build Your Team
Quickly find investor-friendly professionals who can help you succeed in real estate investing at any stage of the investing journey.


Agents
Match with investor-friendly agents who can help you find, analyze, and close your next deal


Lenders
Get the best funding…find investor-friendly lenders who specialize in your deal strategy


Property Managers
Transition to passive investing. Find a trusted property management partnership that lasts.


Tax Pros & Accountants
Taxes and financial reporting made easy—find experts to create tax savings strategies, file taxes, and more
Location
Property Details
Parking
- Description: Mixed
- Details: Attached, Driveway, Garage, Golf Cart Garage, Paved, Garage Door Opener
- Garage Spaces: 2
- Spaces Total: 0
Bedroom Information
- # of Bedrooms: 3
Bathroom Information
- # of Baths (Full): 4
- # of Baths (Total): 5.0
Interior Features
- # of Stories: 2
Exterior Features
- Exterior Walls Materials: Stucco
- Roof Type: IRR/Cathedral
- Roof Material: Tile
- Pool: Yes
HOA
- Has HOA: Yes
- Additional HOA Fee: $50/annually
Land Information
- Land Use: Residential
- Land Use Subtype: Single Family Residential
Lot Information
- Parcel ID: 304623T10020B.0060
- Lot Size: 0 sqft
Property Information
- Property Type: Single Family Residence
- Style: Split Level, Traditional
- Year Built: 1998
Tax Information
- Annual Tax: $13,826
Utilities
- Water & Sewer: Public
- Heating: Central, Electric
- Cooling: Central Air, Ceiling Fan(s), Electric, Humidity Control
Location
- County: Lee
Listing Details
Investment Summary
- Monthly Cash Flow
- -$8,452
- Cap Rate
- 1.7%
- Cash-on-Cash Return
- -19.4%
- Debt Coverage Ratio
- 0.27
- Internal Rate of Return (5 years)
- -14.7%
Cash Flow
Net Operating Income (NOI) minus mortgage payments.
Calculation:
NOI - Mortgage Payments
Cap Rate (Market Value)
Capitalization Rate is a rate of return that compares the yearly Net Operating Income (NOI) to the market value.
Calculation:
NOI / Market Value
Cash-on-Cash Return (CoC)
Annual Cash Flow / Cash Invested
Calculation:
Annual cash flow divided by initial cash invested.
Debt Coverage Ratio (DCR)
Net Operating Income (NOI) divided by total debt payments.
Calculation:
NOI / Total Debt Payments
Internal Rate of Return (IRR)
A metric for assessing profitability over time. IRR is the discount rate at which the net present value (NPV) of all future cash flows (positive and negative) from an investment equals zero — including both periodic cash flow (such as rent) and a projected sale at the end of the holding period. It represents the expected annualized return, accounting for income, expenses, and the recovery of capital through a future sale.
Purchase Details
Purchase PriceThe price paid for the property. Purchase price:
| $2,273,000 |
|---|---|
Amount FinancedThe amount of the purchase financed through a loan. Amount financed:
| -$1,818,400 |
Down paymentThe initial payment made towards the purchase. Down payment:
| $454,600 |
Closing CostsFees and expenses associated with purchasing a property, typically ranging from 2% to 5% of the home’s purchase price, paid at the end of a home purchase to cover services like lending, title transfer, and taxes. Closing costs:
| $68,190 |
Rehab CostsCosts incurred to repair or improve the property, including: roof, flooring, exterior siding, kitchen, exterior paint, bathrooms, etc. Rehab costs:
| $0 |
Initial Cash InvestedThe total initial cash invested in the property. Calculation:Down payment + Buying costs + Rehab costs Initial cash invested:
| $522,790 |
Square Feet (SQFT)The total square footage of the property. Square feet:
| 2,740 |
Cost Per Square FootCost per square foot of the property. Calculation:Purchase Price / Square Feet Cost per square foot:
| $830 |
Monthly Rent Per Square FootMonthly rent divided by the number of square feet. This ratio helps investors compare rental income efficiency across properties, markets, and unit sizes Calculation:Monthly Rent / Square Feet Monthly rent per square foot:
| $2.30 |
Financing Details
Loan AmountThe total sum of money borrowed from a lender to finance a property purchase. Calculation:Purchase Price - Down Payment
Loan amount:
| $1,818,400 |
|---|---|
Loan to Value Ratio (LTV)Loan amount divided by the market value of the property. Calculation:Loan Amount / Market Value
Loan to value ratio:
| 80.0% |
Loan TypeThe type of loan (e.g., fixed, adjustable).
Loan type:
| Amortizing |
TermThe loan repayment period in years.
Term:
| 30 years |
Interest RateThe percentage a lender charges on the borrowed amount of a loan, determining the cost of borrowing money.
Interest rate:
| 6.625% |
Principal & Interest (PI)The principal is the portion of the loan payment that reduces the loan balance. The interest is the lender's charge for borrowing money. Calculation:(P * r * (1 + r) ** n) / ((1 + r) ** n - 1) Where:
P = Loan amount (principal)
Principal & interest:
| $11,643 |
Property TaxesAnnual taxes levied by local governments on real estate properties. These taxes fund public services like schools, roads, and emergency services.
Property tax:
| $1,152 |
InsuranceThe costs for insurance coverage to protect against financial losses due to risks like fire, natural disasters, theft, liability, or tenant-related damages. Calculation:Assumes 7% of gross rental income, unless insurance rates are specified.
Insurance:
| $441 |
Private Mortgage Insurance (PMI)A fee that borrowers pay when they take out a conventional loan with a loan-to-value (LTV) ratio above 80%.
Private mortgage insurance (PMI):
| $0 |
Monthly PaymentThe fixed amount a borrower pays each month to repay a loan. It typically includes principal and interest (P&I) and may also cover property taxes, insurance, HOA fees, and PMI if escrowed. Monthly payment:
| $13,236 |
Operating Income
| % Rent | Monthly | Yearly | |
|---|---|---|---|
Gross RentThe total rental income received from tenants before deducting any expenses. Includes base rent, late fees, pet fees, parking fees, and other recurring charges.
Gross rent:
| $6,300 | $75,600 | |
Vacancy LossExpected loss of rent due to vacancies.
Vacancy loss:
(6%)
| 6% | -$378 | -$4,536 |
Operating IncomeGross rental income minus vacancy loss. Calculation:Gross rent - Vacancy loss
Operating income:
| $5,922 | $71,064 |
Operating Expenses
| % Rent | Monthly | Yearly | |
|---|---|---|---|
Property TaxesAnnual taxes levied by local governments on real estate properties. These taxes fund public services like schools, roads, and emergency services. | 18% | -$1,152 | -$13,827 |
InsuranceThe costs for insurance coverage to protect against financial losses due to risks like fire, natural disasters, theft, liability, or tenant-related damages. Calculation:Assumes 7% of gross rental income, unless insurance rates are specified. | 7% | -$441 | -$5,292 |
Property ManagementThe costs associated with hiring a property manager to handle the day-to-day operations of a rental property. Includes management fees, leasing fes, eviction fees, etc. Calculation:Assumes 8% of gross rental income. | 8% | -$504 | -$6,048 |
Repairs & MaintenanceOngoing costs for routine upkeep and minor fixes needed to keep a property in good working condition. Calculation:Assumes 5% of gross rental income. Varies by property age and condition. | 5% | -$315 | -$3,780 |
Capital ExpensesLarge, infrequent costs for major improvements or replacements, like a new roof, HVAC system, or appliances. Calculation:Assumes 5% of gross rental income. Varies by property age. | 5% | -$315 | -$3,780 |
HOA FeesRegular dues paid to a Homeowners Association for community maintenance, amenities, and management. Similar fees include: Condo Association Fees, Co-op Maintenance Fees, etc. | 0% | -$4 | -$48 |
Operating ExpensesRecurring costs required to maintain and manage a rental property, including property taxes, insurance, maintenance, repairs, utilities (if paid by the owner), property management fees, and other day-to-day expenses. Calculation:Insurance + Property Taxes + Property Management + Repairs & Maintenance + Capital Expenditures + HOA Fees | 43% | -$2,731 | -$32,775 |
Cash Flow
| Monthly | Yearly | |
|---|---|---|
Net Operating Income (NOI)The income generated from a property after deducting all operating expenses but before deducting mortgage payments, taxes, and capital expenditures. Calculation:Gross Operating Income - Operating Expenses
Net operating income:
| $3,191 | $38,292 |
Mortgage PaymentThe fixed amount a borrower pays each month to repay a loan. It typically includes principal and interest (P&I) and may also cover property taxes, insurance, HOA fees, and PMI if escrowed. | -$11,643 | -$139,716 |
Cash FlowNet Operating Income (NOI) minus mortgage payments. Calculation:NOI - Mortgage Payments | -$8,452 | -$101,424 |