$449,000
Investment Summary
We noticed that HOA fees are missing—this is a standard expense and should be considered in your estimate.
- Monthly Cash Flow
- $400
- Cap Rate
- 7.2%
- Cash-on-Cash Return
- 4.6%
- Debt Coverage Ratio
- 1.17
- Internal Rate of Return (5 years)
- 8.5%
Cash Flow
Net Operating Income (NOI) minus mortgage payments.
Calculation:
NOI - Mortgage Payments
Cap Rate (Market Value)
Capitalization Rate is a rate of return that compares the yearly Net Operating Income (NOI) to the market value.
Calculation:
NOI / Market Value
Cash-on-Cash Return (CoC)
Annual Cash Flow / Cash Invested
Calculation:
Annual cash flow divided by initial cash invested.
Debt Coverage Ratio (DCR)
Net Operating Income (NOI) divided by total debt payments.
Calculation:
NOI / Total Debt Payments
Internal Rate of Return (IRR)
A metric for assessing profitability over time. IRR is the discount rate at which the net present value (NPV) of all future cash flows (positive and negative) from an investment equals zero — including both periodic cash flow (such as rent) and a projected sale at the end of the holding period. It represents the expected annualized return, accounting for income, expenses, and the recovery of capital through a future sale.
Property Description
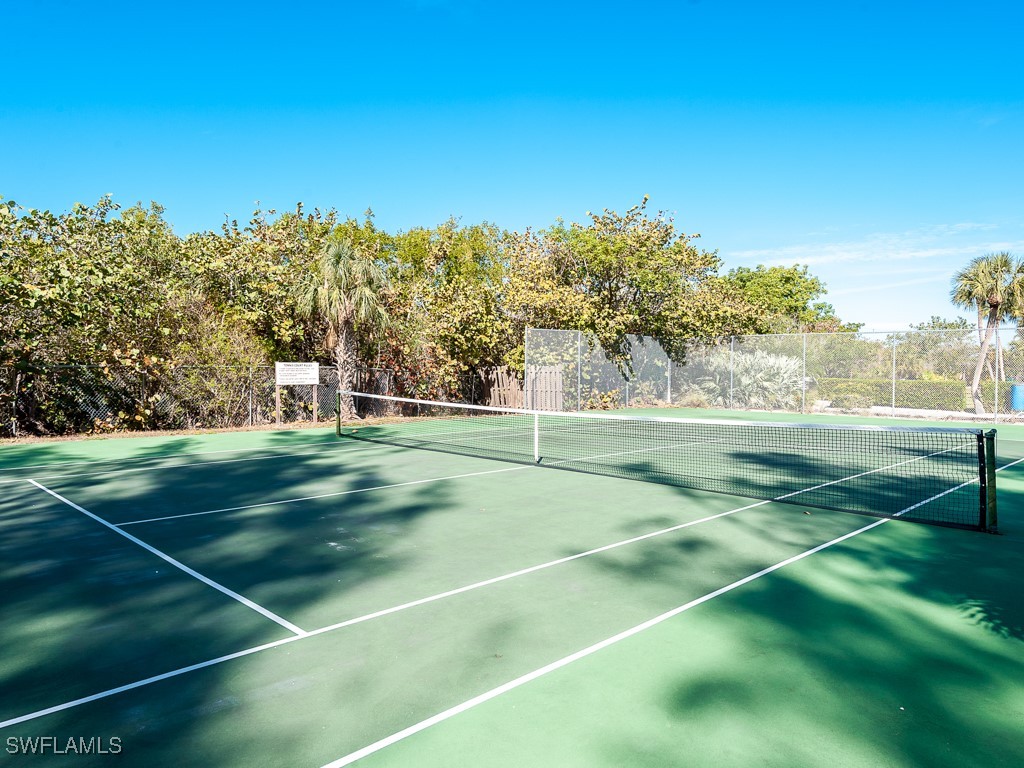
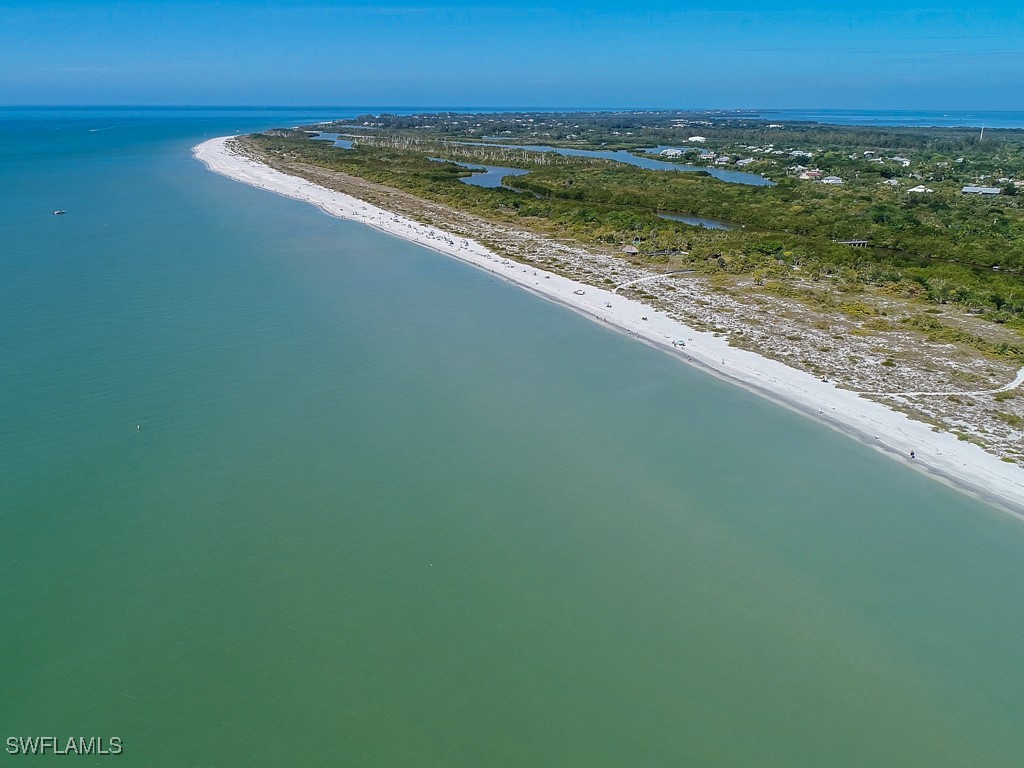
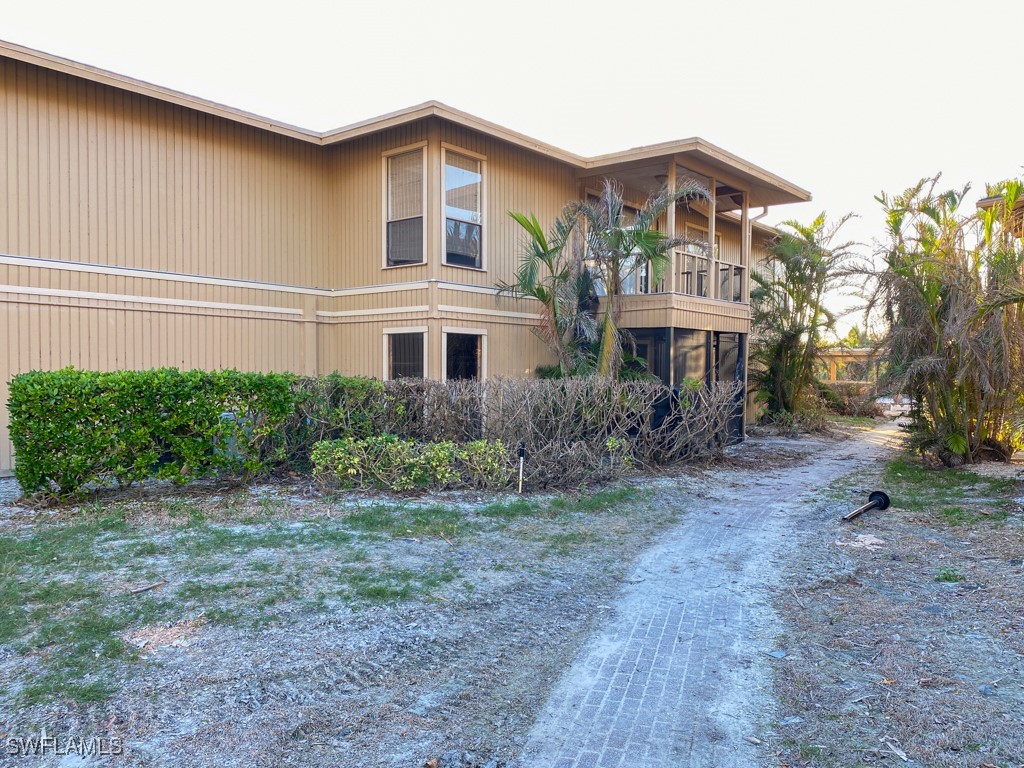
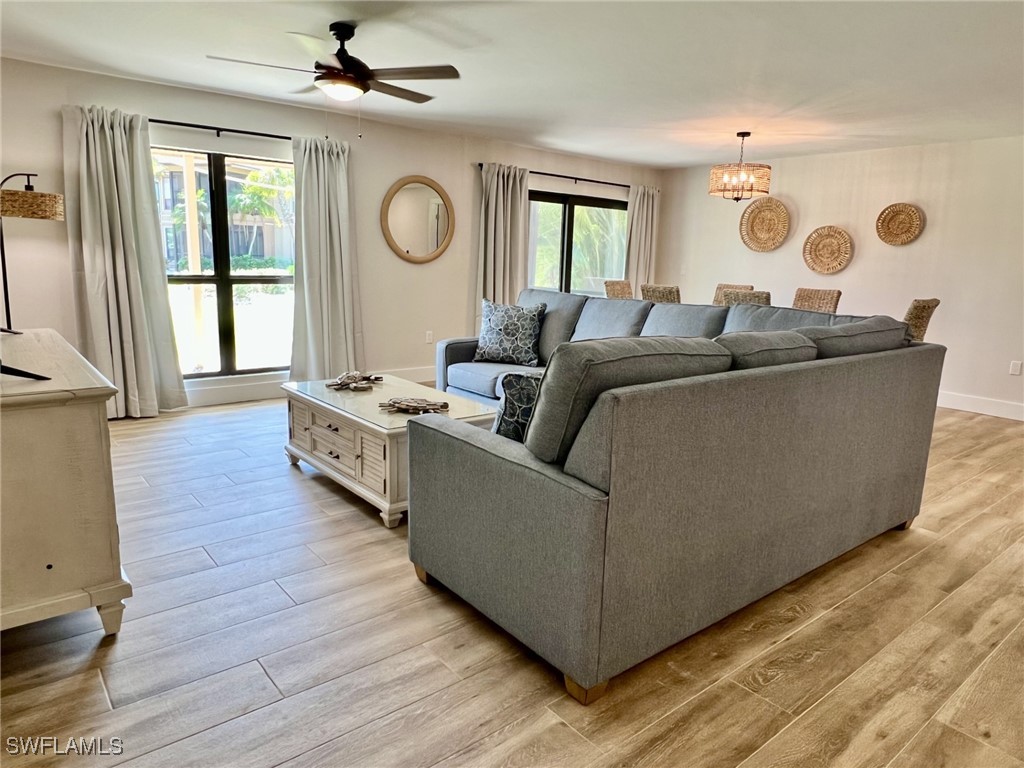
Welcome to your perfect island escape—a beautifully updated, ground-floor condo in the highly desirable Blind Pass community on Sanibel Island. This property offers the rare combination of modern design, comfort, and exceptional value just steps from one of the world’s most celebrated beaches. Whether you're looking for a peaceful coastal retreat, a smart investment opportunity, or a bit of both, this condo delivers! From the moment you enter, you'll notice the careful attention to detail and thoughtful design choices that set this unit apart. The open-concept floor plan is highlighted by driftwood-hued tile flooring throughout, creating a seamless flow and inviting coastal ambiance. The beautifully remodeled kitchen will thrill any home chef at the heart of the home. Outfitted with elegant gray shaker cabinets, Quartz countertops, and classic subway tile backsplash. The kitchen opens directly into the expansive living and dining area, making it easy for entertaining. The lanai offers a peaceful connection to nature, where the sounds of birds and gentle island breezes set the tone for total relaxation. The well-designed split-bedroom layout ensures privacy for both owners and guests. Each spacious bedroom has large walk-in closets, offering ample storage for beach gear, clothing, and more. The bathrooms are equally impressive, with tasteful finishes, updated vanities, and contemporary fixtures that reflect the home’s modern coastal aesthetic. This unit has been further enhanced with brand-new impact-resistant windows and doors, which not only improve energy efficiency and storm protection but also allow abundant natural light to pour in, highlighting every detail of this stylish interior. Blind Pass is truly one of Sanibel Island’s best-kept secrets. This charming community is nestled on the west end of the island, just a short walk from the world-renowned Bowman’s Beach—named one of the Top 10 Beaches in the World by U.S. News Travel. Here, you’ll find soft white sands, spectacular shelling, and unforgettable Gulf sunsets. The community also offers an impressive array of amenities, including a large, heated swimming pool, tennis and pickleball courts, BBQ areas, on-site kayak and paddleboard rentals, and a private footbridge leading to the beach. Love adventure? Spend your days exploring the mangrove-lined Clam Bayou by kayak, biking along scenic island trails to nearby Captiva, or fishing from the shoreline. Prefer downtime? Lounge under swaying palms, collect shells at sunrise, or enjoy the laid-back island lifestyle at your own pace. Whether you're seeking a full-time residence, a vacation getaway, or a high-performing weekly rental, this condo has it all. Stylish, move-in ready, and set in a location that perfectly balances serenity and excitement—this is your chance to own a slice of Sanibel paradise.
Build Your Team
Quickly find investor-friendly professionals who can help you succeed in real estate investing at any stage of the investing journey.


Agents
Match with investor-friendly agents who can help you find, analyze, and close your next deal


Lenders
Get the best funding…find investor-friendly lenders who specialize in your deal strategy


Property Managers
Transition to passive investing. Find a trusted property management partnership that lasts.


Tax Pros & Accountants
Taxes and financial reporting made easy—find experts to create tax savings strategies, file taxes, and more
Location
Property Details
Parking
- Description: Assigned, Covered, Guest, OneSpace, DetachedCarport
- Details: Assigned, Covered, Guest, Detached Carport
- Garage Spaces: 0
- Spaces Total: 0
Bedroom Information
- # of Bedrooms: 2
Bathroom Information
- # of Baths (Full): 2
- # of Baths (Total): 2.0
Interior Features
- # of Stories: 2
Exterior Features
- Foundation: Pillar/Post/Pier
- Roof Material: Shingle
- Pool Community: Yes
Land Information
- Land Use: Residential
- Land Use Subtype: Condominium Unit
Lot Information
- Parcel ID: 184622T40030F.1040
- Lot Size: 0 sqft
Property Information
- Property Type: Condominium
- Style: Courtyard, Two Story, Low Rise
- Year Built: 1975
Tax Information
- Annual Tax: $716
Utilities
- Water & Sewer: Public
- Heating: Central, Electric
- Cooling: Central Air, Ceiling Fan(s), Electric
Location
- County: Lee
Listing Details
Investment Summary
We noticed that HOA fees are missing—this is a standard expense and should be considered in your estimate.
- Monthly Cash Flow
- $400
- Cap Rate
- 7.2%
- Cash-on-Cash Return
- 4.6%
- Debt Coverage Ratio
- 1.17
- Internal Rate of Return (5 years)
- 8.5%
Cash Flow
Net Operating Income (NOI) minus mortgage payments.
Calculation:
NOI - Mortgage Payments
Cap Rate (Market Value)
Capitalization Rate is a rate of return that compares the yearly Net Operating Income (NOI) to the market value.
Calculation:
NOI / Market Value
Cash-on-Cash Return (CoC)
Annual Cash Flow / Cash Invested
Calculation:
Annual cash flow divided by initial cash invested.
Debt Coverage Ratio (DCR)
Net Operating Income (NOI) divided by total debt payments.
Calculation:
NOI / Total Debt Payments
Internal Rate of Return (IRR)
A metric for assessing profitability over time. IRR is the discount rate at which the net present value (NPV) of all future cash flows (positive and negative) from an investment equals zero — including both periodic cash flow (such as rent) and a projected sale at the end of the holding period. It represents the expected annualized return, accounting for income, expenses, and the recovery of capital through a future sale.
Purchase Details
Purchase PriceThe price paid for the property. Purchase price:
| $449,000 |
|---|---|
Amount FinancedThe amount of the purchase financed through a loan. Amount financed:
| -$359,200 |
Down paymentThe initial payment made towards the purchase. Down payment:
| $89,800 |
Closing CostsFees and expenses associated with purchasing a property, typically ranging from 2% to 5% of the home’s purchase price, paid at the end of a home purchase to cover services like lending, title transfer, and taxes. Closing costs:
| $13,470 |
Rehab CostsCosts incurred to repair or improve the property, including: roof, flooring, exterior siding, kitchen, exterior paint, bathrooms, etc. Rehab costs:
| $0 |
Initial Cash InvestedThe total initial cash invested in the property. Calculation:Down payment + Buying costs + Rehab costs Initial cash invested:
| $103,270 |
Square Feet (SQFT)The total square footage of the property. Square feet:
| 1,360 |
Cost Per Square FootCost per square foot of the property. Calculation:Purchase Price / Square Feet Cost per square foot:
| $330 |
Monthly Rent Per Square FootMonthly rent divided by the number of square feet. This ratio helps investors compare rental income efficiency across properties, markets, and unit sizes Calculation:Monthly Rent / Square Feet Monthly rent per square foot:
| $2.94 |
Financing Details
Loan AmountThe total sum of money borrowed from a lender to finance a property purchase. Calculation:Purchase Price - Down Payment
Loan amount:
| $359,200 |
|---|---|
Loan to Value Ratio (LTV)Loan amount divided by the market value of the property. Calculation:Loan Amount / Market Value
Loan to value ratio:
| 80.0% |
Loan TypeThe type of loan (e.g., fixed, adjustable).
Loan type:
| Amortizing |
TermThe loan repayment period in years.
Term:
| 30 years |
Interest RateThe percentage a lender charges on the borrowed amount of a loan, determining the cost of borrowing money.
Interest rate:
| 6.625% |
Principal & Interest (PI)The principal is the portion of the loan payment that reduces the loan balance. The interest is the lender's charge for borrowing money. Calculation:(P * r * (1 + r) ** n) / ((1 + r) ** n - 1) Where:
P = Loan amount (principal)
Principal & interest:
| $2,300 |
Property TaxesAnnual taxes levied by local governments on real estate properties. These taxes fund public services like schools, roads, and emergency services.
Property tax:
| $60 |
InsuranceThe costs for insurance coverage to protect against financial losses due to risks like fire, natural disasters, theft, liability, or tenant-related damages. Calculation:Assumes 7% of gross rental income, unless insurance rates are specified.
Insurance:
| $280 |
Private Mortgage Insurance (PMI)A fee that borrowers pay when they take out a conventional loan with a loan-to-value (LTV) ratio above 80%.
Private mortgage insurance (PMI):
| $0 |
Monthly PaymentThe fixed amount a borrower pays each month to repay a loan. It typically includes principal and interest (P&I) and may also cover property taxes, insurance, HOA fees, and PMI if escrowed. Monthly payment:
| $2,640 |
Operating Income
| % Rent | Monthly | Yearly | |
|---|---|---|---|
Gross RentThe total rental income received from tenants before deducting any expenses. Includes base rent, late fees, pet fees, parking fees, and other recurring charges.
Gross rent:
| $4,000 | $48,000 | |
Vacancy LossExpected loss of rent due to vacancies.
Vacancy loss:
(6%)
| 6% | -$240 | -$2,880 |
Operating IncomeGross rental income minus vacancy loss. Calculation:Gross rent - Vacancy loss
Operating income:
| $3,760 | $45,120 |
Operating Expenses
| % Rent | Monthly | Yearly | |
|---|---|---|---|
Property TaxesAnnual taxes levied by local governments on real estate properties. These taxes fund public services like schools, roads, and emergency services. | 1% | -$60 | -$716 |
InsuranceThe costs for insurance coverage to protect against financial losses due to risks like fire, natural disasters, theft, liability, or tenant-related damages. Calculation:Assumes 7% of gross rental income, unless insurance rates are specified. | 7% | -$280 | -$3,360 |
Property ManagementThe costs associated with hiring a property manager to handle the day-to-day operations of a rental property. Includes management fees, leasing fes, eviction fees, etc. Calculation:Assumes 8% of gross rental income. | 8% | -$320 | -$3,840 |
Repairs & MaintenanceOngoing costs for routine upkeep and minor fixes needed to keep a property in good working condition. Calculation:Assumes 5% of gross rental income. Varies by property age and condition. | 5% | -$200 | -$2,400 |
Capital ExpensesLarge, infrequent costs for major improvements or replacements, like a new roof, HVAC system, or appliances. Calculation:Assumes 5% of gross rental income. Varies by property age. | 5% | -$200 | -$2,400 |
HOA FeesRegular dues paid to a Homeowners Association for community maintenance, amenities, and management. Similar fees include: Condo Association Fees, Co-op Maintenance Fees, etc. | n/a | n/a | n/a |
Operating ExpensesRecurring costs required to maintain and manage a rental property, including property taxes, insurance, maintenance, repairs, utilities (if paid by the owner), property management fees, and other day-to-day expenses. Calculation:Insurance + Property Taxes + Property Management + Repairs & Maintenance + Capital Expenditures + HOA Fees | 26% | -$1,060 | -$12,716 |
Cash Flow
| Monthly | Yearly | |
|---|---|---|
Net Operating Income (NOI)The income generated from a property after deducting all operating expenses but before deducting mortgage payments, taxes, and capital expenditures. Calculation:Gross Operating Income - Operating Expenses
Net operating income:
| $2,700 | $32,400 |
Mortgage PaymentThe fixed amount a borrower pays each month to repay a loan. It typically includes principal and interest (P&I) and may also cover property taxes, insurance, HOA fees, and PMI if escrowed. | -$2,300 | -$27,600 |
Cash FlowNet Operating Income (NOI) minus mortgage payments. Calculation:NOI - Mortgage Payments | $400 | $4,800 |