$3,999,000
Investment Summary
- Monthly Cash Flow
- -$18,632
- Cap Rate
- 0.1%
- Cash-on-Cash Return
- -24.3%
- Debt Coverage Ratio
- 0.02
- Internal Rate of Return (5 years)
- -19.4%
Cash Flow
Net Operating Income (NOI) minus mortgage payments.
Calculation:
NOI - Mortgage Payments
Cap Rate (Market Value)
Capitalization Rate is a rate of return that compares the yearly Net Operating Income (NOI) to the market value.
Calculation:
NOI / Market Value
Cash-on-Cash Return (CoC)
Annual Cash Flow / Cash Invested
Calculation:
Annual cash flow divided by initial cash invested.
Debt Coverage Ratio (DCR)
Net Operating Income (NOI) divided by total debt payments.
Calculation:
NOI / Total Debt Payments
Internal Rate of Return (IRR)
A metric for assessing profitability over time. IRR is the discount rate at which the net present value (NPV) of all future cash flows (positive and negative) from an investment equals zero — including both periodic cash flow (such as rent) and a projected sale at the end of the holding period. It represents the expected annualized return, accounting for income, expenses, and the recovery of capital through a future sale.
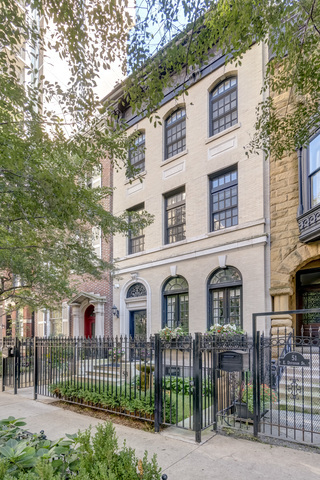
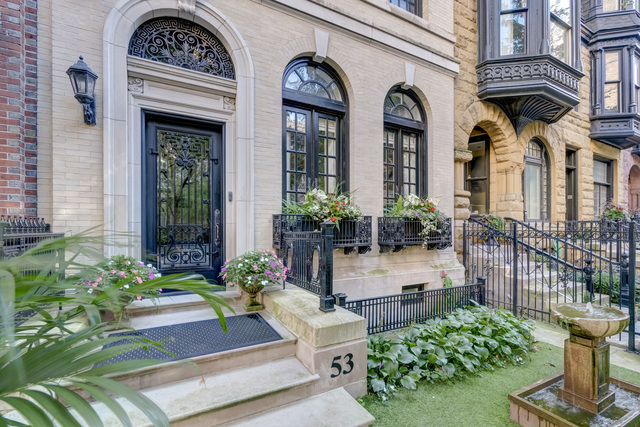
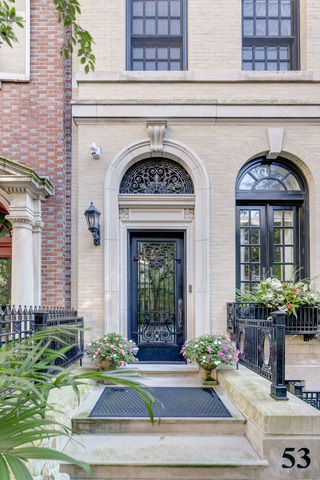
Property Description
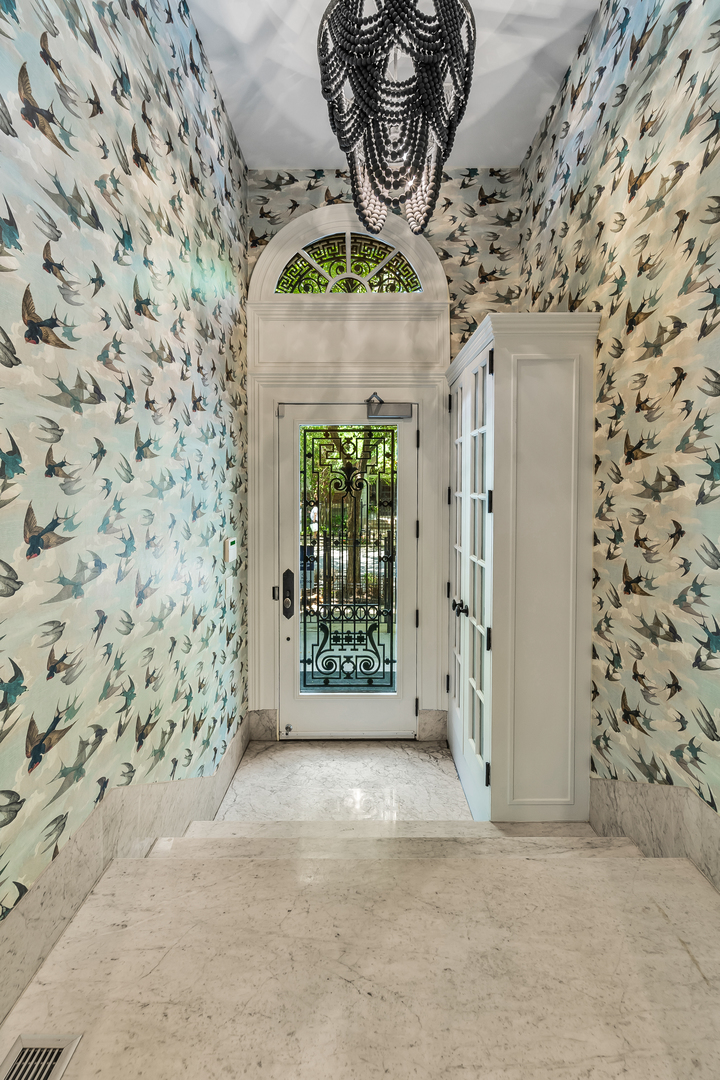
Classic in style and transitional in design, 53 E. Division St. is a 7,500-square-foot, 5 bed/9 bath luxury home in the heart of the Gold Coast with four private outdoor spaces and a rare attached garage. One of the only residential works by famed architect Jarvis Hunt, located steps from Oak Street Beach and moments from the Mag Mile, the renovated Beaux-Arts exterior is a masterpiece of ornate ironwork and limestone, accented by beautiful landscaping and a fountain. Inside, the main level begins with a foyer that teases the world-class finishes that can be found throughout, including moments of expertly preserved original marble and millwork details. The impressively spacious, open-concept living/dining room sets the stage for elevated entertaining, and features 12'-high ceilings, an extremely rare 20'-wide footprint for the Gold Coast, herringbone hardwood floors, French doors that open to Juliet balconies, and the first of three wood-burning fireplaces. The dining space flaunts beautiful built-ins and marble stairs that ascend into a handsome family room with coffered ceiling and a custom bar center. Most recently, this home's gorgeous chef's kitchen underwent a complete renovation courtesy of KitchenLab Interiors and features custom cabinetry, natural stone countertops, professional-grade appliances, a long island with dine-up seating, and character from a limestone fireplace and more French doors. Four distinctive, design-forward en-suite bedrooms are spread across the second and third levels, including one that's styled as a gorgeous owners' den, another that's designed as a light and bright home office with a custom wet bar, and one with a private patio (5'11" x 21'3"). The spectacularly spacious primary suite boasts arched windows, a sitting area, bespoke built-ins, a custom walk-in closet with styling and beverage stations, and a newly renovated marble bath with dual vanity, soaking tub, and a glass-encased shower. The top level is an indoor/outdoor entertainer's paradise, including two incredible rooftop spaces: one with a full professional-grade kitchen, dining and lounge spaces, and a fire table (22'4" x 26'5"); the other with a luxe, open-air spa (12'4" x 29'3"). Better still, the lower level features a temperature-controlled wine room, a large recreation/media room, the fifth en-suite bedroom (perfect for extended-stay guests or an au pair as it has its own entrance), and access to the home's fully finished, attached garage with a bonus refrigerator and wine fridge. Additional callout details include multiple half-baths, full-home automation via a Control4 system, state-of-the-art mechanicals including an all-floors elevator, designer wallcoverings and statement lighting throughout, an upstairs laundry room, a lower level mudroom, and abundant storage. Walking distance to world-class dining and shopping, top schools, and the Division Street Farmers' Market, 53 E. Division St. is turnkey luxury with the very best of Chicago right outside your front door.
Build Your Team
Quickly find investor-friendly professionals who can help you succeed in real estate investing at any stage of the investing journey.


Agents
Match with investor-friendly agents who can help you find, analyze, and close your next deal


Lenders
Get the best funding…find investor-friendly lenders who specialize in your deal strategy


Property Managers
Transition to passive investing. Find a trusted property management partnership that lasts.


Tax Pros & Accountants
Taxes and financial reporting made easy—find experts to create tax savings strategies, file taxes, and more
Location
Property Details
Parking
- Details: Garage Door Opener, Heated Garage, On Site, Attached, Garage
- Garage Spaces: 2
- Spaces Total: 2
Bedroom Information
- # of Bedrooms: 5
Bathroom Information
- # of Baths (Full): 5
- # of Baths (Partial): 2
- # of Baths (Total): 9.0
Interior Features
- # of Rooms: 12
- # of Stories: 3
- Basement: Yes
- Basement Description: Sump Pump, Finished, Full, Daylight
- Fireplace: Yes
Exterior Features
- Exterior Walls Materials: Masonry
- Foundation: Stone
- Roof Material: Rubber
Land Information
- Land Use: Residential
- Land Use Subtype: Single Family Residential
Lot Information
- Parcel ID: 1703200025
- Lot Size: 0 sqft
Property Information
- Property Type: Single Family Residence
- Style: Georgian
- Year Built: 1910
Tax Information
- Annual Tax: $70,183
Utilities
- Heating: Natural Gas, Forced Air, Radiant, Zoned, Radiant Floor
- Cooling: Central Air, Zoned
Location
- County: Cook
Listing Details
Investment Summary
- Monthly Cash Flow
- -$18,632
- Cap Rate
- 0.1%
- Cash-on-Cash Return
- -24.3%
- Debt Coverage Ratio
- 0.02
- Internal Rate of Return (5 years)
- -19.4%
Cash Flow
Net Operating Income (NOI) minus mortgage payments.
Calculation:
NOI - Mortgage Payments
Cap Rate (Market Value)
Capitalization Rate is a rate of return that compares the yearly Net Operating Income (NOI) to the market value.
Calculation:
NOI / Market Value
Cash-on-Cash Return (CoC)
Annual Cash Flow / Cash Invested
Calculation:
Annual cash flow divided by initial cash invested.
Debt Coverage Ratio (DCR)
Net Operating Income (NOI) divided by total debt payments.
Calculation:
NOI / Total Debt Payments
Internal Rate of Return (IRR)
A metric for assessing profitability over time. IRR is the discount rate at which the net present value (NPV) of all future cash flows (positive and negative) from an investment equals zero — including both periodic cash flow (such as rent) and a projected sale at the end of the holding period. It represents the expected annualized return, accounting for income, expenses, and the recovery of capital through a future sale.
Purchase Details
Purchase PriceThe price paid for the property. Purchase price:
| $3,999,000 |
|---|---|
Amount FinancedThe amount of the purchase financed through a loan. Amount financed:
| -$3,199,200 |
Down paymentThe initial payment made towards the purchase. Down payment:
| $799,800 |
Closing CostsFees and expenses associated with purchasing a property, typically ranging from 2% to 5% of the home’s purchase price, paid at the end of a home purchase to cover services like lending, title transfer, and taxes. Closing costs:
| $119,970 |
Rehab CostsCosts incurred to repair or improve the property, including: roof, flooring, exterior siding, kitchen, exterior paint, bathrooms, etc. Rehab costs:
| $0 |
Initial Cash InvestedThe total initial cash invested in the property. Calculation:Down payment + Buying costs + Rehab costs Initial cash invested:
| $919,770 |
Square Feet (SQFT)The total square footage of the property. Square feet:
| 7,500 |
Cost Per Square FootCost per square foot of the property. Calculation:Purchase Price / Square Feet Cost per square foot:
| $533 |
Monthly Rent Per Square FootMonthly rent divided by the number of square feet. This ratio helps investors compare rental income efficiency across properties, markets, and unit sizes Calculation:Monthly Rent / Square Feet Monthly rent per square foot:
| $1.19 |
Financing Details
Loan AmountThe total sum of money borrowed from a lender to finance a property purchase. Calculation:Purchase Price - Down Payment
Loan amount:
| $3,199,200 |
|---|---|
Loan to Value Ratio (LTV)Loan amount divided by the market value of the property. Calculation:Loan Amount / Market Value
Loan to value ratio:
| 80.0% |
Loan TypeThe type of loan (e.g., fixed, adjustable).
Loan type:
| Amortizing |
TermThe loan repayment period in years.
Term:
| 30 years |
Interest RateThe percentage a lender charges on the borrowed amount of a loan, determining the cost of borrowing money.
Interest rate:
| 5.875% |
Principal & Interest (PI)The principal is the portion of the loan payment that reduces the loan balance. The interest is the lender's charge for borrowing money. Calculation:(P * r * (1 + r) ** n) / ((1 + r) ** n - 1) Where:
P = Loan amount (principal)
Principal & interest:
| $18,924 |
Property TaxesAnnual taxes levied by local governments on real estate properties. These taxes fund public services like schools, roads, and emergency services.
Property tax:
| $5,849 |
InsuranceThe costs for insurance coverage to protect against financial losses due to risks like fire, natural disasters, theft, liability, or tenant-related damages. Calculation:Assumes 7% of gross rental income, unless insurance rates are specified.
Insurance:
| $623 |
Private Mortgage Insurance (PMI)A fee that borrowers pay when they take out a conventional loan with a loan-to-value (LTV) ratio above 80%.
Private mortgage insurance (PMI):
| $0 |
Monthly PaymentThe fixed amount a borrower pays each month to repay a loan. It typically includes principal and interest (P&I) and may also cover property taxes, insurance, HOA fees, and PMI if escrowed. Monthly payment:
| $25,396 |
Operating Income
| % Rent | Monthly | Yearly | |
|---|---|---|---|
Gross RentThe total rental income received from tenants before deducting any expenses. Includes base rent, late fees, pet fees, parking fees, and other recurring charges.
Gross rent:
| $8,900 | $106,800 | |
Vacancy LossExpected loss of rent due to vacancies.
Vacancy loss:
(6%)
| 6% | -$534 | -$6,408 |
Operating IncomeGross rental income minus vacancy loss. Calculation:Gross rent - Vacancy loss
Operating income:
| $8,366 | $100,392 |
Operating Expenses
| % Rent | Monthly | Yearly | |
|---|---|---|---|
Property TaxesAnnual taxes levied by local governments on real estate properties. These taxes fund public services like schools, roads, and emergency services. | 66% | -$5,849 | -$70,184 |
InsuranceThe costs for insurance coverage to protect against financial losses due to risks like fire, natural disasters, theft, liability, or tenant-related damages. Calculation:Assumes 7% of gross rental income, unless insurance rates are specified. | 7% | -$623 | -$7,476 |
Property ManagementThe costs associated with hiring a property manager to handle the day-to-day operations of a rental property. Includes management fees, leasing fes, eviction fees, etc. Calculation:Assumes 8% of gross rental income. | 8% | -$712 | -$8,544 |
Repairs & MaintenanceOngoing costs for routine upkeep and minor fixes needed to keep a property in good working condition. Calculation:Assumes 5% of gross rental income. Varies by property age and condition. | 5% | -$445 | -$5,340 |
Capital ExpensesLarge, infrequent costs for major improvements or replacements, like a new roof, HVAC system, or appliances. Calculation:Assumes 5% of gross rental income. Varies by property age. | 5% | -$445 | -$5,340 |
HOA FeesRegular dues paid to a Homeowners Association for community maintenance, amenities, and management. Similar fees include: Condo Association Fees, Co-op Maintenance Fees, etc. | n/a | n/a | n/a |
Operating ExpensesRecurring costs required to maintain and manage a rental property, including property taxes, insurance, maintenance, repairs, utilities (if paid by the owner), property management fees, and other day-to-day expenses. Calculation:Insurance + Property Taxes + Property Management + Repairs & Maintenance + Capital Expenditures + HOA Fees | 91% | -$8,074 | -$96,884 |
Cash Flow
| Monthly | Yearly | |
|---|---|---|
Net Operating Income (NOI)The income generated from a property after deducting all operating expenses but before deducting mortgage payments, taxes, and capital expenditures. Calculation:Gross Operating Income - Operating Expenses
Net operating income:
| $292 | $3,504 |
Mortgage PaymentThe fixed amount a borrower pays each month to repay a loan. It typically includes principal and interest (P&I) and may also cover property taxes, insurance, HOA fees, and PMI if escrowed. | -$18,924 | -$227,088 |
Cash FlowNet Operating Income (NOI) minus mortgage payments. Calculation:NOI - Mortgage Payments | $18,632 | $223,584 |