Chicago, IL Investment Properties for Sale
Browse homes for sale and investment properties in Chicago, IL. Refine your search by price, property type, or more.
Best cash flowing properties in Chicago, IL
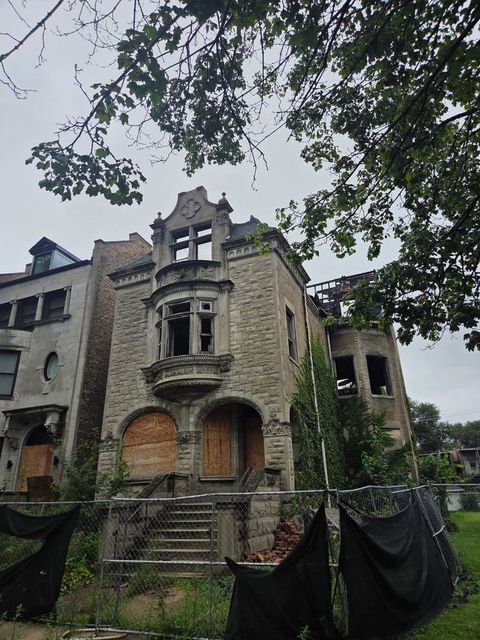
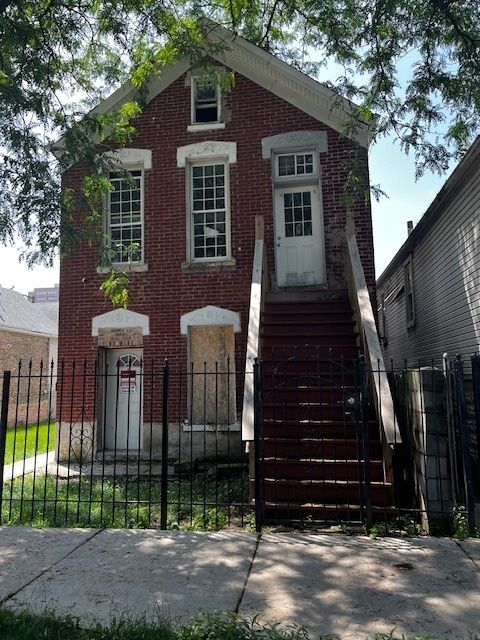
Active
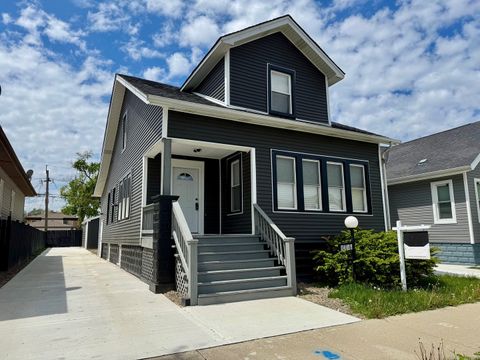
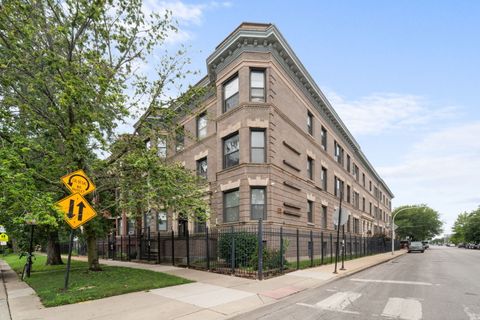
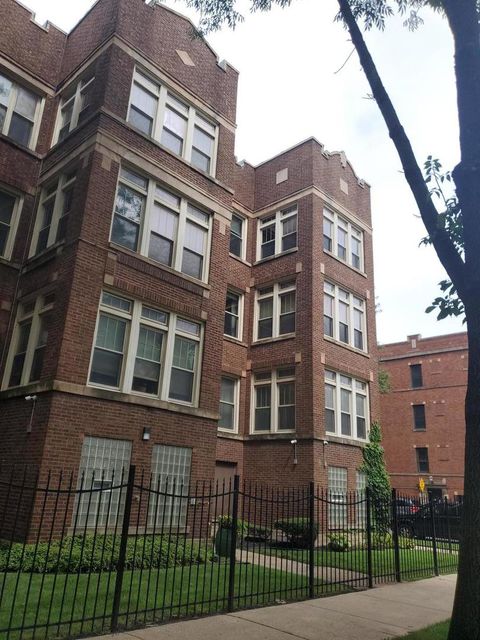
$369,000
6
bds
|
4
ba
|
6,234
sqft
|
built
1886
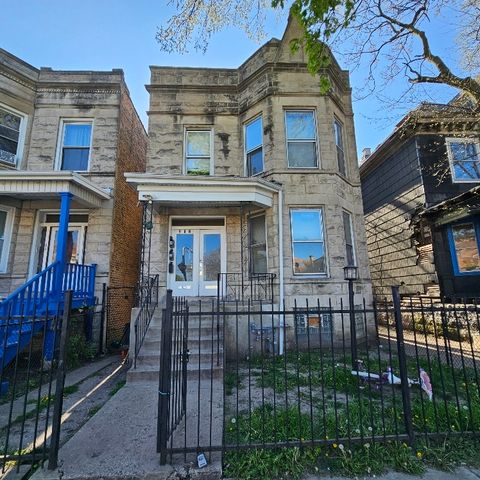
4550 S Michigan Ave, Chicago, IL 60653
$1,704
Cash flow
24.1%
Cash-on-Cash Return
11.2%
Cap rate
1.4%
Rent to Value Ratio
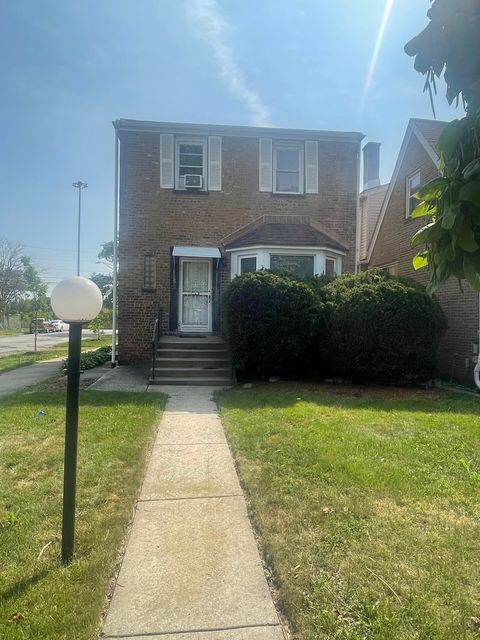
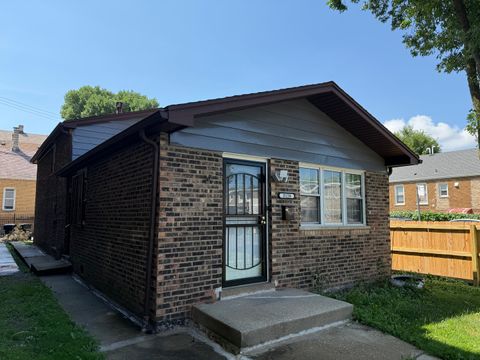
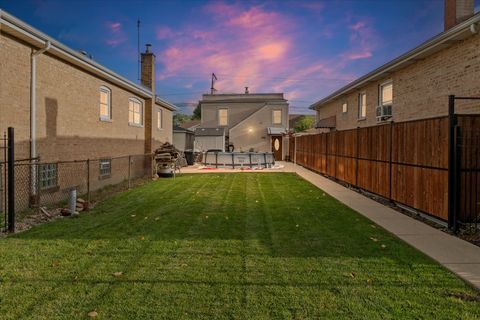
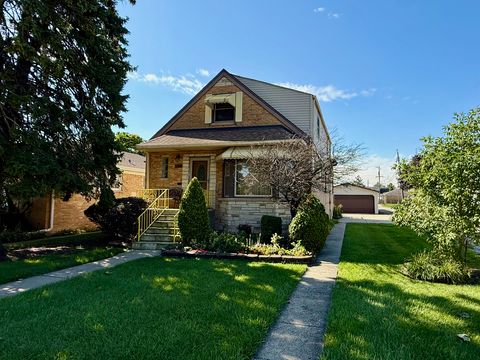
Active
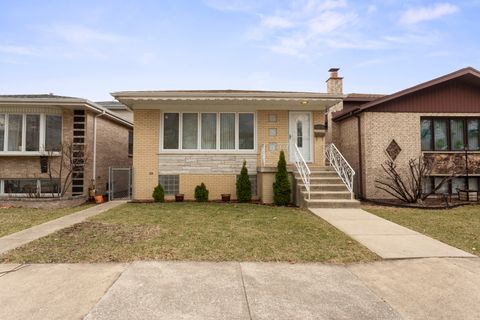
$159,900
2
bds
|
2
ba
|
1,217
sqft
|
built
1953
9601 S Perry Ave, Chicago, IL 60628
$696
Cash flow
22.7%
Cash-on-Cash Return
10.9%
Cap rate
1.4%
Rent to Value Ratio
3,721 out of 4,408 properties for sale in Chicago, IL
Limited Results Shown
Create a free account, or log in to reveal all property listings and enjoy the complete experience.
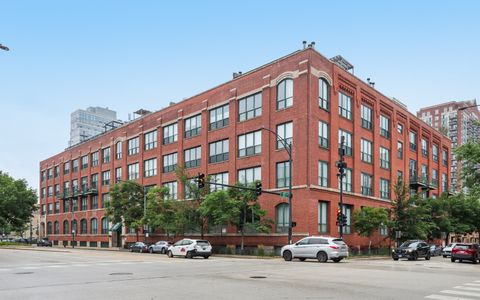
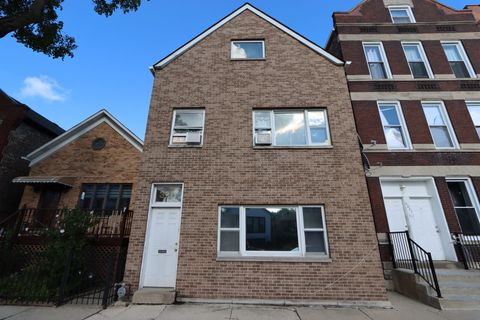
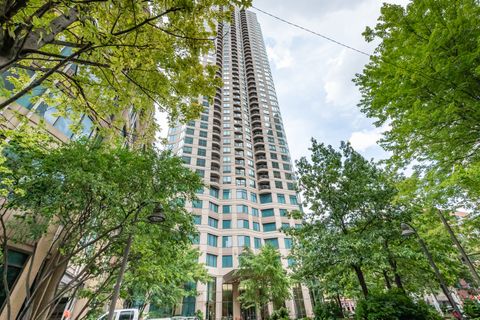
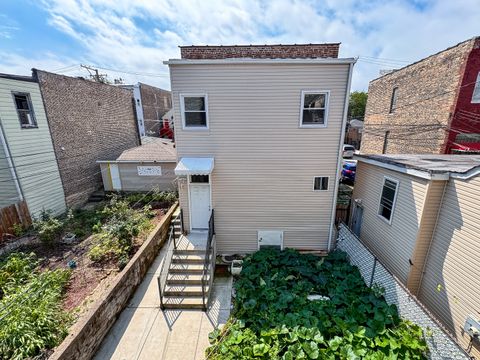
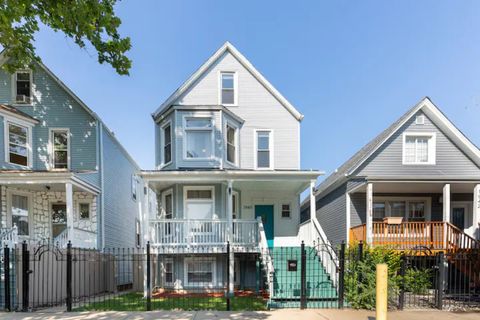
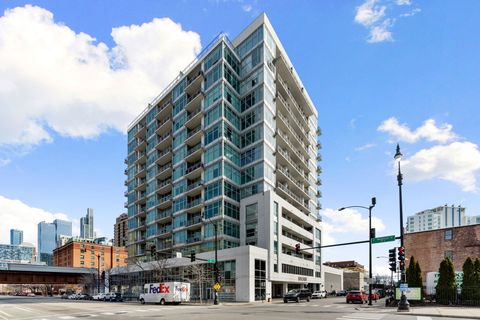
Active
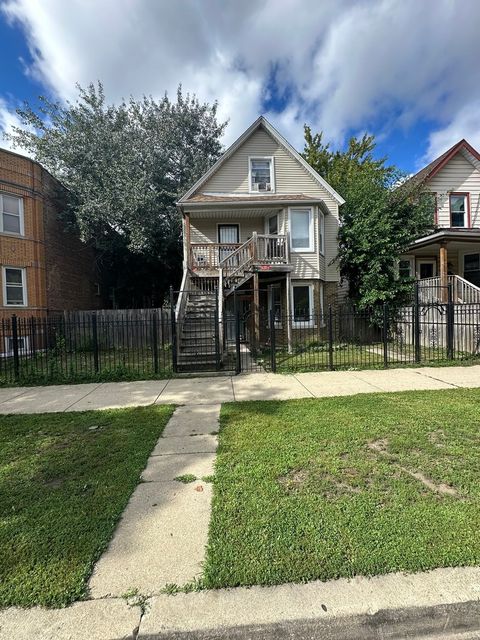
$399,000
2
bds
|
1
ba
|
1,176
sqft
|
built
1905
1727 S Indiana Ave, Chicago, IL 60616
$-907
Cash flow
-11.9%
Cash-on-Cash Return
3.0%
Cap rate
0.7%
Rent to Value Ratio
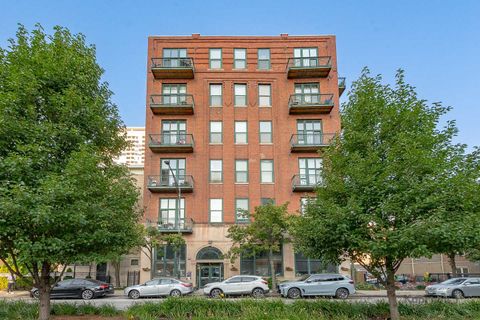
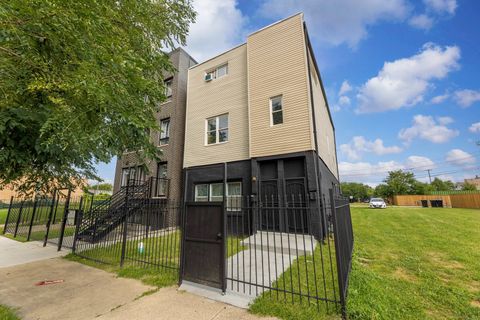
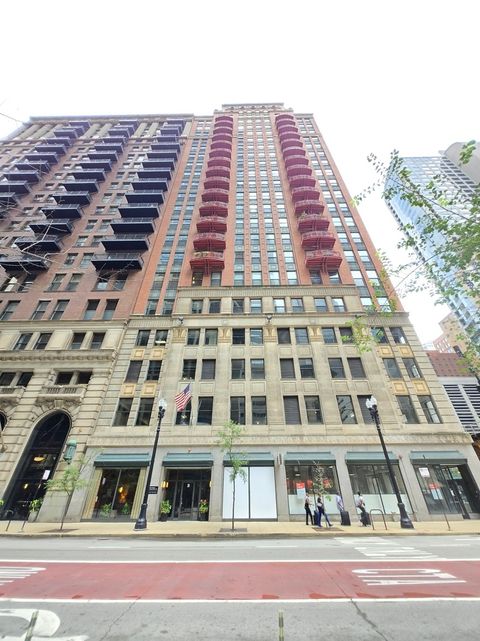
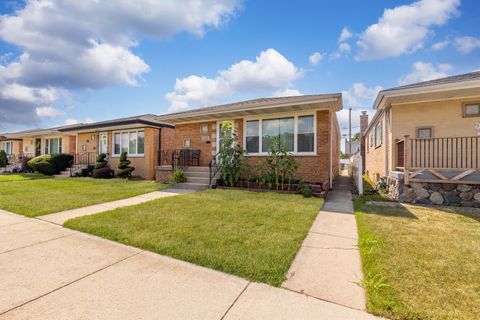
Active
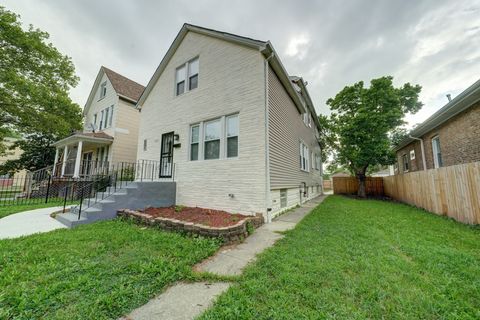
$329,995
1
bds
|
2
ba
|
1,100
sqft
|
built
1905
1632 S Indiana Ave, Chicago, IL 60616
$-700
Cash flow
-11.1%
Cash-on-Cash Return
3.1%
Cap rate
0.8%
Rent to Value Ratio
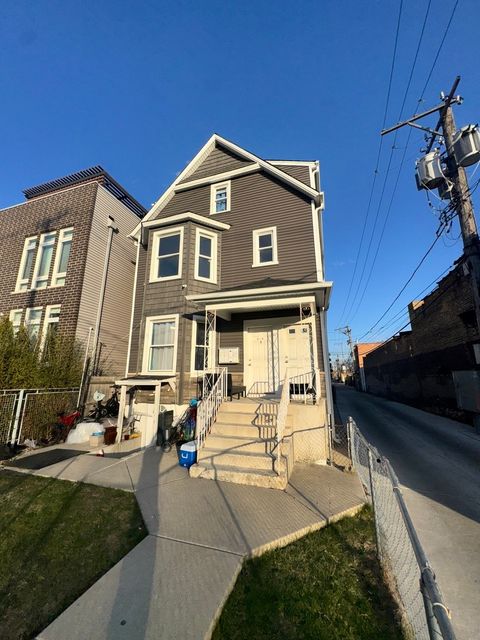
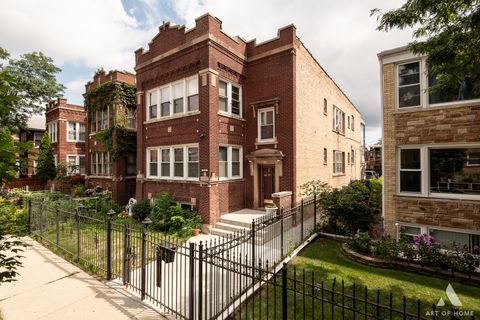
Active
$1,350,000
3
bds
|
5
ba
|
3,400
sqft
|
built
1890
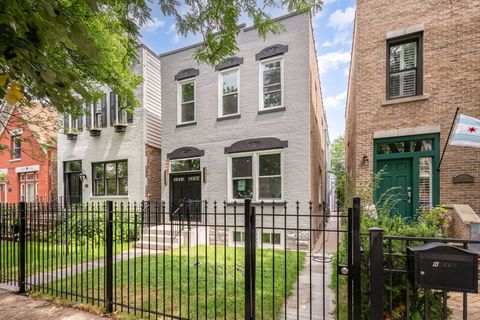
1433 N Oakley Blvd, Chicago, IL 60622
$-5,545
Cash flow
-21.4%
Cash-on-Cash Return
0.8%
Cap rate
0.2%
Rent to Value Ratio
Active
$415,000
2
bds
|
2
ba
|
1,205
sqft
|
built
2006
1841 S Calumet Ave, Chicago, IL 60616
$-1,918
Cash flow
-24.1%
Cash-on-Cash Return
0.1%
Cap rate
0.7%
Rent to Value Ratio
Active
$1,190,000
3
bds
|
3
ba
|
2,470
sqft
|
built
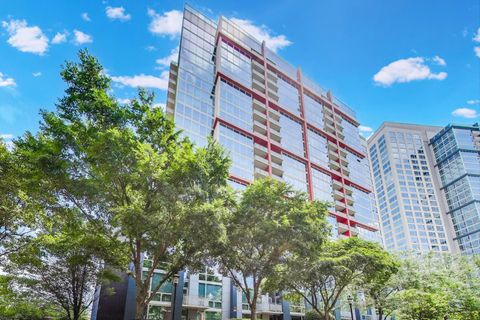
1997
1301 N Dearborn St, Chicago, IL 60610
$-4,995
Cash flow
-21.9%
Cash-on-Cash Return
0.6%
Cap rate
0.5%
Rent to Value Ratio
Active
$199,900
5
bds
|
2
ba
|
0
sqft
|
built
1898
212 N Leamington Ave, Chicago, IL 60644
$480
Cash flow
12.5%
Cash-on-Cash Return
8.6%
Cap rate
1.3%
Rent to Value Ratio
Active
$370,000
3
bds
|
2
ba
|
2,084
sqft
|
built
1957
3441 W 59th St, Chicago, IL 60629
$-303
Cash flow
-4.3%
Cash-on-Cash Return
4.7%
Cap rate
0.7%
Rent to Value Ratio
Active
$1,250,000
4
bds
|
4
ba
|
4,000
sqft
|
built
1929
707 W Junior Ter, Chicago, IL 60613
$-6,409
Cash flow
-26.8%
Cash-on-Cash Return
-0.5%
Cap rate
0.4%
Rent to Value Ratio
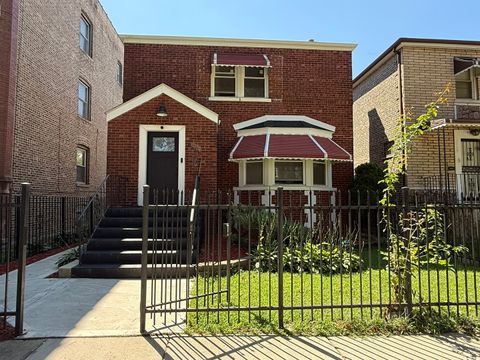
Active
$599,000
6
bds
|
3
ba
|
0
sqft
|
built
1888
3217 S May St, Chicago, IL 60608
$-1,690
Cash flow
-14.7%
Cash-on-Cash Return
2.3%
Cap rate
0.4%
Rent to Value Ratio
Active
$485,000
3
bds
|
2
ba
|
1,412
sqft
|
built
1972
3128 S Lituanica Ave, Chicago, IL 60608
$-1,165
Cash flow
-12.5%
Cash-on-Cash Return
2.8%
Cap rate
0.5%
Rent to Value Ratio
Active
$329,800
4
bds
|
3
ba
|
2,888
sqft
|
built
1927
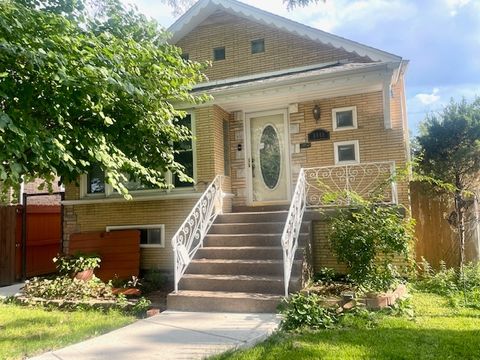
10016 S Yale Ave, Chicago, IL 60628
$-334
Cash flow
-5.3%
Cash-on-Cash Return
4.5%
Cap rate
0.5%
Rent to Value Ratio
Active
$299,000
7
bds
|
3
ba
|
0
sqft
|
built
1898
4224 W Thomas St, Chicago, IL 60651
$-230
Cash flow
-4.0%
Cash-on-Cash Return
4.8%
Cap rate
0.7%
Rent to Value Ratio
Active
$559,900
3
bds
|
3
ba
|
2,400
sqft
|
built
1973
4567 N Merrimac Ave, Chicago, IL 60630
$-882
Cash flow
-8.2%
Cash-on-Cash Return
3.8%
Cap rate
0.6%
Rent to Value Ratio
Active
$425,000
8
bds
|
3
ba
|
0
sqft
|
built
1926
9107 S Dobson Ave, Chicago, IL 60619
$-765
Cash flow
-9.4%
Cash-on-Cash Return
3.5%
Cap rate
0.5%
Rent to Value Ratio
Active
$219,000
2
bds
|
1
ba
|
0
sqft
|
built
1910
6100 S Ingleside Ave, Chicago, IL 60637
$-154
Cash flow
-3.7%
Cash-on-Cash Return
4.8%
Cap rate
1.1%
Rent to Value Ratio
Active
$289,000
4
bds
|
2
ba
|
1,368
sqft
|
built
1913
3711 W 56th Pl, Chicago, IL 60629
$-99
Cash flow
-1.8%
Cash-on-Cash Return
5.3%
Cap rate
0.8%
Rent to Value Ratio
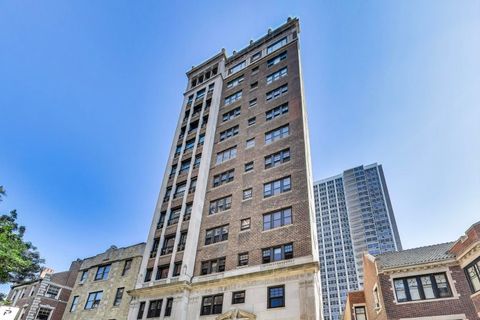
Active
$299,000
1
bds
|
1
ba
|
723
sqft
|
built
2010
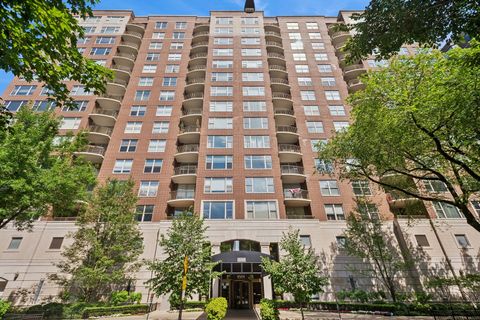
400 N La Salle Dr, Chicago, IL 60654
$-713
Cash flow
-12.4%
Cash-on-Cash Return
2.8%
Cap rate
0.8%
Rent to Value Ratio
Active
$650,000
6
bds
|
3
ba
|
0
sqft
|
built
1880
2526 W Monroe St, Chicago, IL 60612
$-1,986
Cash flow
-15.9%
Cash-on-Cash Return
2.0%
Cap rate
0.4%
Rent to Value Ratio
Active
$179,000
bds
|
1
ba
|
0
sqft
|
built
1980
899 S Plymouth Ct, Chicago, IL 60605
$-484
Cash flow
-14.1%
Cash-on-Cash Return
2.4%
Cap rate
0.9%
Rent to Value Ratio
Active
$139,900
4
bds
|
3
ba
|
0
sqft
|
built
1904
133 W 110th St, Chicago, IL 60628
$518
Cash flow
19.3%
Cash-on-Cash Return
10.1%
Cap rate
1.3%
Rent to Value Ratio
Active
$549,800
3
bds
|
2
ba
|
2,400
sqft
|
built
1883
3028 S Union Ave, Chicago, IL 60616
$-852
Cash flow
-8.1%
Cash-on-Cash Return
3.8%
Cap rate
0.5%
Rent to Value Ratio
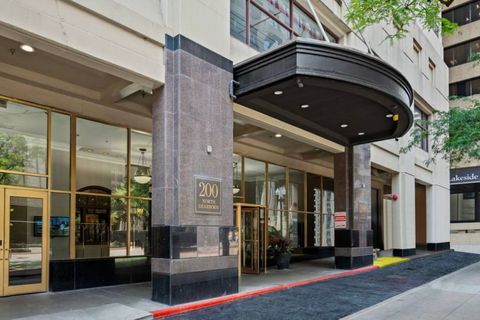
Active
$235,000
1
bds
|
1
ba
|
770
sqft
|
built
1989
200 N Dearborn St, Chicago, IL 60601
$-772
Cash flow
-17.1%
Cash-on-Cash Return
1.7%
Cap rate
0.8%
Rent to Value Ratio
Active
$90,000
3
bds
|
2
ba
|
1,200
sqft
|
built
1924
2234 E 70th Pl, Chicago, IL 60649
$581
Cash flow
33.7%
Cash-on-Cash Return
13.4%
Cap rate
1.8%
Rent to Value Ratio
Active
$850,000
3
bds
|
1
ba
|
0
sqft
|
built
1889
235 W 23rd St, Chicago, IL 60616
$-2,748
Cash flow
-16.9%
Cash-on-Cash Return
1.8%
Cap rate
0.3%
Rent to Value Ratio
Active
$365,000
2
bds
|
2
ba
|
1,380
sqft
|
built
1927
208 W Washington St, Chicago, IL 60606
$-1,434
Cash flow
-20.5%
Cash-on-Cash Return
1.0%
Cap rate
0.9%
Rent to Value Ratio
Active
$750,000
9
bds
|
4
ba
|
0
sqft
|
built
1908
5015 N Kimberly Ave, Chicago, IL 60630
$-2,113
Cash flow
-14.7%
Cash-on-Cash Return
2.3%
Cap rate
0.4%
Rent to Value Ratio
Active
$350,000
bds
|
0
ba
|
0
sqft
|
built
1880
2911 W 25th St, Chicago, IL 60623
$-610
Cash flow
-9.1%
Cash-on-Cash Return
3.6%
Cap rate
0.6%
Rent to Value Ratio
Active
$525,000
3
bds
|
2
ba
|
2,192
sqft
|
built
1955
7425 W Devon Ave, Chicago, IL 60631
$-933
Cash flow
-9.3%
Cash-on-Cash Return
3.5%
Cap rate
0.6%
Rent to Value Ratio

Active
$275,000
3
bds
|
2
ba
|
1,400
sqft
|
built
1912
1520 E Marquette Rd, Chicago, IL 60637
$-235
Cash flow
-4.5%
Cash-on-Cash Return
4.7%
Cap rate
0.8%
Rent to Value Ratio
Active
$830,000
8
bds
|
4
ba
|
0
sqft
|
built
1912
1940 N Monticello Ave, Chicago, IL 60647
$-2,178
Cash flow
-13.7%
Cash-on-Cash Return
2.5%
Cap rate
0.4%
Rent to Value Ratio
Active
$305,000
3
bds
|
2
ba
|
2,024
sqft
|
built
1965
11010 S Avenue F, Chicago, IL 60617
$94
Cash flow
1.6%
Cash-on-Cash Return
6.0%
Cap rate
0.8%
Rent to Value Ratio
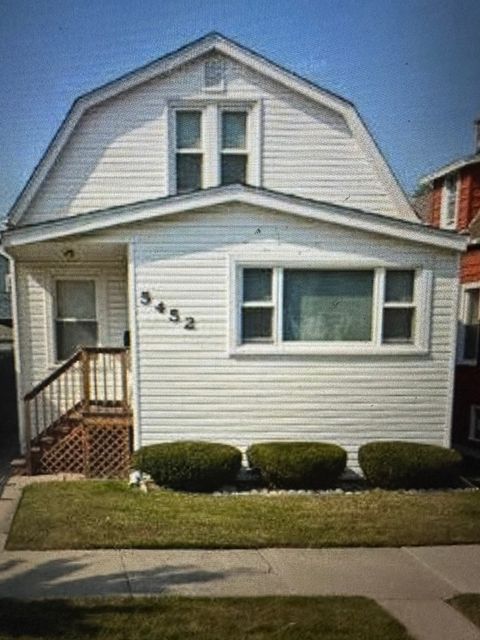
Active
$395,000
3
bds
|
1
ba
|
1,056
sqft
|
built
1918
5452 W Warwick Ave, Chicago, IL 60641
$-342
Cash flow
-4.5%
Cash-on-Cash Return
4.6%
Cap rate
0.7%
Rent to Value Ratio
Active
$624,900
9
bds
|
5
ba
|
0
sqft
|
built
1923
3105 N Keating Ave, Chicago, IL 60641
$-1,873
Cash flow
-15.6%
Cash-on-Cash Return
2.1%
Cap rate
0.4%
Rent to Value Ratio
Active
$295,000
2
bds
|
3
ba
|
2,005
sqft
|
built
1948
1719 E 86th St, Chicago, IL 60617
$176
Cash flow
3.1%
Cash-on-Cash Return
6.4%
Cap rate
0.8%
Rent to Value Ratio
Active
$799,999
3
bds
|
2
ba
|
0
sqft
|
built
2008
50 E 16th St, Chicago, IL 60616
$-1,570
Cash flow
-10.2%
Cash-on-Cash Return
3.3%
Cap rate
0.8%
Rent to Value Ratio
Active
$255,900
2
bds
|
1
ba
|
972
sqft
|
built
1947
11353 S Ewing Ave, Chicago, IL 60617
$-145
Cash flow
-3.0%
Cash-on-Cash Return
5.0%
Cap rate
0.7%
Rent to Value Ratio
Active
$348,000
2
bds
|
2
ba
|
1,260
sqft
|
built
1963
247 E Chestnut St, Chicago, IL 60611
$-989
Cash flow
-14.8%
Cash-on-Cash Return
2.3%
Cap rate
1.0%
Rent to Value Ratio
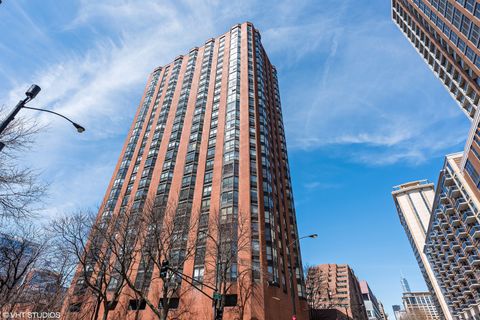
Active
$290,000
1
bds
|
1
ba
|
0
sqft
|
built
1969
2800 N Lake Shore Dr, Chicago, IL 60657
$-378
Cash flow
-6.8%
Cash-on-Cash Return
4.1%
Cap rate
1.0%
Rent to Value Ratio