Milwaukee, WI Investment Properties for Sale
Browse homes for sale and investment properties in Milwaukee, WI. Refine your search by price, property type, or more.
Best cash flowing properties in Milwaukee, WI
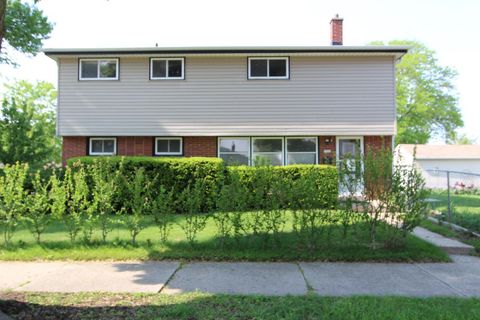
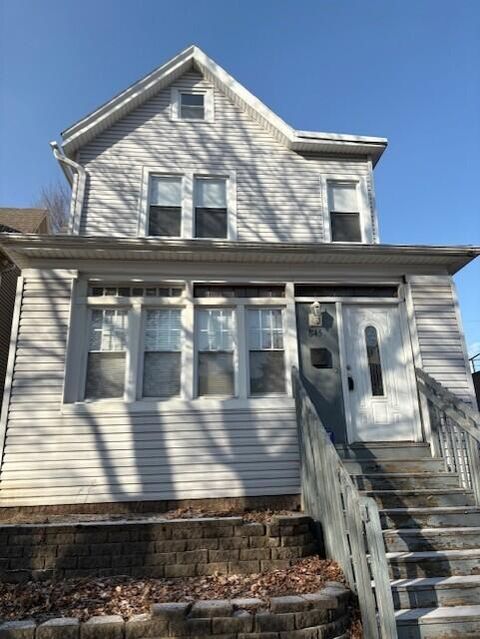
Active
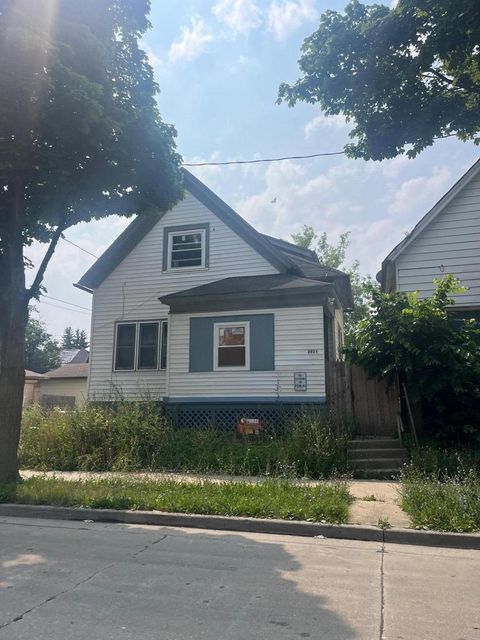
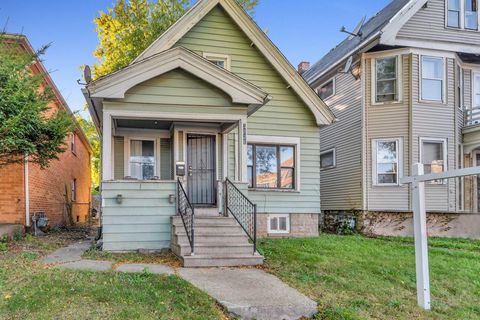
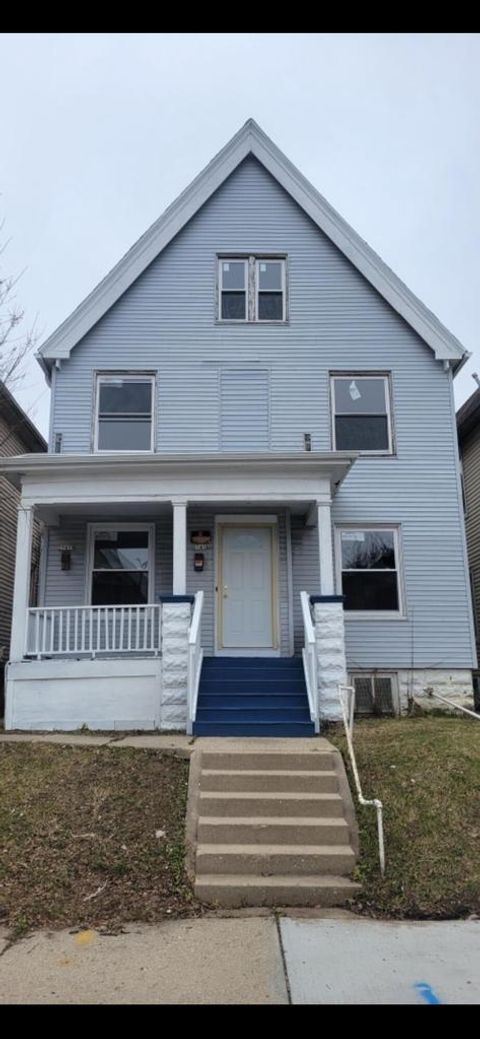
$49,900
3
bds
|
1
ba
|
1,166
sqft
|
built
1893
2021 W Hadley St, Milwaukee, WI 53206
$727
Cash flow
17.0%
Cash-on-Cash Return
17.5%
Cap rate
2.2%
Rent to Value Ratio
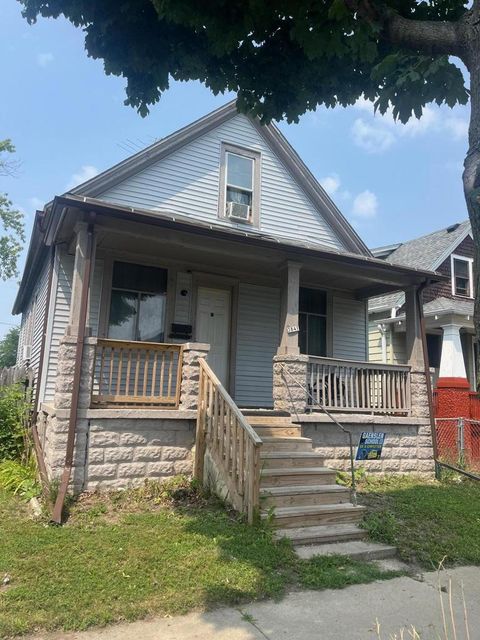
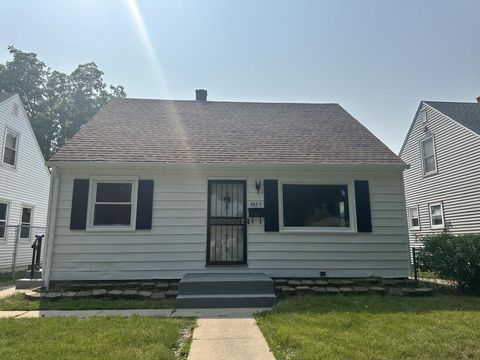
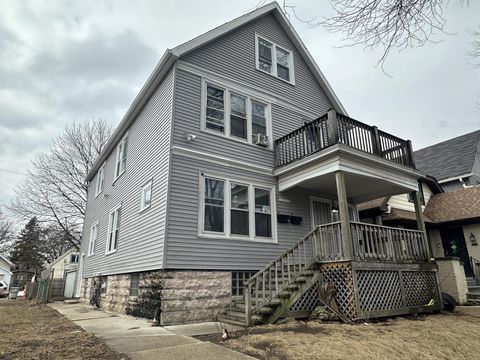
Active
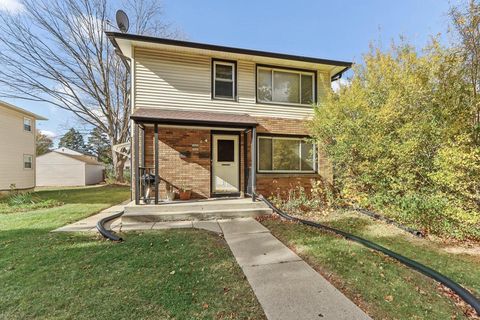
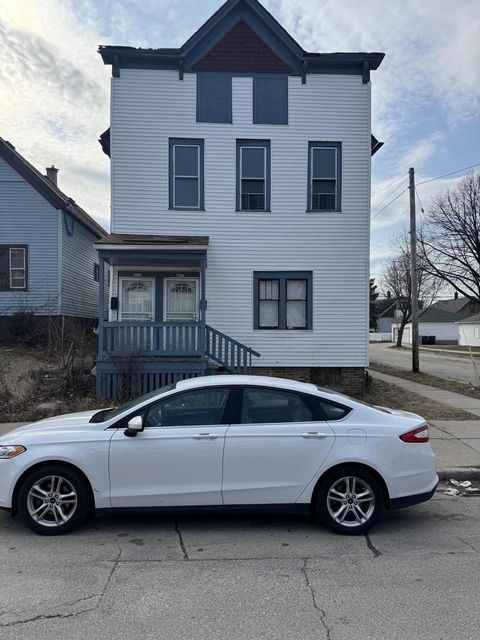
$49,900
2
bds
|
1
ba
|
792
sqft
|
built
1900
3841 N 19th Pl, Milwaukee, WI 53206
$687
Cash flow
16.0%
Cash-on-Cash Return
16.5%
Cap rate
2.2%
Rent to Value Ratio
274 out of 866 properties for sale in Milwaukee, WI
Limited Results Shown
Create a free account, or log in to reveal all property listings and enjoy the complete experience.

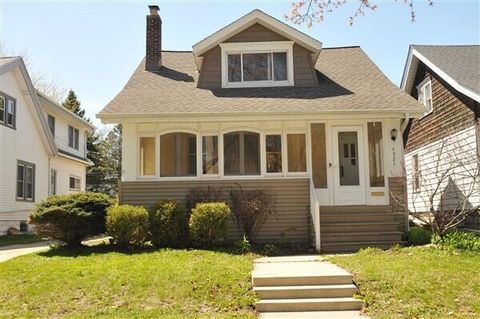
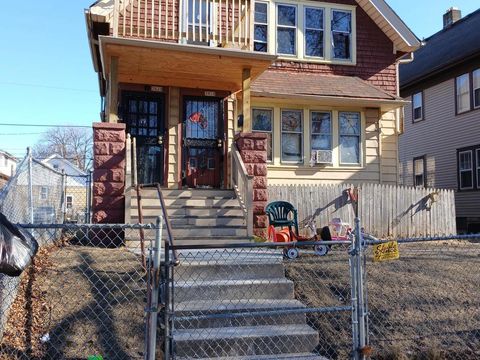
Active
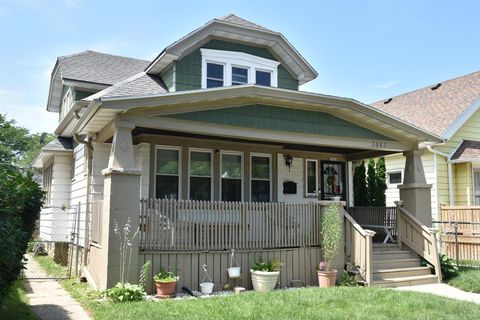
$178,900
3
bds
|
0
ba
|
1,306
sqft
|
built
1922
3625 N 19th St, Milwaukee, WI 53206
$-68
Cash flow
-2.0%
Cash-on-Cash Return
5.7%
Cap rate
0.8%
Rent to Value Ratio
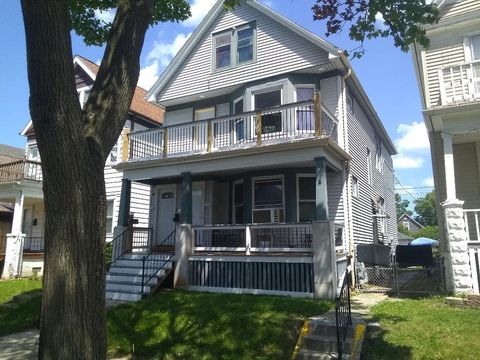
Active
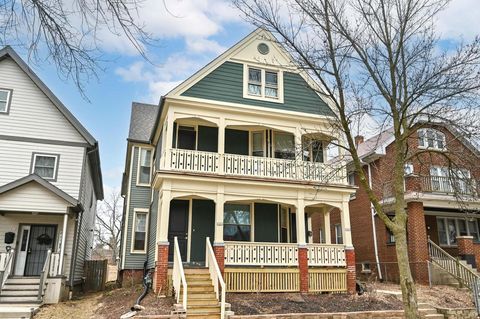
$534,900
4
bds
|
3
ba
|
1,614
sqft
|
built
1920
4321 N Murray Ave, Milwaukee, WI 53211
$-2,285
Cash flow
-22.3%
Cash-on-Cash Return
1.0%
Cap rate
0.4%
Rent to Value Ratio
Active
$369,900
4
bds
|
0
ba
|
1,800
sqft
|
built
1928
3044 S 9th Pl, Milwaukee, WI 53215
$-1,433
Cash flow
-20.2%
Cash-on-Cash Return
1.5%
Cap rate
0.3%
Rent to Value Ratio

Active
$434,900
3
bds
|
3
ba
|
2,466
sqft
|
built
1994
6241 N 118th St, Milwaukee, WI 53225
$-1,125
Cash flow
-13.5%
Cash-on-Cash Return
3.0%
Cap rate
0.6%
Rent to Value Ratio
Active
$325,000
5
bds
|
2
ba
|
1,947
sqft
|
built
1954
5326 W Crawford Ave, Milwaukee, WI 53220
$-761
Cash flow
-12.2%
Cash-on-Cash Return
3.3%
Cap rate
0.6%
Rent to Value Ratio
Active
$240,000
4
bds
|
2
ba
|
1,393
sqft
|
built
1955
4837 N 90th St, Milwaukee, WI 53225
$-293
Cash flow
-6.4%
Cash-on-Cash Return
4.7%
Cap rate
0.7%
Rent to Value Ratio
Active
$129,900
4
bds
|
1
ba
|
1,981
sqft
|
built
1924
3918 N 24th St, Milwaukee, WI 53206
$-108
Cash flow
-4.3%
Cash-on-Cash Return
5.1%
Cap rate
0.8%
Rent to Value Ratio
Active
$179,000
4
bds
|
1
ba
|
2,352
sqft
|
built
1955
2740 N 60th St, Milwaukee, WI 53210
$-547
Cash flow
-15.9%
Cash-on-Cash Return
2.5%
Cap rate
0.5%
Rent to Value Ratio
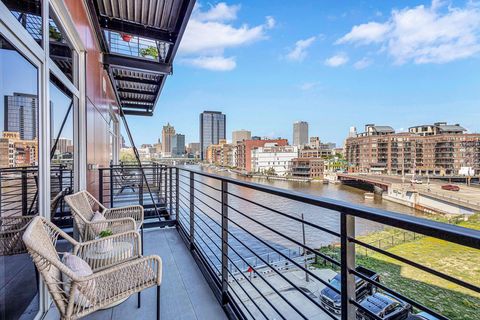
Active
$299,000
1
bds
|
1
ba
|
678
sqft
|
built
2006
106 W Seeboth St, Milwaukee, WI 53204
$-1,456
Cash flow
-25.4%
Cash-on-Cash Return
0.3%
Cap rate
0.5%
Rent to Value Ratio
Active
$119,000
3
bds
|
1
ba
|
1,270
sqft
|
built
1893
3124 N 29th St, Milwaukee, WI 53216
$29
Cash flow
1.3%
Cash-on-Cash Return
6.4%
Cap rate
0.9%
Rent to Value Ratio
Active
$90,000
3
bds
|
1
ba
|
892
sqft
|
built
1924
4715 N 39th St, Milwaukee, WI 53209
$222
Cash flow
12.9%
Cash-on-Cash Return
9.1%
Cap rate
1.3%
Rent to Value Ratio
Active
$225,000
4
bds
|
2
ba
|
1,846
sqft
|
built
1960
8761 W Herbert Ave, Milwaukee, WI 53225
$-708
Cash flow
-16.4%
Cash-on-Cash Return
2.4%
Cap rate
0.5%
Rent to Value Ratio
Active
$85,000
3
bds
|
0
ba
|
1,174
sqft
|
built
1915
3221 N 38th St, Milwaukee, WI 53216
$250
Cash flow
15.3%
Cash-on-Cash Return
9.7%
Cap rate
1.4%
Rent to Value Ratio

Active
$187,750
6
bds
|
0
ba
|
2,833
sqft
|
built
1950
1439 N 39th St, Milwaukee, WI 53208
$-264
Cash flow
-7.3%
Cash-on-Cash Return
4.5%
Cap rate
0.7%
Rent to Value Ratio

Active
$113,900
2
bds
|
1
ba
|
672
sqft
|
built
1954
5718 N 62nd St, Milwaukee, WI 53218
$-77
Cash flow
-3.5%
Cash-on-Cash Return
5.3%
Cap rate
0.8%
Rent to Value Ratio
Active
$193,000
6
bds
|
1
ba
|
1,840
sqft
|
built
1953
5323 N 27th St, Milwaukee, WI 53209
$-487
Cash flow
-13.2%
Cash-on-Cash Return
3.1%
Cap rate
0.6%
Rent to Value Ratio

Active
$307,500
3
bds
|
1
ba
|
2,786
sqft
|
built
1927
2519 N 60th St, Milwaukee, WI 53210
$-828
Cash flow
-14.0%
Cash-on-Cash Return
2.9%
Cap rate
0.5%
Rent to Value Ratio

Active
$122,900
1
bds
|
0
ba
|
751
sqft
|
built
1980
3239 S 58th St, Milwaukee, WI 53219
$-158
Cash flow
-6.7%
Cash-on-Cash Return
4.6%
Cap rate
0.7%
Rent to Value Ratio
Active
$130,000
2
bds
|
1
ba
|
1,110
sqft
|
built
1925
3843 N 25th St, Milwaukee, WI 53206
$108
Cash flow
4.3%
Cash-on-Cash Return
7.1%
Cap rate
1.0%
Rent to Value Ratio

Active
$377,000
1
bds
|
0
ba
|
941
sqft
|
built
2006
106 W Seeboth St, Milwaukee, WI 53204
$-1,234
Cash flow
-17.1%
Cash-on-Cash Return
2.2%
Cap rate
0.5%
Rent to Value Ratio
Active
$399,900
6
bds
|
0
ba
|
2,600
sqft
|
built
1895
2464 N 5th St, Milwaukee, WI 53212
$-1,681
Cash flow
-21.9%
Cash-on-Cash Return
1.1%
Cap rate
0.2%
Rent to Value Ratio
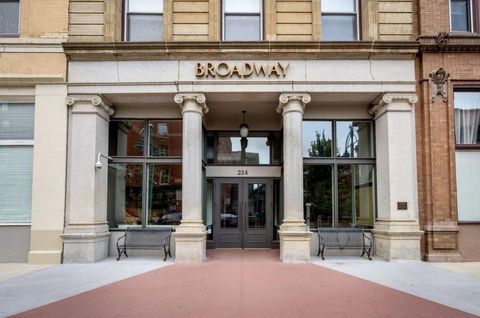
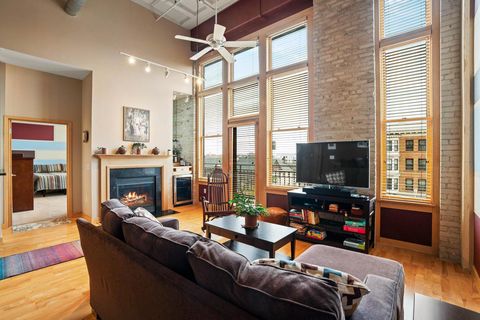
Active
$499,900
2
bds
|
2
ba
|
1,151
sqft
|
built
1893
234 N Broadway, Milwaukee, WI 53202
$-2,350
Cash flow
-24.5%
Cash-on-Cash Return
0.5%
Cap rate
0.4%
Rent to Value Ratio

Active
$365,400
2
bds
|
2
ba
|
1,490
sqft
|
built
2003
1925 N Water St, Milwaukee, WI 53202
$-1,116
Cash flow
-15.9%
Cash-on-Cash Return
2.5%
Cap rate
0.7%
Rent to Value Ratio
Active
$285,000
3
bds
|
2
ba
|
1,255
sqft
|
built
1967
1707 N Prospect Ave, Milwaukee, WI 53202
$-1,522
Cash flow
-27.9%
Cash-on-Cash Return
-0.3%
Cap rate
0.6%
Rent to Value Ratio
Active
$245,555
6
bds
|
0
ba
|
3,043
sqft
|
built
1923
2809 N 48th St, Milwaukee, WI 53210
$-679
Cash flow
-14.4%
Cash-on-Cash Return
2.8%
Cap rate
0.5%
Rent to Value Ratio
Active
$1,399,000
7
bds
|
5
ba
|
6,911
sqft
|
built
1895
2701 N Lake Dr, Milwaukee, WI 53211
$-7,346
Cash flow
-27.4%
Cash-on-Cash Return
-0.2%
Cap rate
0.3%
Rent to Value Ratio

Active
$104,900
4
bds
|
1
ba
|
2,266
sqft
|
built
1924
1925 N 27th St, Milwaukee, WI 53208
$50
Cash flow
2.5%
Cash-on-Cash Return
6.7%
Cap rate
1.0%
Rent to Value Ratio
Active
$187,000
1
bds
|
1
ba
|
739
sqft
|
built
1901
270 E Highland Ave, Milwaukee, WI 53202
$-903
Cash flow
-25.2%
Cash-on-Cash Return
0.4%
Cap rate
0.7%
Rent to Value Ratio
Active
$259,900
3
bds
|
1
ba
|
963
sqft
|
built
1953
5509 N 20th St, Milwaukee, WI 53209
$-183
Cash flow
-3.7%
Cash-on-Cash Return
5.3%
Cap rate
0.8%
Rent to Value Ratio

Active
$113,900
2
bds
|
1
ba
|
672
sqft
|
built
1954
5724 N 62nd St, Milwaukee, WI 53218
$-46
Cash flow
-2.1%
Cash-on-Cash Return
5.7%
Cap rate
0.8%
Rent to Value Ratio
Active
$118,000
5
bds
|
0
ba
|
1,932
sqft
|
built
1910
2541 N 34th St, Milwaukee, WI 53210
$-3
Cash flow
-0.1%
Cash-on-Cash Return
6.1%
Cap rate
0.8%
Rent to Value Ratio
Active
$169,900
7
bds
|
0
ba
|
0
sqft
|
built
1892
3573 N 11th St, Milwaukee, WI 53206
$-280
Cash flow
-8.6%
Cash-on-Cash Return
4.2%
Cap rate
0.6%
Rent to Value Ratio
Active
$319,900
1
bds
|
1
ba
|
858
sqft
|
built
2007
106 W Seeboth St, Milwaukee, WI 53204
$-1,675
Cash flow
-27.3%
Cash-on-Cash Return
-0.1%
Cap rate
0.5%
Rent to Value Ratio
Active
$475,000
2
bds
|
2
ba
|
1,329
sqft
|
built
1922
1325 N Van Buren St, Milwaukee, WI 53202
$-2,353
Cash flow
-25.8%
Cash-on-Cash Return
0.2%
Cap rate
0.4%
Rent to Value Ratio
Active
$249,900
5
bds
|
1
ba
|
2,470
sqft
|
built
1890
845 N 22nd St, Milwaukee, WI 53233
$-359
Cash flow
-7.5%
Cash-on-Cash Return
4.4%
Cap rate
0.8%
Rent to Value Ratio
Active
$169,420
4
bds
|
1
ba
|
2,016
sqft
|
built
1920
3151 N 41st St, Milwaukee, WI 53216
$-363
Cash flow
-11.2%
Cash-on-Cash Return
3.6%
Cap rate
0.6%
Rent to Value Ratio
Active
$385,000
4
bds
|
2
ba
|
2,215
sqft
|
built
1950
2728 N 90th St, Milwaukee, WI 53222
$-1,098
Cash flow
-14.9%
Cash-on-Cash Return
2.7%
Cap rate
0.5%
Rent to Value Ratio

Active
$4,900,000
6
bds
|
0
ba
|
8,544
sqft
|
built
1890
3432 N Lake Dr, Milwaukee, WI 53211
$-30,120
Cash flow
-32.1%
Cash-on-Cash Return
-1.2%
Cap rate
0.0%
Rent to Value Ratio