Chicago, IL Investment Properties for Sale
Browse homes for sale and investment properties in Chicago, IL. Refine your search by price, property type, or more.
Best cash flowing properties in Chicago, IL
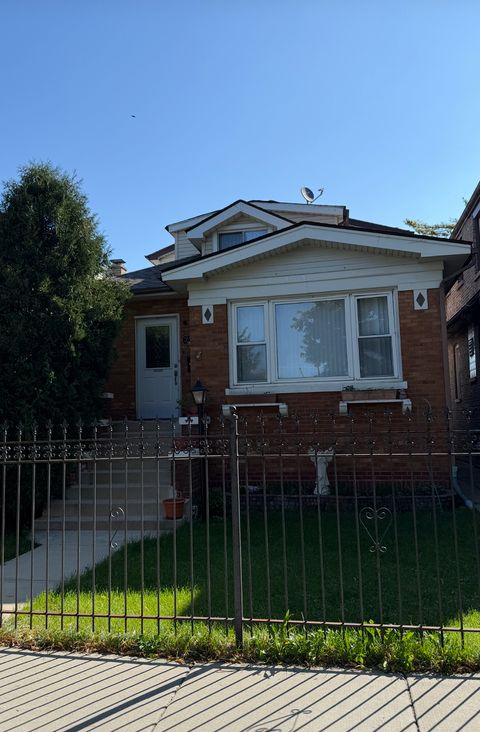
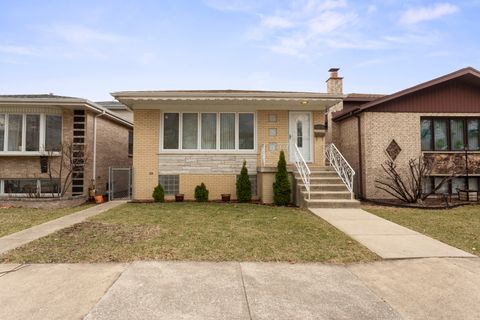
Active
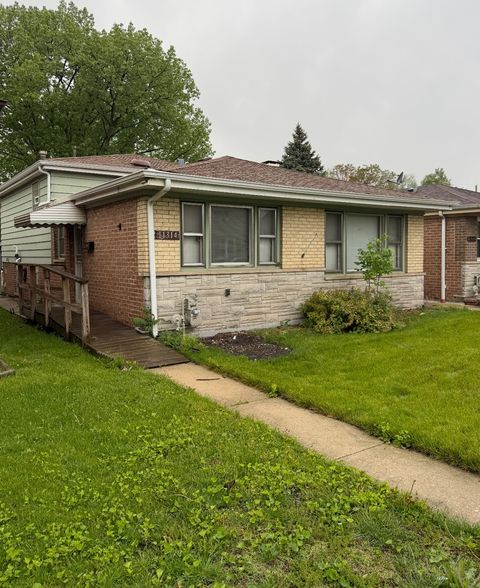
$159,900
2
bds
|
2
ba
|
1,217
sqft
|
built
1953
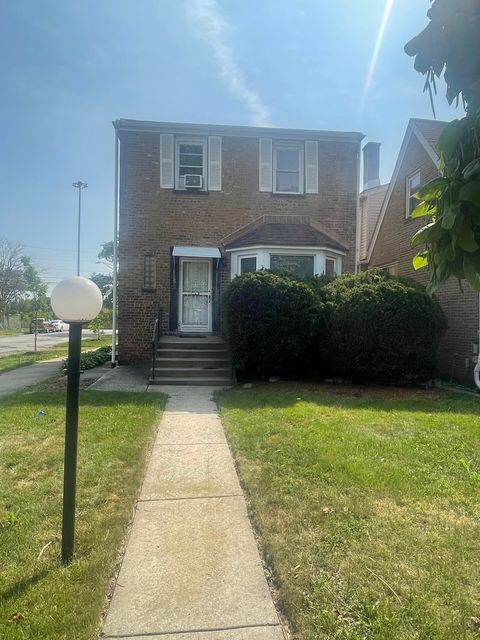
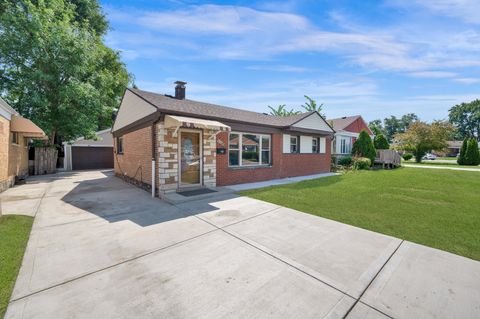
9601 S Perry Ave, Chicago, IL 60628
$696
Cash flow
22.7%
Cash-on-Cash Return
10.9%
Cap rate
1.4%
Rent to Value Ratio
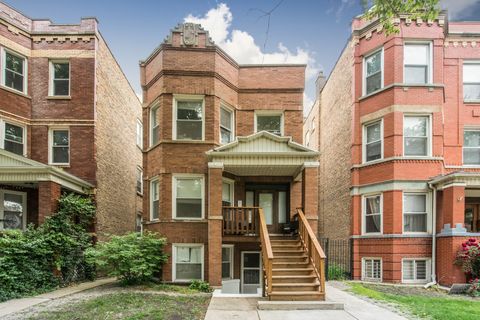
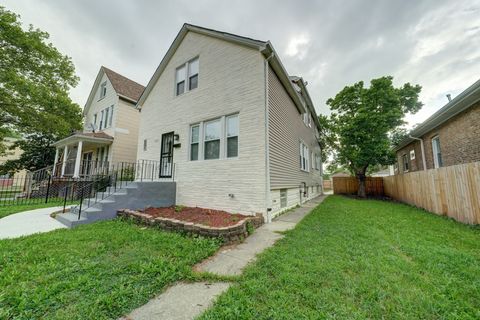
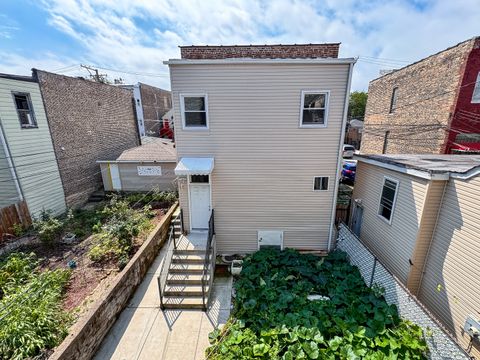
Active
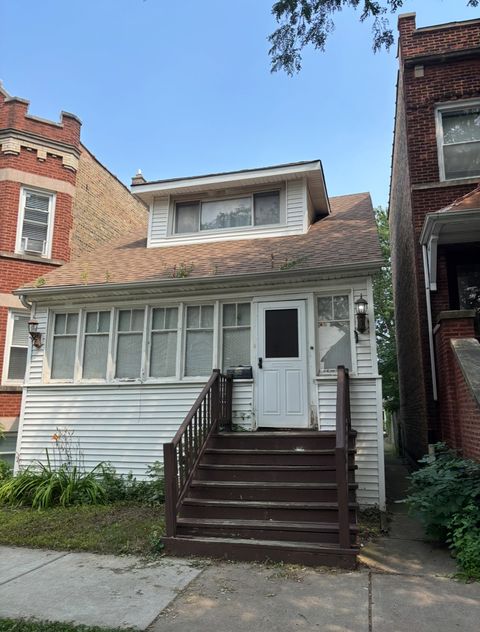
$90,000
3
bds
|
2
ba
|
1,200
sqft
|
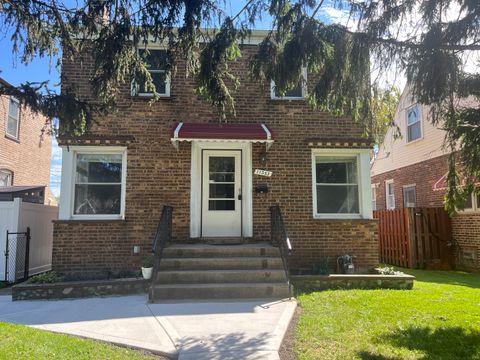
built
1924
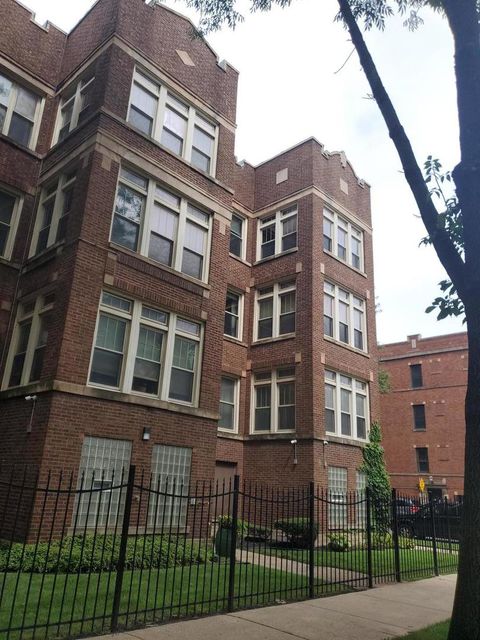
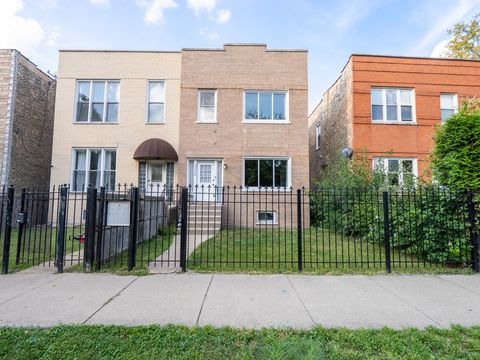
2234 E 70th Pl, Chicago, IL 60649
$581
Cash flow
33.7%
Cash-on-Cash Return
13.4%
Cap rate
1.8%
Rent to Value Ratio
2,162 out of 2,611 properties for sale in Chicago, IL
Limited Results Shown
Create a free account, or log in to reveal all property listings and enjoy the complete experience.
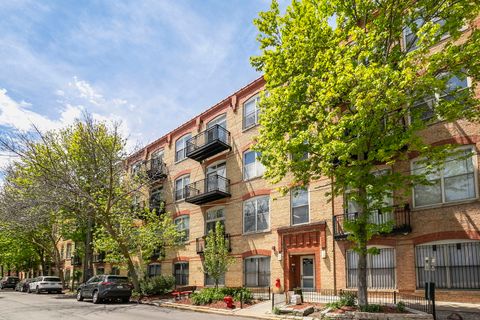
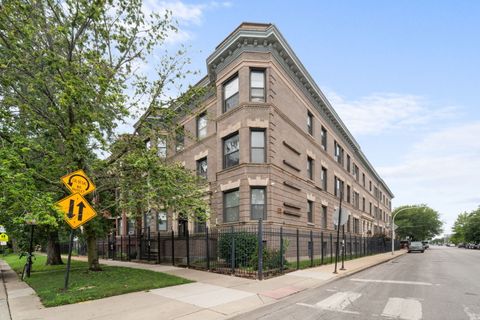
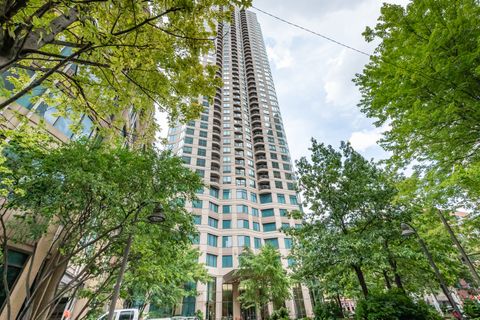
Active
$649,900
3
bds
|
3
ba
|
2,400
sqft
|
built
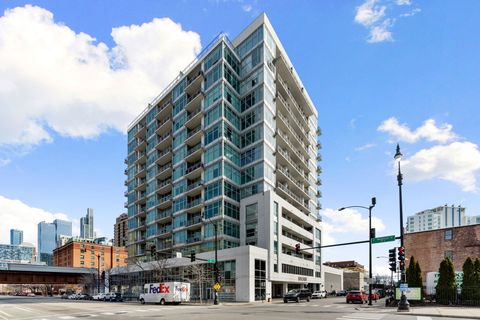
1924
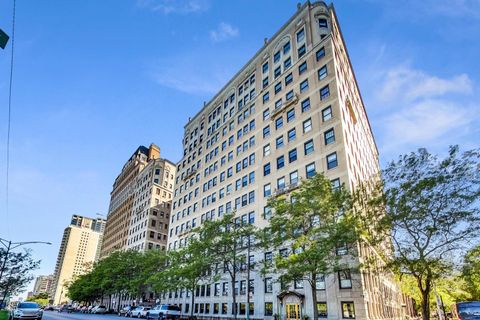
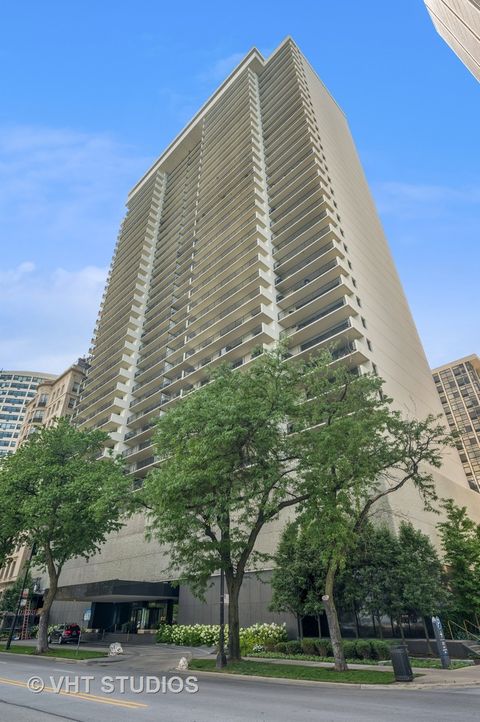
3530 N Lake Shore Dr, Chicago, IL 60657
$-2,916
Cash flow
-23.4%
Cash-on-Cash Return
0.3%
Cap rate
0.8%
Rent to Value Ratio
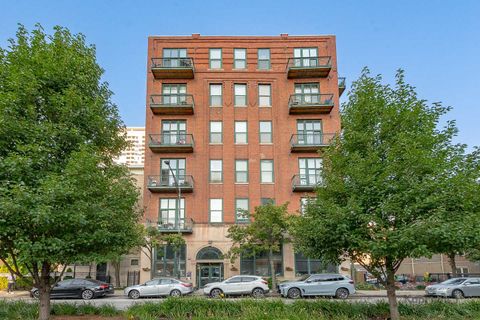
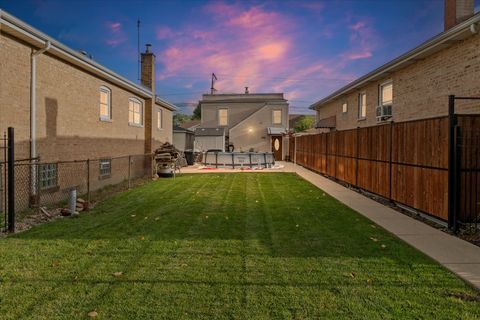
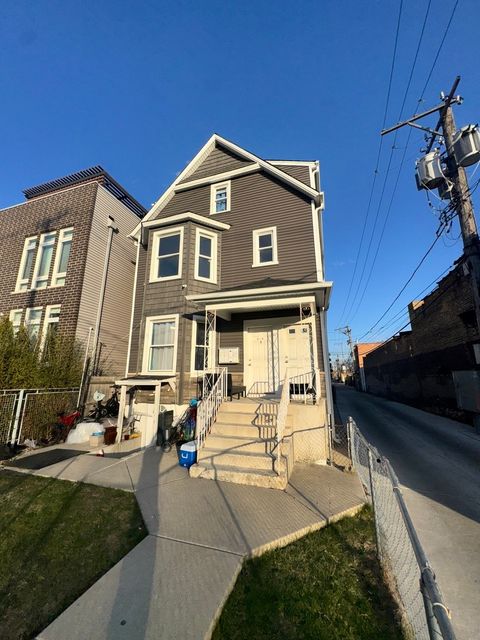
Active
$299,900
4
bds
|
3
ba
|
2,654
sqft
|
built
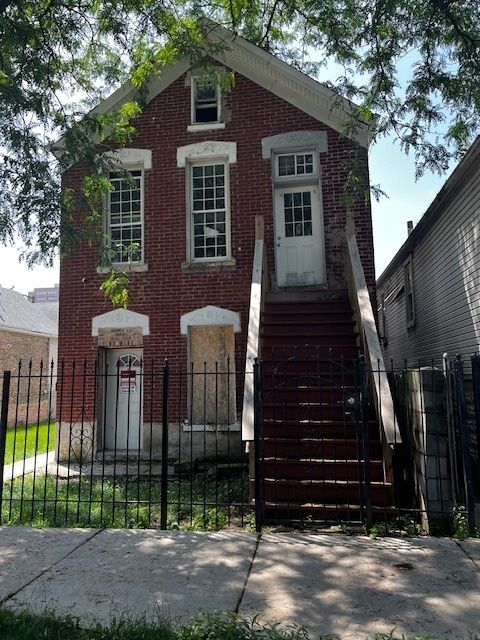
1890
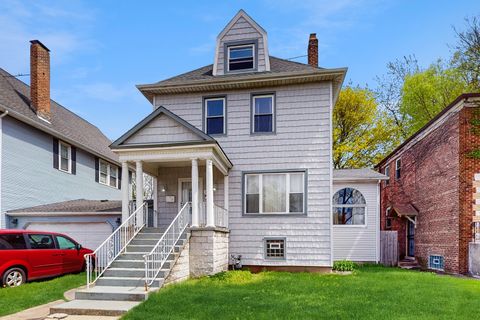
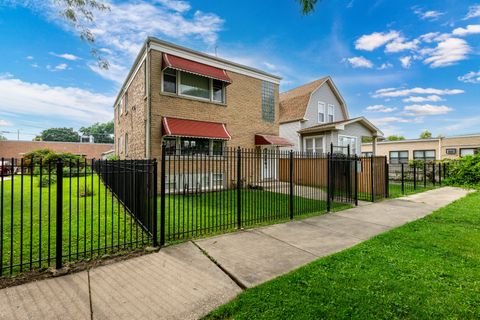
8211 S Cornell Ave, Chicago, IL 60617
$284
Cash flow
4.9%
Cash-on-Cash Return
6.8%
Cap rate
0.9%
Rent to Value Ratio
Active
$249,000
4
bds
|
3
ba
|
2,214
sqft
|
built
1916
7449 S Vernon Ave, Chicago, IL 60619
$187
Cash flow
3.9%
Cash-on-Cash Return
6.6%
Cap rate
0.9%
Rent to Value Ratio
Active
$1,100,000
5
bds
|
5
ba
|
3,240
sqft
|
built
1948
2910 W Gregory St, Chicago, IL 60625
$-3,427
Cash flow
-16.3%
Cash-on-Cash Return
1.9%
Cap rate
0.4%
Rent to Value Ratio

Active
$294,900
3
bds
|
2
ba
|
1,589
sqft
|
built
1957
8414 S King Dr, Chicago, IL 60619
$-518
Cash flow
-9.2%
Cash-on-Cash Return
3.6%
Cap rate
0.6%
Rent to Value Ratio
Active
$590,000
5
bds
|
5
ba
|
0
sqft
|
built
1895
5850 S Indiana Ave, Chicago, IL 60637
$-657
Cash flow
-5.8%
Cash-on-Cash Return
4.3%
Cap rate
0.5%
Rent to Value Ratio
Active
$1,150,000
4
bds
|
3
ba
|
0
sqft
|
built
2001
3814 N Greenview Ave, Chicago, IL 60613
$-2,326
Cash flow
-10.6%
Cash-on-Cash Return
3.3%
Cap rate
0.6%
Rent to Value Ratio
Active
$679,900
8
bds
|
3
ba
|
0
sqft
|
built
1955
5038 N Harding Ave, Chicago, IL 60625
$-2,493
Cash flow
-19.1%
Cash-on-Cash Return
1.3%
Cap rate
0.3%
Rent to Value Ratio
Active
$650,000
6
bds
|
3
ba
|
2,800
sqft
|
built
1888
3306 W Le Moyne St, Chicago, IL 60651
$-1,956
Cash flow
-15.7%
Cash-on-Cash Return
2.1%
Cap rate
0.4%
Rent to Value Ratio
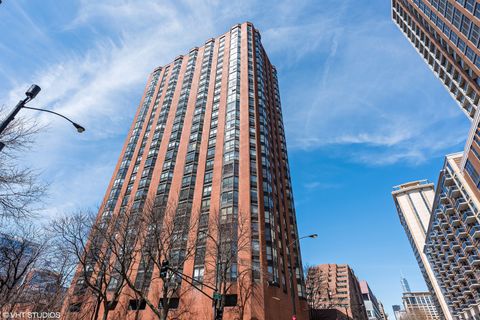
Active
$850,000
2
bds
|
2
ba
|
1,850
sqft
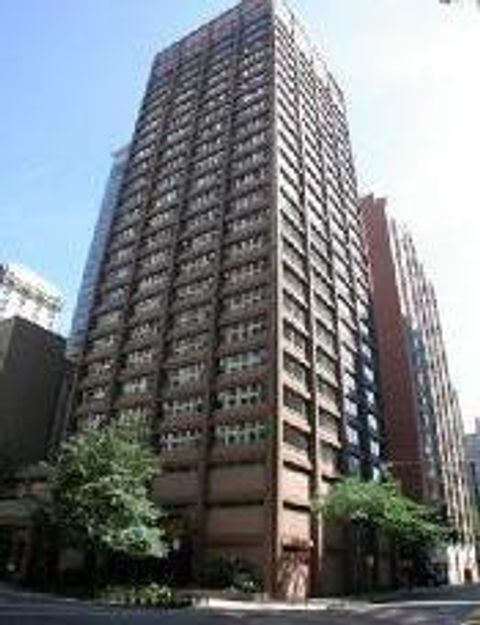
|
built
1967
1212 N Lake Shore Dr, Chicago, IL 60610
$-3,936
Cash flow
-24.2%
Cash-on-Cash Return
0.1%
Cap rate
0.5%
Rent to Value Ratio
Active
$284,900
3
bds
|
2
ba
|
1,378
sqft
|
built
1952
8053 S Kenton Ave, Chicago, IL 60652
$50
Cash flow
0.9%
Cash-on-Cash Return
5.9%
Cap rate
0.8%
Rent to Value Ratio
Active
$472,500
2
bds
|
2
ba
|
1,350
sqft
|
built
2002
1740 N Maplewood Ave, Chicago, IL 60647
$-1,524
Cash flow
-16.8%
Cash-on-Cash Return
1.8%
Cap rate
0.6%
Rent to Value Ratio
Active
$420,000
3
bds
|
2
ba
|
1,647
sqft
|
built
1923
2323 N Keating Ave, Chicago, IL 60639
$-206
Cash flow
-2.6%
Cash-on-Cash Return
5.1%
Cap rate
0.8%
Rent to Value Ratio
Active
$799,000
4
bds
|
2
ba
|
0
sqft
|
built
1910
3080 N Davlin Ct, Chicago, IL 60618
$-2,418
Cash flow
-15.8%
Cash-on-Cash Return
2.0%
Cap rate
0.4%
Rent to Value Ratio
Active
$329,995
1
bds
|
2
ba
|
1,100
sqft
|
built
1905
1632 S Indiana Ave, Chicago, IL 60616
$-700
Cash flow
-11.1%
Cash-on-Cash Return
3.1%
Cap rate
0.8%
Rent to Value Ratio
Active
$199,900
5
bds
|
2
ba
|
0
sqft
|
built
1898
212 N Leamington Ave, Chicago, IL 60644
$480
Cash flow
12.5%
Cash-on-Cash Return
8.6%
Cap rate
1.3%
Rent to Value Ratio
Active
$599,000
6
bds
|
3
ba
|
0
sqft
|
built
1888
3217 S May St, Chicago, IL 60608
$-1,690
Cash flow
-14.7%
Cash-on-Cash Return
2.3%
Cap rate
0.4%
Rent to Value Ratio
Active
$329,800
4
bds
|
3
ba
|
2,888
sqft
|
built
1927
10016 S Yale Ave, Chicago, IL 60628
$-334
Cash flow
-5.3%
Cash-on-Cash Return
4.5%
Cap rate
0.5%
Rent to Value Ratio
Active
$299,000
7
bds
|
3
ba
|
0
sqft
|
built
1898
4224 W Thomas St, Chicago, IL 60651
$-230
Cash flow
-4.0%
Cash-on-Cash Return
4.8%
Cap rate
0.7%
Rent to Value Ratio
Active
$559,900
3
bds
|
3
ba
|
2,400
sqft
|
built
1973
4567 N Merrimac Ave, Chicago, IL 60630
$-882
Cash flow
-8.2%
Cash-on-Cash Return
3.8%
Cap rate
0.6%
Rent to Value Ratio
Active
$425,000
8
bds
|
3
ba
|
0
sqft
|
built
1926
9107 S Dobson Ave, Chicago, IL 60619
$-765
Cash flow
-9.4%
Cash-on-Cash Return
3.5%
Cap rate
0.5%
Rent to Value Ratio
Active
$219,000
2
bds
|
1
ba
|
0
sqft
|
built
1910
6100 S Ingleside Ave, Chicago, IL 60637
$-154
Cash flow
-3.7%
Cash-on-Cash Return
4.8%
Cap rate
1.1%
Rent to Value Ratio
Active
$289,000
4
bds
|
2
ba
|
1,368
sqft
|
built
1913
3711 W 56th Pl, Chicago, IL 60629
$-99
Cash flow
-1.8%
Cash-on-Cash Return
5.3%
Cap rate
0.8%
Rent to Value Ratio
Active
$299,000
1
bds
|
1
ba
|
723
sqft
|
built
2010
400 N La Salle Dr, Chicago, IL 60654
$-713
Cash flow
-12.4%
Cash-on-Cash Return
2.8%
Cap rate
0.8%
Rent to Value Ratio
Active
$830,000
8
bds
|
4
ba
|
0
sqft
|
built
1912
1940 N Monticello Ave, Chicago, IL 60647
$-2,178
Cash flow
-13.7%
Cash-on-Cash Return
2.5%
Cap rate
0.4%
Rent to Value Ratio
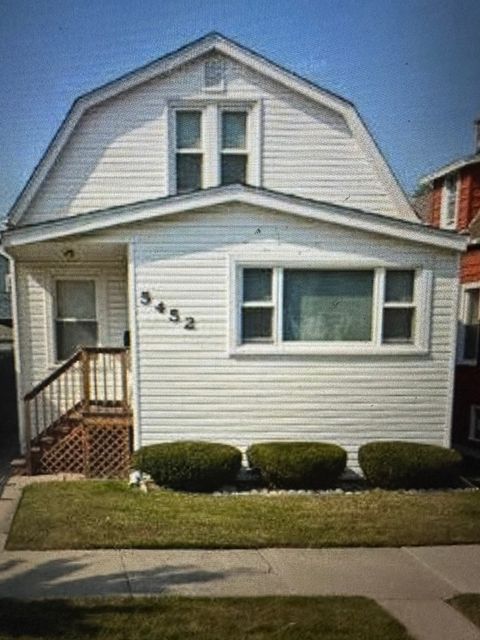
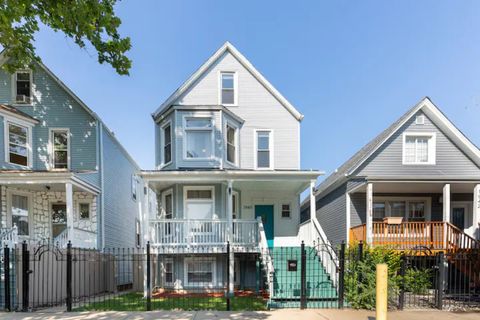
Active
$395,000
3
bds
|
1
ba
|
1,056
sqft
|
built
1918
5452 W Warwick Ave, Chicago, IL 60641
$-342
Cash flow
-4.5%
Cash-on-Cash Return
4.6%
Cap rate
0.7%
Rent to Value Ratio
Active
$179,000
bds
|
1
ba
|
0
sqft
|
built
1980
899 S Plymouth Ct, Chicago, IL 60605
$-484
Cash flow
-14.1%
Cash-on-Cash Return
2.4%
Cap rate
0.9%
Rent to Value Ratio
Active
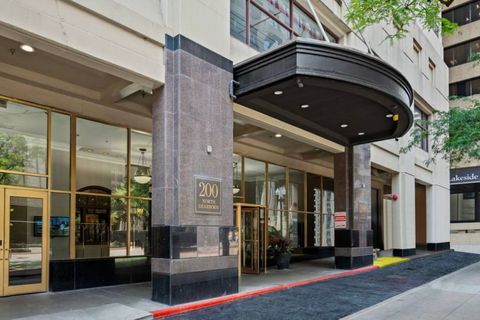
$235,000
1
bds
|
1
ba
|
770
sqft
|
built
1989
200 N Dearborn St, Chicago, IL 60601
$-772
Cash flow
-17.1%
Cash-on-Cash Return
1.7%
Cap rate
0.8%
Rent to Value Ratio
Active
$850,000
3
bds
|
1
ba
|
0
sqft
|
built
1889
235 W 23rd St, Chicago, IL 60616
$-2,748
Cash flow
-16.9%
Cash-on-Cash Return
1.8%
Cap rate
0.3%
Rent to Value Ratio
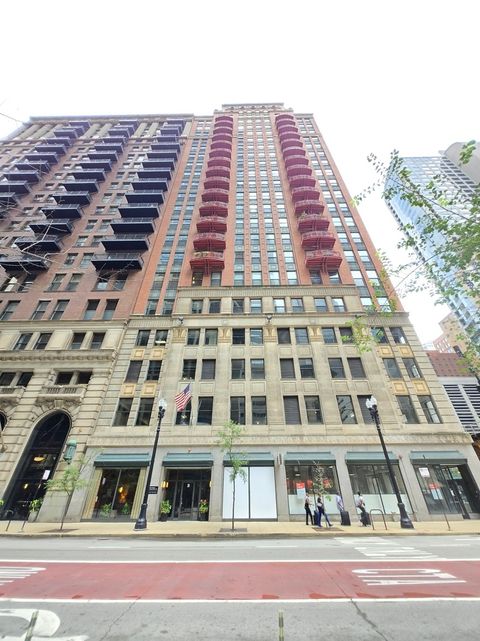
Active
$365,000
2
bds
|
2
ba
|
1,380
sqft
|
built
1927
208 W Washington St, Chicago, IL 60606
$-1,434
Cash flow
-20.5%
Cash-on-Cash Return
1.0%
Cap rate
0.9%
Rent to Value Ratio
Active
$750,000
9
bds
|
4
ba
|
0
sqft
|
built
1908
5015 N Kimberly Ave, Chicago, IL 60630
$-2,113
Cash flow
-14.7%
Cash-on-Cash Return
2.3%
Cap rate
0.4%
Rent to Value Ratio
Active
$350,000
bds
|
0
ba
|
0
sqft
|
built
1880
2911 W 25th St, Chicago, IL 60623
$-610
Cash flow
-9.1%
Cash-on-Cash Return
3.6%
Cap rate
0.6%
Rent to Value Ratio
Active
$799,999
3
bds
|
2
ba
|
0
sqft
|
built
2008
50 E 16th St, Chicago, IL 60616
$-1,570
Cash flow
-10.2%
Cash-on-Cash Return
3.3%
Cap rate
0.8%
Rent to Value Ratio
Active
$348,000
2
bds
|
2
ba
|
1,260
sqft
|
built
1963
247 E Chestnut St, Chicago, IL 60611
$-989
Cash flow
-14.8%
Cash-on-Cash Return
2.3%
Cap rate
1.0%
Rent to Value Ratio
Active
$255,900
2
bds
|
1
ba
|
972
sqft
|
built
1947
11353 S Ewing Ave, Chicago, IL 60617
$-145
Cash flow
-3.0%
Cash-on-Cash Return
5.0%
Cap rate
0.7%
Rent to Value Ratio
Active
$295,000
4
bds
|
2
ba
|
1,810
sqft
|
built
1951
3526 W 80th Pl, Chicago, IL 60652
$276
Cash flow
4.9%
Cash-on-Cash Return
6.8%
Cap rate
0.9%
Rent to Value Ratio
Active
$226,500
3
bds
|
2
ba
|
1,032
sqft
|
built
1971
11314 S Green Bay Ave, Chicago, IL 60617
$184
Cash flow
4.2%
Cash-on-Cash Return
6.7%
Cap rate
0.9%
Rent to Value Ratio
Active
$400,000
3
bds
|
2
ba
|
1,650
sqft
|
built
1914
3911 N Saint Louis Ave, Chicago, IL 60618
$-369
Cash flow
-4.8%
Cash-on-Cash Return
4.6%
Cap rate
0.7%
Rent to Value Ratio