All Forum Categories
Market News & Data
General Info
Real Estate Strategies

Landlording & Rental Properties
Real Estate Professionals
Financial, Tax, & Legal


Real Estate Classifieds
Reviews & Feedback
All Forum Posts by: Kristen Haynes
Kristen Haynes has started 27 posts and replied 87 times.
 Post: Nationwide Housing Stats - And September / November Rate Cuts...
- Real Estate Broker
- Greater Charlotte NC and Charleston, SC areas
- Posts 105
- Votes 58
Yep. It's a tough market for buyers, definitely a win/win for sellers.
Post: Nationwide Housing Stats - And September / November Rate Cuts...
- Real Estate Broker
- Greater Charlotte NC and Charleston, SC areas
- Posts 105
- Votes 58
What a week! We had a huge downward revision to the BLS jobs growth figures, the Fed minutes explicitly said that a rate cut on Sept 18 was likely, and average mortgage rates moved below 6.5% (and are now 1% lower than they were a year ago).
July housing starts disappoint. New home starts fell 7% month-over-month to 1.24 million units (annualized) — their lowest level since July 2019 (excluding the onset of COVID). [Much more on this later.] [Census Bureau]
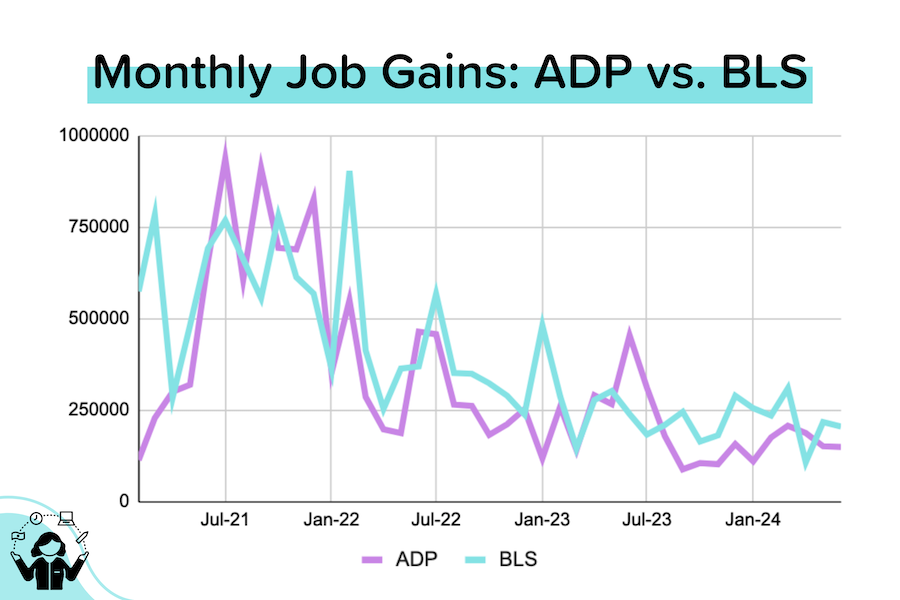
818,000 jobs — GONE. Every quarter we get the QCEW (Quarterly Census of Employment and Wages). The latest QCEW showed that the job gains previously reported by the BLS between March 2023 and March 2024 had been revised lower by 818,000!
TP: Jerome Powell and the other Fed members will have to take this into account. Instead of average monthly job gains of 242K, it was actually 174K — a downward revision of 28%.
Fed minutes let the cut out of the bag. The notes from the Fed’s last meeting (held on July 30–31) included a big reveal: “The vast majority [of Fed members] observed that, if the data continued to come in about as expected, it would likely be appropriate to ease policy at the next meeting.”
TP: Keep in mind that the last Fed meeting happened before: 1) the July unemployment rate jumped to 4.3%, 2) July CPI came in lower than expected, and 3) the huge, downward QCEW revisions to jobs growth. It’s looking more and more likely that Mr. Powell might have something exciting to say at Jackson Hole.
Million dollar listings. They aren’t so rare anymore. According to Redfin, 8.5% of homes in the US are worth more than $1 million. That percentage was 4% before the pandemic sent home prices rocketing nationwide. [Redfin]
TP: This is really just an attention-grabbing alternative to saying that prices have risen a lot. Think about it: if we assume that prices rose 40% during the pandemic, that means that any home that was worth between $700K-$999K before COVID is now valued above $1 million. And, of course, the ones that were worth more than $1 million before COVID are still worth more than $1 million. In other words, that percentage will only rise (unless prices begin plunging).
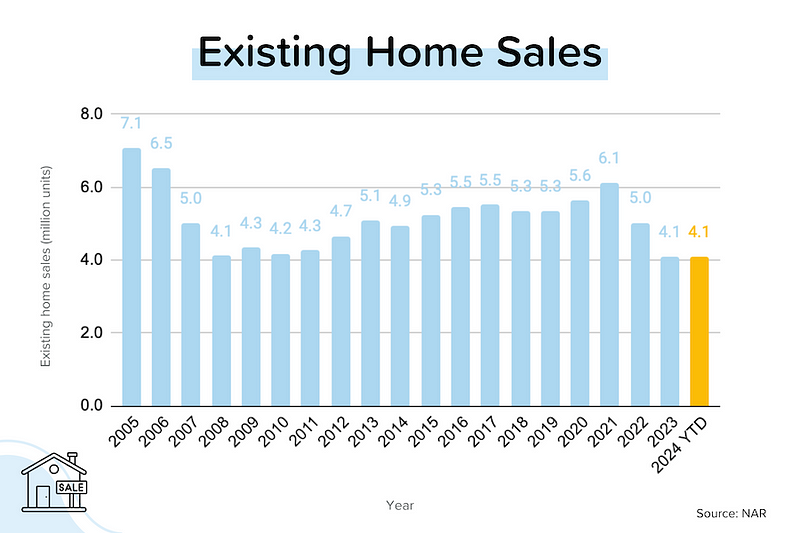
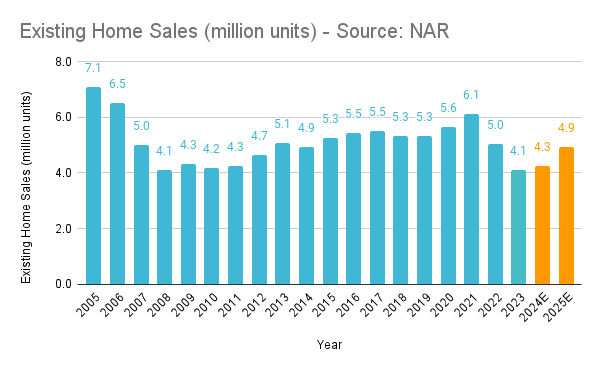
Existing home sales rebound, sort of. July existing home sales rose 1.3% month-over month, (-2.5% year-over-year) to 3.95 million units (seasonally-adjusted and annualized). It looks like transaction activity has finally bottomed, but we're still deep in the trough. The median sales price fell 1.0% month-over-month to $423K, but was still up 4.2% year-over-year. [NAR]
TP: Over the last 2.5 years, existing home sales have declined month-over-month in 25 out of 30 months. But with the sharp decline in mortgage rates since May, the moribund housing market is showing signs of life.
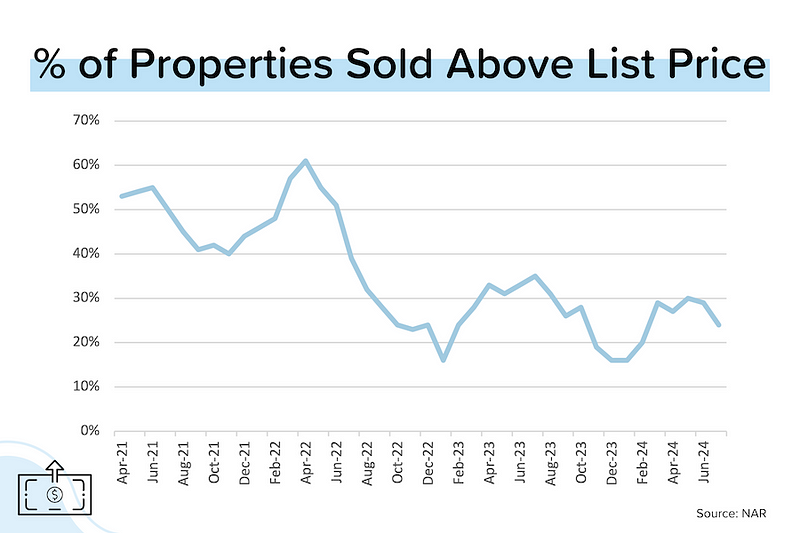
Confidence rising; competition falling. It's very normal for competitive ferocity to begin waning in July/August. The latest Realtors Confidence Index showed a decline in the % of homes sold above list price (29% in June → 24% in July), the number of offers per sale (2.9 → 2.7), and the number of homes sold in less than a month (65% → 62%). But unusually for this time of the year, more Realtors see rising buyer demand in the next 3 months (13% → 16%). [NAR]
The “hottest” zips. The ZIPs in Realtor.com’s Top 10 are seeing nearly 4x as many views per listing and selling 1 month faster than the typical home nationally. All of them are located in Midwestern or Northeastern metros. #1 was Gahanna, OH (Columbus). #2 was Ballwin, MO (St. Louis). #3 was Salem, MA (Boston/Cambridge). [Realtor.com]
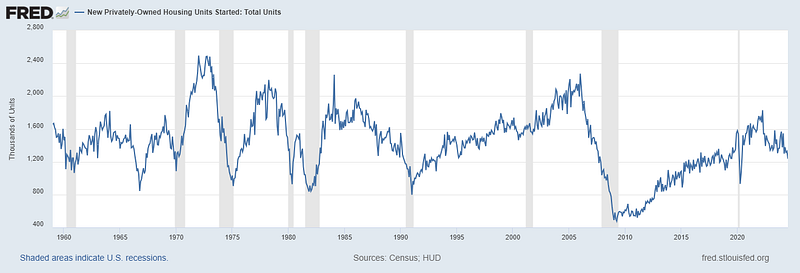
Starts & Permits: Long-term PerspectiveHousing starts disappointed in July 2024, falling 7% month-over-month to 1.24 million units (SAAR). But let’s zoom out and look at housing starts (this is single family + multifamily) over the last 60 years. Three things stand out from the graph below:
- New home construction is wildly cyclical
- New home construction really hasn’t grown in 6 decades, but
- Our population has risen by 150 million over the same time period!
So what’s the problem? It’s a lot of things. As I’ve written previously, the Top 20 builders have been rapidly gaining nationwide market share (>50% in 2023 vs. 33% in 2013). Most of them are listed companies (they have a stock price), which means they really care about margins and earnings growth. The shortage of available housing is GOOD for them. Nobody (including the NAHB) talks about this.
Second, it’s become far more complicated to build new homes from a regulatory standpoint (takes longer, costs more). Third, labor shortages. The NAHB talks about these. Let’s look at the impact those last two have had on the time it takes to deliver a new home (or apartment building).
Stages in New Home Construction
- Application for Construction Permit
- Permit Approval (2–12 months after application depending on where/what you want to build)
- Start (2.8 months after approval for MF, 1.3 months after approval for SFH)
- Under Construction
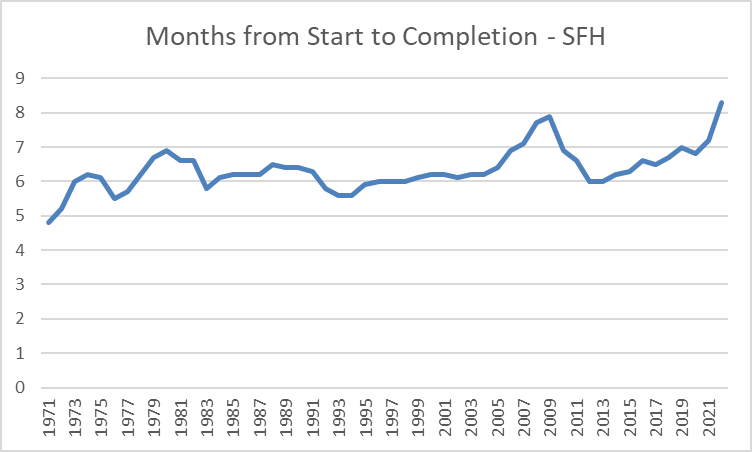
- Completion (17 months after start for MF, 8.3 months after start for SFH)
What does this mean? From the time that your new apartment complex gets its permit approved to the building being completed could take 20 months. If you include the time waiting for your application to be approved, it could easily be 2 years.
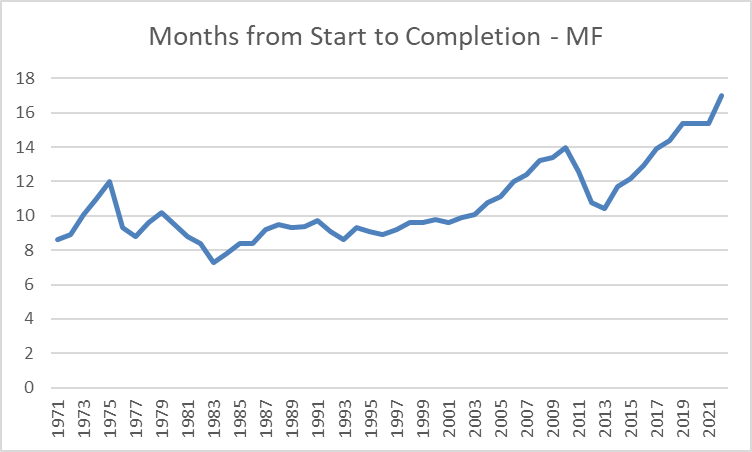
These timelines keep getting stretched out. Just look at the average number of months from Start to Completion for Multifamily buildings over the last 50 years. 17 months is a record! This tells a familiar story of labor and material shortages.
Note: Obviously, a big part of the recent rise is COVID-related. I would hope to see that figure drop in 2023. Even if it does, it will still be very high relative to history.
Source: Census Bureau
Source: Census Bureau
Realtors Confidence IndexCompetition levels typically peak around June. After June, inventory tends to build (days on market rises), there are fewer bidding wars, and a smaller percentage of homes sell for more than their listing price. You can easily see that seasonality in most of the charts below. With that in mind, it’s worth noting that:
- Competition levels are much lower than they were during the pandemic housing boom
- Competition levels are a bit lower than they were at the same time last year, but
- Realtors are a bit more optimistic about the future than they were at the same time last year, thanks to lower mortgage rates
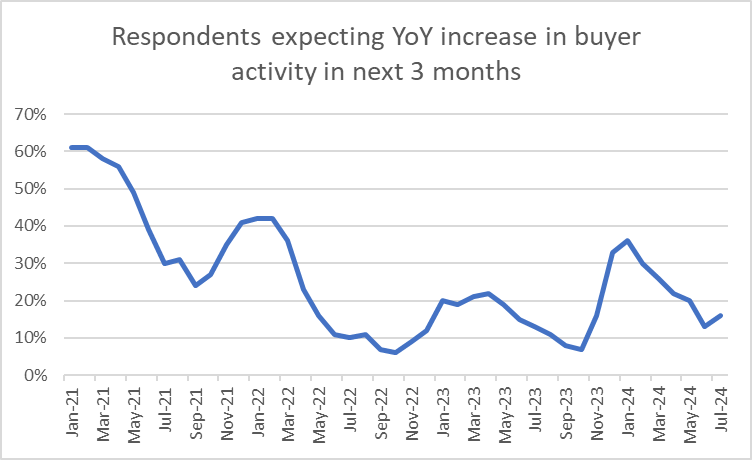
Outlook for Increasing Buyer Traffic
It’s unusual for this % to be rising in July. But that’s exactly what it did, climbing from 13% in June 2024 to 16% in July 2024. Why? It’s all about lower mortgage rates. It will be VERY interesting to see how these three factors influence existing home sales over the next 3 months:
- Seasonal slowdown (-)
- Mortgage rates dropping (+)
- Buyers potentially paying their own buy-side brokerage commissions (-)
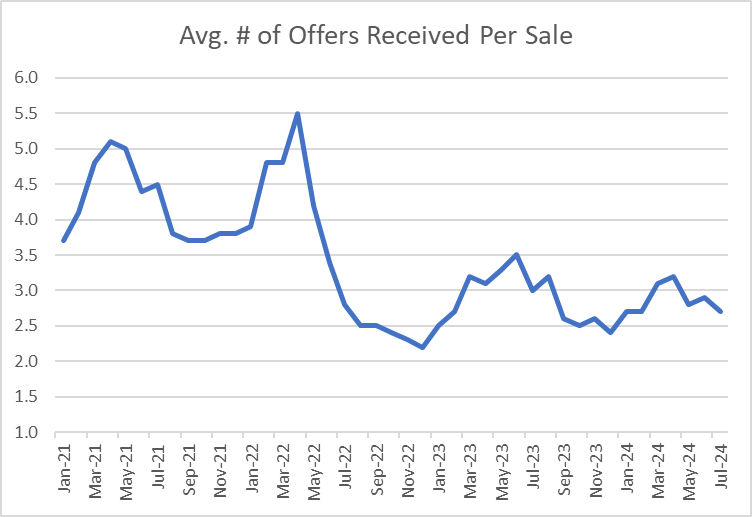
Average Number of Offers Received per Sale
The average home sold in July 2024 had 2.7 offers, down slightly from 2.9 in June 2024, and well below 3.0 in July 2023. Remember that this is a national average: in some areas, there are more than five offers per home sold; in others, just one.
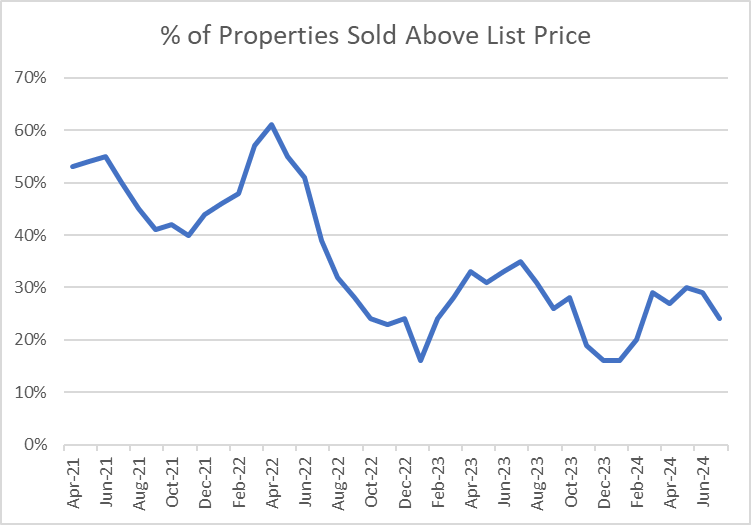
% of Homes Sold Above List Price
24% of the homes sold in July 2024 transacted above their initial listing price. That was down from 29% in June 2024 and 35% in July 2023.
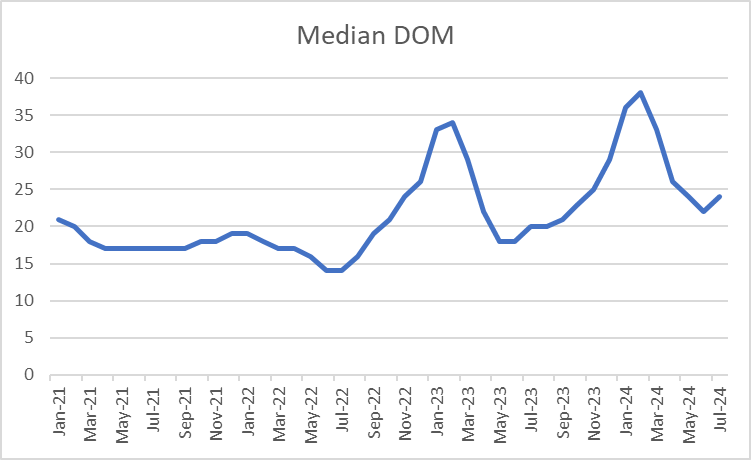
Days on Market
The typical home sold in July 2024 had been on the market for 24 days. That was up from 22 in June 2024, and 20 in July 2023. As the chart suggests, we should begin to see a sharp rise in DOM (homes lingering on the market longer) in the coming months.
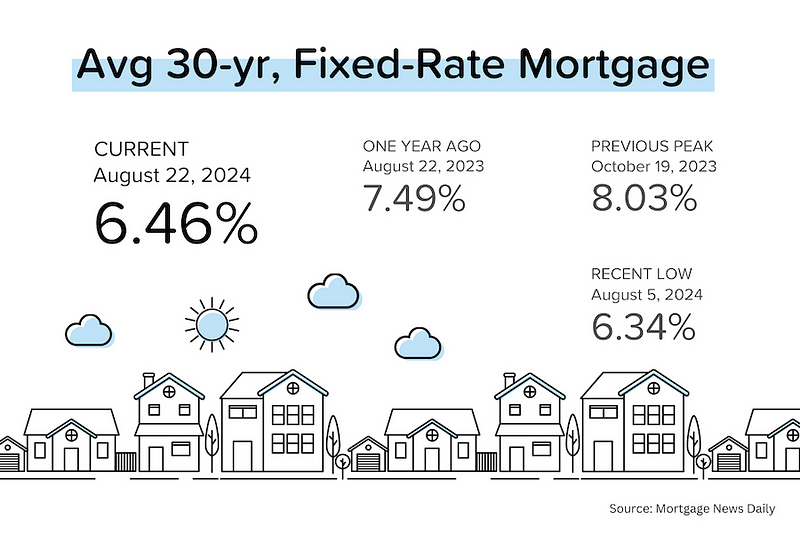
 Mortgage Market
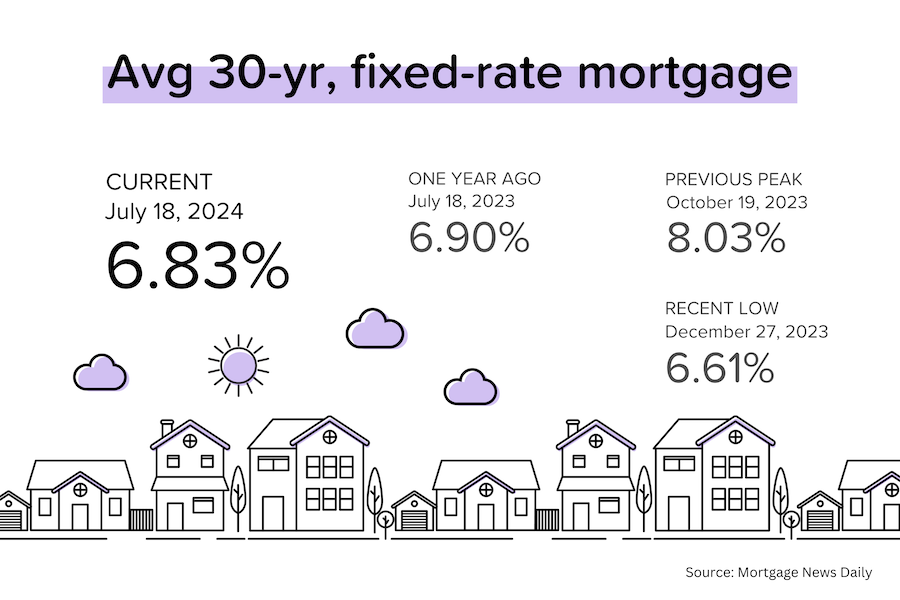
Average 30-year mortgage dropped below 6.5% this week. That’s more than 1% lower than they were a year ago. In fact, mortgage rates have dropped 70 basis points (0.7%) since the beginning of May! This will eventually boost transaction volumes. The 1% MoM increase in July existing home sales was just a taste.
Here are the current odds on Fed rate cuts at upcoming FOMC meetings:
- Sept 18: 100% (same as last week); the probability of a 50 basis points cut roughly steady at 25%.
- Nov 5: US presidential election
- Nov 7: 100% (same as last week); 39% probability that rates will be 75 basis points lower than current
- Dec 18: 100% (same as last week); 44% probability that rates will be 100 basis points lower than current.
 They Said It
“Despite the modest gain [in July], existing home sales are still sluggish. But consumers are definitely seeing more choices, and affordability is improving due to lower interest rates.” — Lawrence Yun, NAR's Chief Economist
Post: National Real Estate Trends- as of July 19th
- Real Estate Broker
- Greater Charlotte NC and Charleston, SC areas
- Posts 105
- Votes 58
A string of favorable data (lower inflation, higher unemployment rate) has convinced the market that the Federal Reserve will begin cutting short-term interest rates in September, and mortgage rates are already moving lower.
Reminder! Only one month remains before the August 17 implementation date for the NAR settlement. Are you ready? Are your sellers and buyers ready?
Builder confidence bottoming? The National Association of Homebuilder’s confidence index dropped from 43 in June to 42 in July (anything less than 50 = bearish). That’s the lowest index level seen since December 2023.
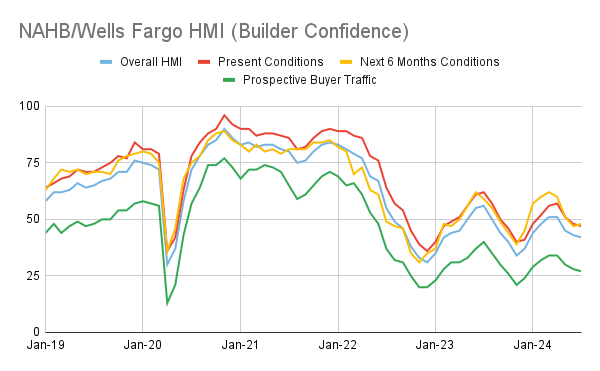
Looking closer at the components of the index, however, revealed that expectations for the next 6 months actually improved slightly. [That’s the yellow line in the graph above.] Why? Because builders are looking forward to rate cuts and lower mortgage rates.
More ‘doves’ are cooing. Influential Fed Governor Christopher Waller has entered the dovecote. On July 17, he had the following to say: “I believe current data are consistent with achieving a soft landing, and I will be looking for data over the next couple months to buttress that view…While I don’t believe we have reached our final destination [for inflation], I do believe we are getting closer to the time when a cut in the policy rate is warranted.”
TP: Bird Words — When it comes to armed conflict, ‘hawks’ want war and ‘doves’ want peace. When it comes to interest rates, ‘hawks’ are worried about inflation and want higher rates, ‘doves’ are worried about the economy and want lower rates. Hence, a ‘dovish’ datapoint is one that supports rate cuts, such as a fall in inflation rates or a rise in unemployment.
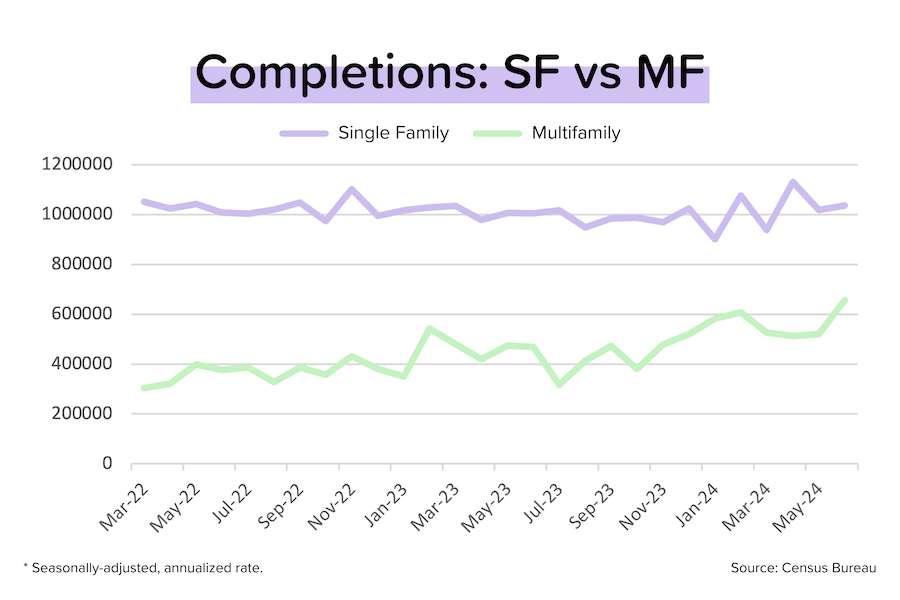
A modest rebound for housing starts. The pandemic spurred a multifamily construction boom (condos, apartments, townhomes etc.). A wave of MF completions is now swelling, with the industry on pace to deliver over 650,000 units nationwide over the next year. That’s the fastest pace of MF construction since 1975! (BTW, over 50% of these units are being built in the South, which includes TX & FL.) [Source: Census Bureau]
TP: This increase in MF supply should help to keep rental rate increases in check, which should also be good news for “shelter” costs and overall inflation.
A 5% cap on rental rate increases? As part of the Biden/Harris plan to boost housing affordability, the White House is proposing a 5% maximum annual rental rate increase for corporate landlords (or forfeit federal tax breaks).
Single-family rents rise faster. Rents for SFHs were up 3.2% year-over-year in May, the fastest rate of growth since April 2023. The strongest growth was seen in St. Louis (+6.2% YoY); the weakest in Austin (-0.6% YoY).
TP: Single family homes (SFH) make up half of the nation’s rental housing stock
Zillow says home listings are “piling up”. Zillow’s June Housing Market Report also pointed out that nearly 25% of listings had a price cut, with most markets in the South now “buyer-friendly”.
TP: It’s certainly true that the nationwide inventory of homes for sale is up significantly year-over-year. But it’s also true that most of that increase is coming from a few key states (Florida, Texas). Despite the rise, national inventory is still 30% below pre-COVID levels.
Mortgage MarketThe market is convinced that the first rate cut will arrive on September 18, and Federal Reserve members haven’t been actively trying to quash those hopes. In general, their public comments have sounded a bit more dovish. Let’s just pray that we don’t get a “hot” inflation reading between now and then.
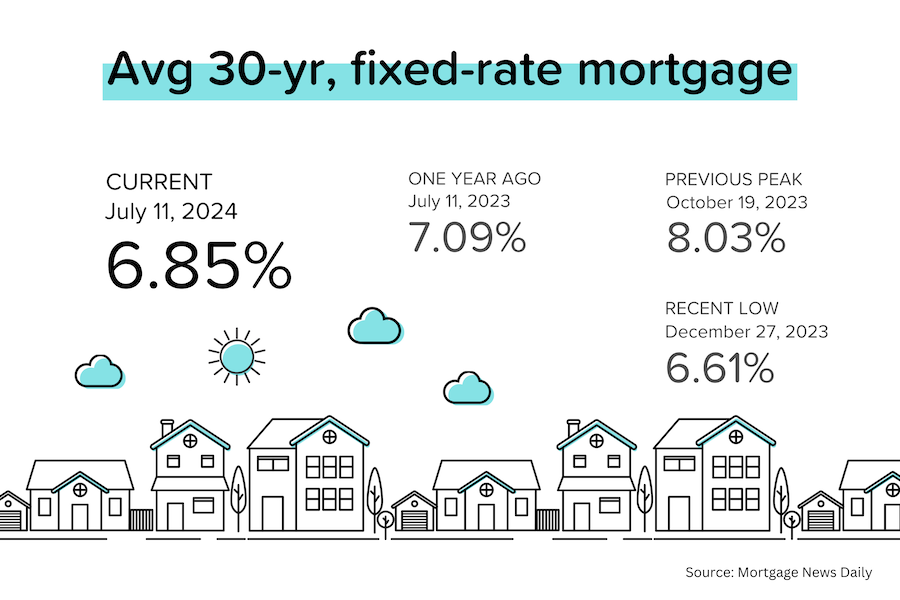
Average 30-year mortgage rates have broken convincingly below 7%. That should boost future loan demand — for both purchases and refinances. Don’t forget that mortgage rates were at or above 7.5% for several months in 2023. Research analysts at Jeffries recently estimated that a $2.7 trillion refinance boom could start soon.
Current odds on Fed rate cuts at upcoming FOMC meetings below. Keep in mind that the US Presidential election is on November 5.
- July 31: 5% (down from 9% last week)
- Sept 18: 98% (up from 93% last week)
- Nov 7: 100% (up from 97% last week); 60% expect rates to be 50 basis points lower than current.
- Dec 18: 100% (was 99% last week); 55% expect rates to be 75 basis points lower than current.
Post: Are interest rate cuts finally on the horizon? See the latest national housing stats!
- Real Estate Broker
- Greater Charlotte NC and Charleston, SC areas
- Posts 105
- Votes 58
I hope so!!! :)
Post: Are interest rate cuts finally on the horizon? See the latest national housing stats!
- Real Estate Broker
- Greater Charlotte NC and Charleston, SC areas
- Posts 105
- Votes 58
Friday July 12, 2024 - by Scott Brixley
Real Estate News in Brief
Rate cuts are definitely coming. Fed Chairman Jerome Powell sounded a bit more dovish in his testimony to Congress, and then the CPI inflation report for June came in lower than expected. It is very nice to see 30-yr mortgage rates moving below 7%!
Inventory keeps rising. For the week ended June 29, the nationwide inventory of homes for sale was up 38% year-over-year, with new listings rising 11% YoY.
‘Jobs week’ delivered conflicting trends
First, the JOLTs survey (Job Openings and Labor Turnover) showed that job openings rose to 8.1 million in May. But the month-over-month increase was only the result of a large downward revision (-140,000 jobs) to the April job openings data. The hires and quits rate was basically unchanged. [Bureau of Labor Statistics]
Next came ADP’s employment report, where private (non-government) jobs growth slowed for the third straight month to +150,000 in June. That was slightly below expectations. 40% of the job gains came from the leisure & hospitality industry. [ADP]
Finally we got the big BLS jobs report. The Establishment Survey (businesses + gov’t) showed that the US added 206,000 jobs in June, slightly above expectations. But the job gains reported for May and April were revised down by a combined 111,000. That’s big. How big? The initial estimate for job gains in April was 175,000. The final number is 108,000. [BLS]
Additionally, the separate Household Survey (individuals) saw the unemployment rate (“UR”) rising to 4.1%. A year ago, the UR was at 3.6%. That may not seem like a big jump, but a 50 basis points (0.5%) increase in the UR has historically been a very reliable recession indicator. [BLS]
Home price growth slows, but stays robust. On CoreLogic’s numbers, home prices rose 0.6% month-over-month in May (was +1.1% MoM in April). The data giant is now predicting 3% price growth over the next 12 months. [CoreLogic]
Jerome Powell’s testimony to Congress. While the Fed Chairman remained balanced in his comments, he did sound a bit more dovish: “Reducing policy restraint too late or too little could unduly weaken economic activity and employment.” [Federal Reserve]
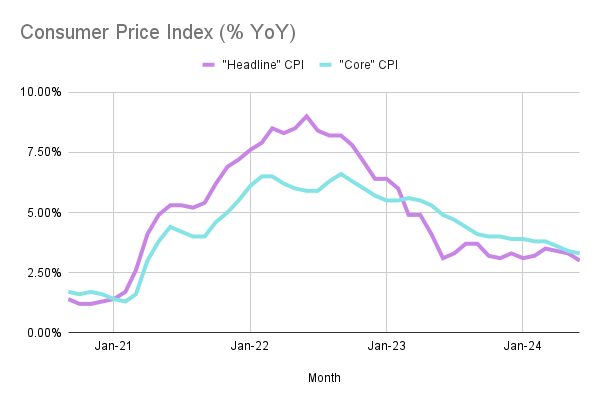
Great news on CPI. The “headline” CPI (Consumer Price Index = inflation) for June declined 0.1% month-over-month, and the “core” CPI (excluding food & fuel) rose only 0.1% MoM. Both were better (that is, lower) than expected, meaning that annual “headline” inflation dropped to 3.0% YoY and annual “core” inflation eased to 3.3% YoY. [Source: BLS]
 Where Are We Now?
So many numbers are thrown around in the media that it’s not always easy to understand what’s happening in a historical context. Hopefully, this provides perspective.
Keep in mind
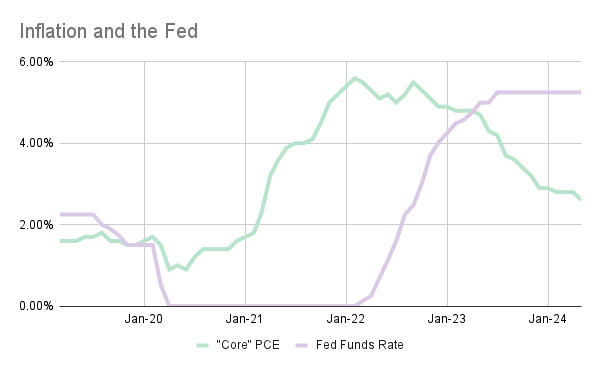
- The Fed started hiking rates in March 2022, and only stopped tightening in July 2023, having lifted short-term interest rates by 525 basis points or 5.25%.
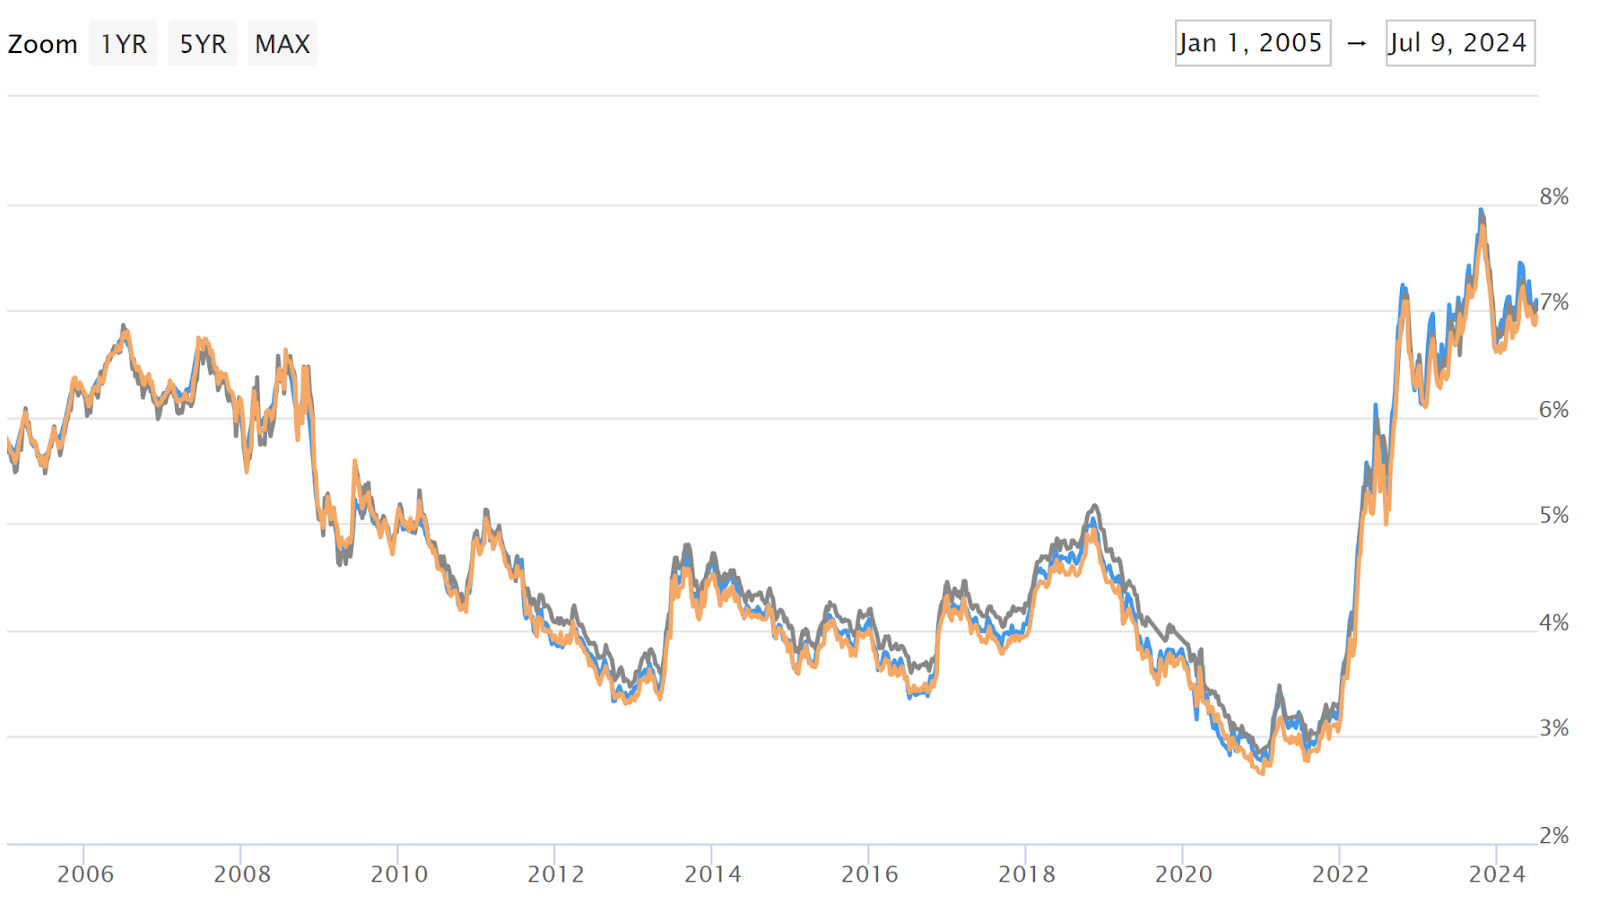
- Average 30-yr mortgage rates started moving aggressively upward a bit earlier (in January 2022) and only peaked (at just over 8%) in October 2023.
- “Core” PCE (the Fed’s favorite inflation gauge) peaked at 5.6% in February 2022, and had dropped to 2.6% by May 2024.
I: Inventory
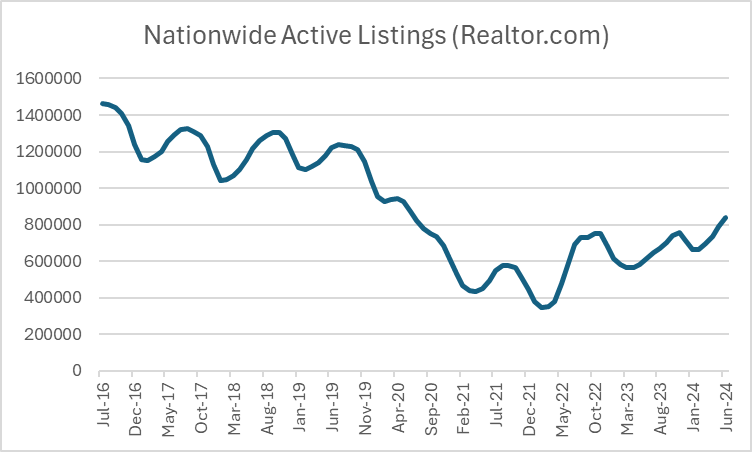
The active inventory of homes for sale (excluding homes under contract) was up 37% year-over-year in June 2024 (yay!), but it was still down ~32% compared to pre-pandemic (boo!). So is the inventory situation good or bad? I’d say ‘improving from a low level.’
Recognizing the seasonality of inventory levels, let’s just look at June. Keep in mind that the huge inventory drawdown happened during the first year of the pandemic (March 2020-March 2021). At 840K units of active inventory, we’re basically back to June 2020 levels, but still 30% below June 2019 and June 2018 levels.
Active Inventory (Realtor.com)
June 2024: 840K
June 2023: 614K
June 2022: 574K
June 2021: 492K
June 2020: 871K
June 2019: 1.2 Million
June 2018: 1.2 Million
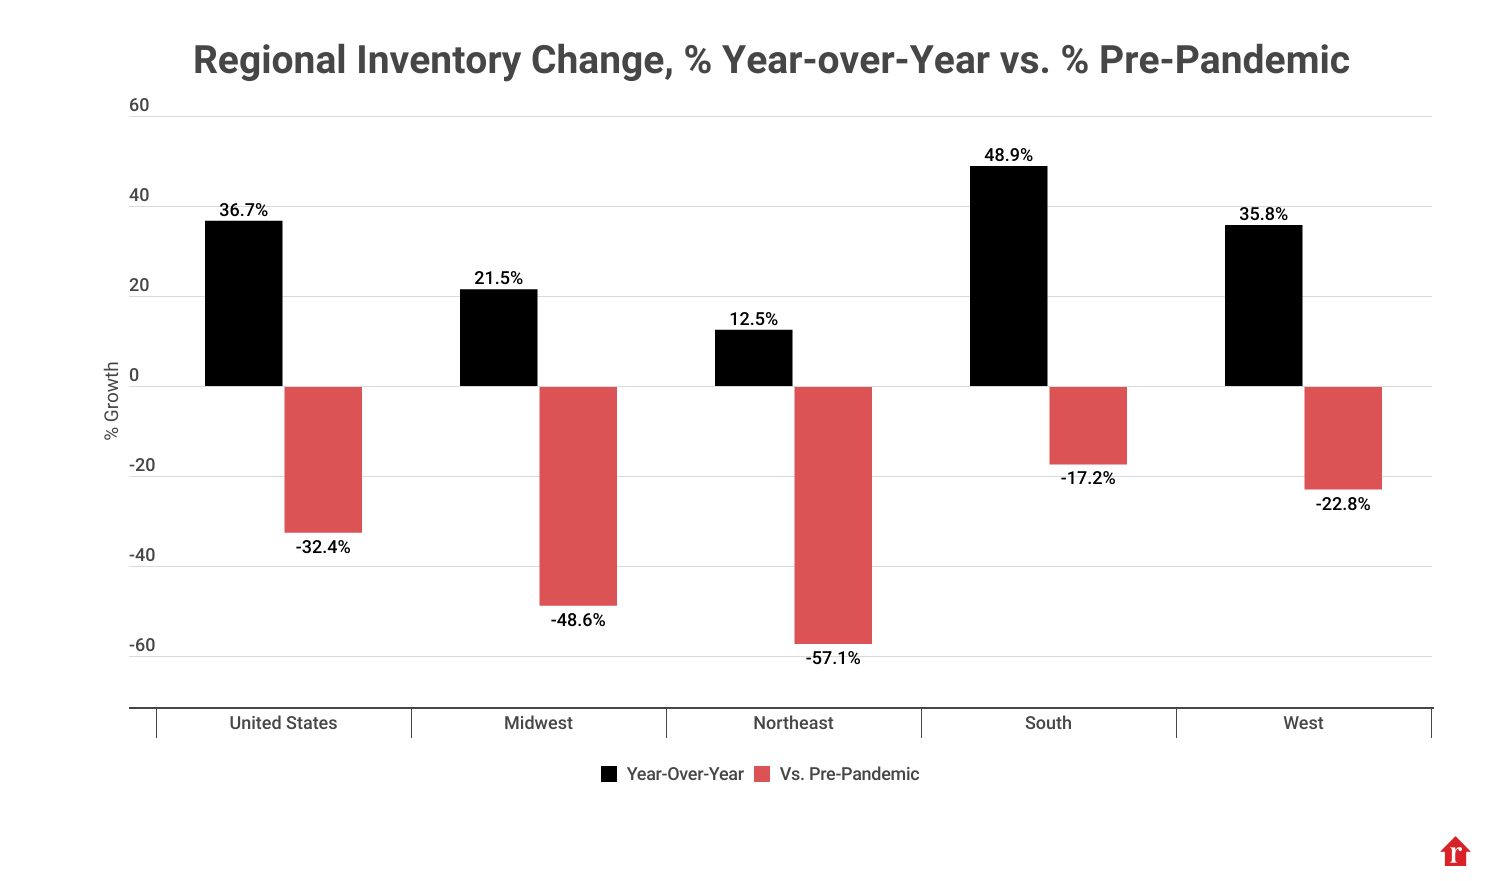
However, as I’ve written about in previous issues of Talking Points, most of the inventory recovery has come from a few states — chiefly Florida and Texas. How much? In June 2024, 30% of nationwide active inventory came from those two states! Florida’s active inventory in June 2024 was about 0.4% above its June 2019 levels. Texas’ active inventory in June 2024 was about 4.6% above its June 2019 levels.
That means, of course, that the inventory situation in much of the rest of the country is still quite tight. How tight? Look at the bar chart below. Active inventory in the Midwest region is still 49% below pre-pandemic levels, and active inventory in the Northeast is still 57% below pre-pandemic levels.
II: Home Prices
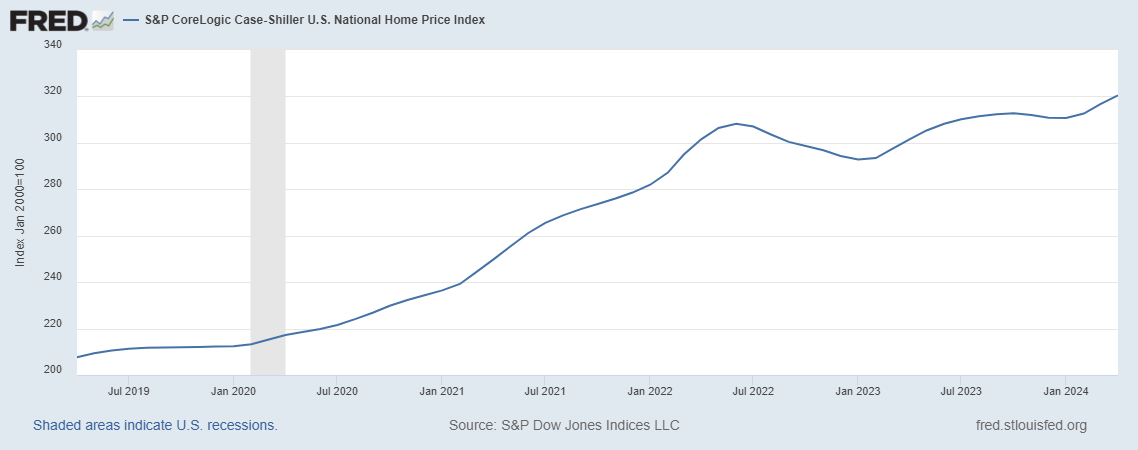
Since the end of 2019 (pre-pandemic), national home prices have risen 51% according to the Case-Shiller index. Between June 2022 and January 2023, they dropped 5%. But the index was back to setting new highs by June 2023. Since that January 2023 mini-trough, home prices have risen 9%.
It’s worth noting, however, that not all cities have fully recovered from the late 2022 home price correction. Two years later, San Francisco’s home price index is still 7.8% below its mid-2022 peak. The same goes for Seattle (-5.9%), Portland (-3.8%), Denver (-3.6%), Phoenix (-3.6%), Dallas (-1.9%) and Las Vegas (-1.1%).
S&P CoreLogic Case-Shiller National Home Price Index
S&P CoreLogic Case-Shiller San Francisco Home Price Index
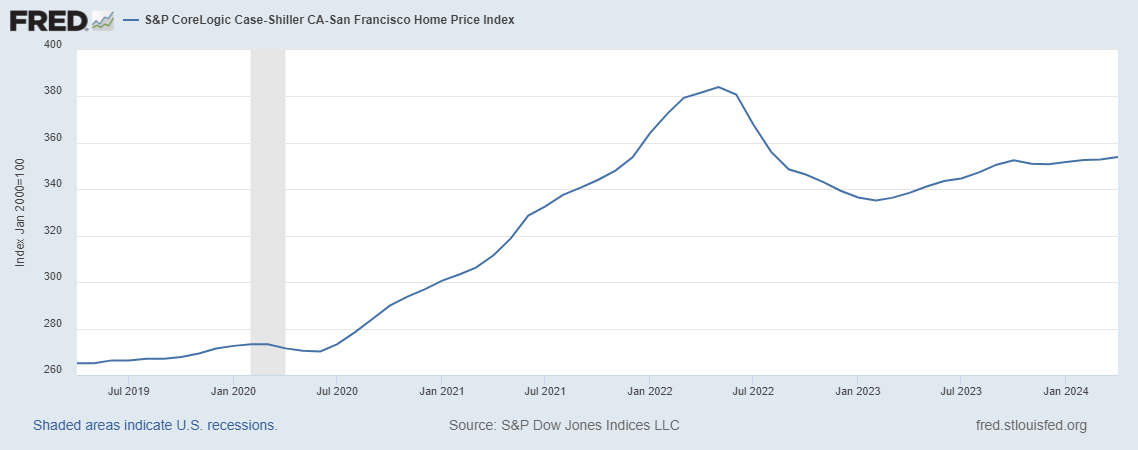
And there are some cities where prices are falling today. Can you guess where? Mostly in the South (which includes Florida and Texas), where prices soared during the pandemic and inventory levels have already recovered to well above pre-pandemic levels.
III: Existing Home Sales
Most forecasters (including me) expected more of a rebound in existing home sales in 2024. In 2023, 4.1 million existing homes changed hands, a level not seen since 2008 (which was effectively the trough after the housing crisis). At the beginning of the year, the NAR forecasted 4.5 million existing home sales in 2024. That was recently lowered to 4.26 million, and even achieving that could be a struggle if mortgage rates don't move sharply lower.
The positive spin to all this is that every year we have existing home sales below 5 million units is just “compressing the spring” further. Eventually, we’re going to have a big snapback. That’s why I’d welcome lower home prices, not just lower mortgage rates. Affordability must be addressed before transaction volumes can normalize.
Average 30-yr mortgage rates (Mortgage News Daily)
 MBS Highway Housing Survey for July 2024
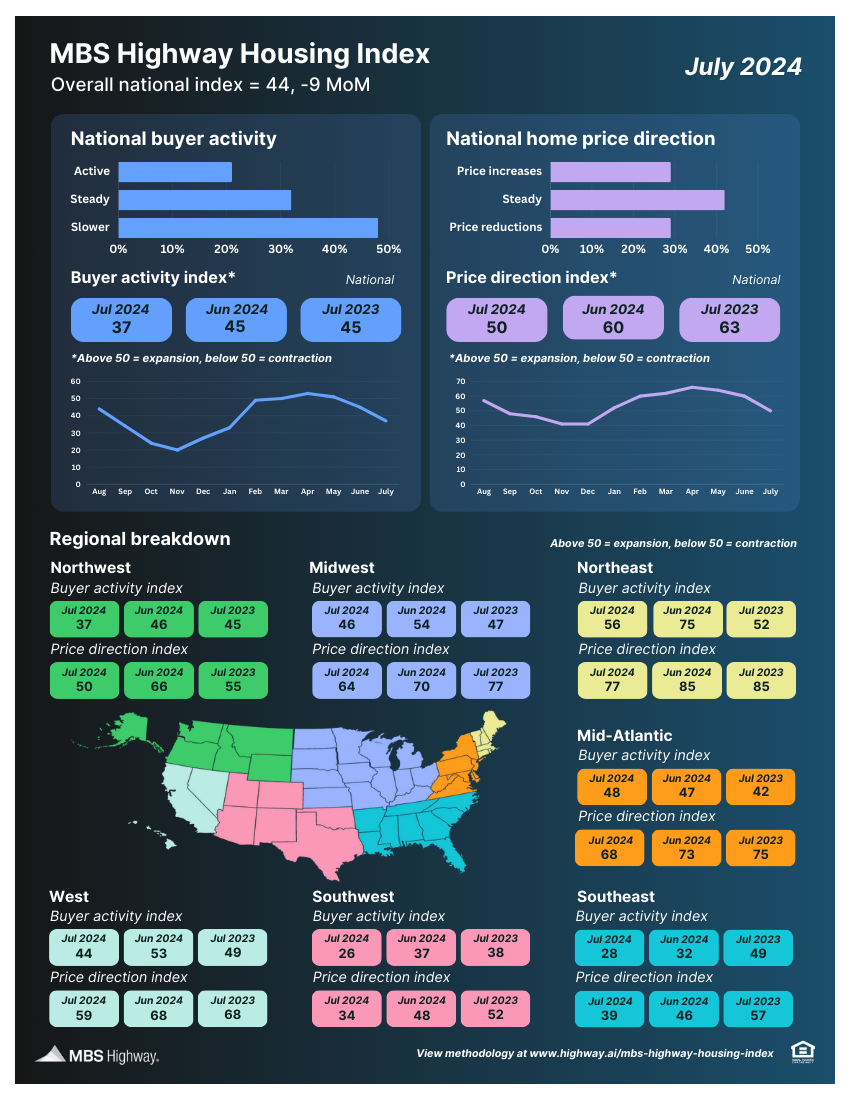
The MBS Highway National Housing Index dropped 9 points in July 2024 to 44, as buyer activity levels fell across the nation. We’re well into summer, but 7% mortgage rates and still-rising home prices have put a winter chill on transaction volumes.
- The national Buyer Activity sub-index dropped 8 points to 37 in July 2024, after having dropped 6 points to 45 in June 2024. In July 2023, the Buyer Activity sub-index was at 45.
- Buyer Activity levels declined in six of the seven regions, with only the Northeast (56) managing to stay above the 50 breakeven point. The least active regions were the Southeast (28) and Southwest (26).
- The national Price Direction sub-index fell 10 points to 50 — right at the breakeven point. This means that the percentage of respondents seeing price increases (29%) exactly matched those seeing price reductions. In July 2023, the national Price Direction sub-index was at 63.
- All seven regions saw their Price Direction sub-indexes move lower, but five out of the seven remained at or above 50. The strongest home price momentum was in the Northeast (77) and Mid-Atlantic (68). The weakest was in the Southeast (39) and Southwest (34).
 Mortgage Market
Average 30-year mortgage rates have ranged between 7.00–7.15% for the last few weeks. While the May PCE report (flat headline inflation, +0.1% “core” growth) was very positive for the bond markets and mortgage rates, ‘jobs week’ delivered mixed messages.
Current odds on Fed rate cuts at upcoming FOMC meetings below. Keep in mind that the US Presidential election is on November 5.
- July 31: 9% (down from 10% two weeks ago)
- Sept 18: 93% (up from 62% two weeks ago)
- Nov 7: 97% (up from 75% two weeks ago)
- Dec 18: 99% (was 93% two weeks ago)
 They Said It
“Buyers are balking at 7% mortgage rates and record home prices (in many markets). The Fed holds the key that could unlock both buyers and sellers — rate cuts — but it remains focused on lagging and flawed measures of inflation and employment.” — Barry Habib, MBS Highway’s Founder and CEO.
“Persistently stronger home price gains this spring continue in markets where inventory is well below pre-pandemic levels, such as those in the Northeast. Also, markets that are relatively more affordable, such as those in the Midwest, have seen healthy price growth this spring. On the other hand, markets with notable inventory increases, including those in Florida and Texas, continue to see annual deceleration that is pulling prices below numbers recorded last year.” — Dr. Selma Hepp, CoreLogic’s Chief Economist
Post: Thoughts on my 1031 re-invest strategy?
- Real Estate Broker
- Greater Charlotte NC and Charleston, SC areas
- Posts 105
- Votes 58
Tyler, I would like more info on the passive 1031 fund...
Post: Looking For A High Yield Real Estate Investment? Now Accepting Accredited Investors!
- Real Estate Broker
- Greater Charlotte NC and Charleston, SC areas
- Posts 105
- Votes 58


Post: Looking For A High Yield Real Estate Investment? Now Accepting Accredited Investors!
- Real Estate Broker
- Greater Charlotte NC and Charleston, SC areas
- Posts 105
- Votes 58
Fellow Investors:
If you are looking for a high-yield investment to diversify your portfolio that outperforms most REITS or the stock market, we have some exciting programs available that you may want to check out!
BRD Land & Investments, based out of the Charlotte MSA, has two fantastic options for Accredited Investors. We work with Investors to raise capital to fund land projects for large, national builders to develop and build their communities- like D.R. Horton, NVR/Ryan Homes, Lennar, Taylor Morrison, Meritage Homes, among others. BRD currently has over 1.2 billion in 45,000 lots (with 35,000 under contract), scattered across NC, SC, GA, FL, TN and TX.
BRD Land & Investment currently has two options for investment:
1.) Invest in a promissory note that works to use capital to purchase raw land to "de-risk" (buying the land, performing soil & geographical testing, re-zoning if needed) to get the land "shove-ready" for these national builders to purchase. These typically provide with a rate of annualized return of between 15 to 20%, depending the amount of capital invested and the time frame chosen by the Investor up front. Generally, the Promissory Notes are for two or three years, or you could choose to keep your investment rolling. The minimum to invest starts at only $100 K.
2.) The other option that BRD offers is called an SPE, which is a 'special purpose entity'. There are usually 4 to 5 projects in one SPE at various stages of development. BRD puts the first 50% upfront, and, by the time that they offer each SPE, the land has already been purchased, tested, re-zoned if needed, and de-risked- so these lots are on point to be "shovel-ready' to sell to builders. These SPE's are not always available, depending on which ones are open for new investment. Generally, there's usually four or five different land projects going on within one SPE, and, when the fund matures, Investors get paid out first. For larger capital Investors, BRD will also open an entire SPE to share 50/50 with them in a separate LLC. The minimum Investment for SPE's is $250 K.
BRD's Executive team consists of past Presidents of Meritage Homes, Taylor Morrison, NVR/Ryan Homes, among others, and they personally know all of the players/builders. Once an SPE is set up and the land in the project is de-risked and is shovel-ready, BRD reaches out to builders to bid on the land and to submit LOI's (letters of intent), and they choose the builder to sell the project to, out of multiple bids received. Since the Executive Team and their Independent Consultants have all worked for (and have ties with) the national home builders, they already know what the builders are generally willing to pay per project. The return on investment for these SPE's is between 20 to 25%, in an indexed fund with BRD Land & Investments also investing the first 50% in the fund. The SPEs pay 20% for the first 12 months and 24% after 2 years and one day. They expect to have 100,000+ lots next year.
If you have any questions or would like to request more detailed information, please reach out to me, and I'll be happy to share an easy-to-follow PDF on the BRD process (don't see a place on the Forum to attach a PDF).
Happy Investing!
Post: Carolinas Latest Real Estate Market Data and Statistics as of mid June, 2024
- Real Estate Broker
- Greater Charlotte NC and Charleston, SC areas
- Posts 105
- Votes 58
Harrisburg, NC is in Cabarrus county. Our system only covers the area by county, not by city in Harrisburg (it's too small). Here's the info for the entire Cabarrus county region (which includes Harrisburg). I am able to do a CMA (Comparative Market Analysis) for you with specifics based on what you are looking for, however- I just need square footage, zip code, number of bedrooms and bathrooms, neighborhood, year built and age of home/upgrades and improvements to compare. Let me now if you'd like for me to do that for you (just send me an email with specifics) and I'll drill it down for you! :) Kristen
Cabasrrus county:
Local Market Update for May 2024
Key Metrics 2023 2024 Percent Change Thru 5-2023 Thru 5-2024 Percent Change
New Listings 310 371 + 19.7% 1,416 1,613 + 13.9%
Pending Sales 299 276 - 7.7% 1,400 1,291 - 7.8%
Closed Sales 296 290 - 2.0% 1,153 1,172 + 1.6%
Median Sales Price* $368,000 to $395,000 + 7.3% $360,000 $390,750 + 8.5%
Average Sales Price* $398,575 $426,621 + 7.0% $380,709 $427,450 + 12.3%
Percent of Original List Price Received* 97.7% 98.2% + 0.5% 95.9% 97.8% + 2.0%
List to Close 82 79 - 3.7% 95 88 - 7.4%
Days on Market Until Sale 34 26 - 23.5% 45 35 - 22.2%
Cumulative Days on Market Until Sale 37 27 - 27.0% 48 38 - 20.8%
Average List Price $433,005 $476,998 + 10.2% $432,125 $452,474 + 4.7%
Inventory of Homes for Sale 354 469 + 32.5% -- -- --
Months Supply of Inventory 1.4 2.0 + 42.9% -- -- --
* Does not account for sale concessions and/or downpayment assistance. | Percent changes are calculated using rounded figures and can sometimes look extreme due to small sample size.
Entire Canopy MLS Area —
Cabarrus County —
Current as of June 7, 2024. All data from Canopy MLS, Inc. Report provided by the Canopy Realtor® Association. Report © 2024 ShowingTime Plus, LLC.
A RESEARCH TOOL PROVIDED BY THE CANOPY REALTOR® ASSOCIATION
FOR MORE INFORMATION, CONTACT A REALTOR®
May
Cabarrus County
May Year to Date
North Carolina
$150,000
$200,000
$250,000
$300,000
$350,000
$400,000
1-2014 1-2015 1-2016 1-2017 1-2018 1-2019 1-2020 1-2021 1-2022 1-2023 1-2024
Post: Carolinas Latest Real Estate Market Data and Statistics as of mid June, 2024
- Real Estate Broker
- Greater Charlotte NC and Charleston, SC areas
- Posts 105
- Votes 58
Quote from @Rahma Z.:
What Are your thoughts on the Harrisburg NC market? Do you think it'll continue on an upward trend or do you think pricing and values are going to give a little and maybe plateau? Sometimes it's hard to justify what seems to be overinflated pricing on some of the houses in that area so would love to hear your thoughts or maybe even see the stats on that market. TIA!