Many people are waiting on the sideline, letting their capital ride where it is. The consequences of this inaction depend on where the money is parked. One of the big factors is inflation.
What is the impact if you leave $1M in cash? At 8% inflation, you will lose: $1,000,000 x 8% = $80,000/Yr. or $6,667/Mo. in buying power.
If it is in stocks, YoY the market is down 21%. Your equity decreased by more than $200k, plus you lost $80,000 due to inflation.
CD or Treasury Bills? The best they can do is 4%; you’d lose $1,000,000 x (8% - 4%) = $40,000 when you see your cash again in a year. Then you will have to look for options again.
What if you buy a good property in a good location (such as Las Vegas) for $400,000? You’d have a long-term income stream that increases faster than inflation and appreciates faster than inflation. Below is a simplistic worksheet.

Over a 5-year hold period, IRR is 15%.
Does anybody see a better option to deploy cash in today’s environment?
@Eric Fernwood
I look at things very differently. I don’t look at high inflation as losing money, it impacts buying power but money is not leaving my account.
The way I look at it is risk free rate of return vs risk adjusted rate of return.
If I can get 4% from fed what risk am I taking to get 8-10%. There are companies out there with dividends that will yield you 8-10%.
As it relates to your real estate investment scenario, I think 8% appreciation next five years is aggressive since we have never had on record five straight years of that type of growth especially when we are headed toward a recession.
@Eric Fernwood
I look at things very differently. I don’t look at high inflation as losing money, it impacts buying power but money is not leaving my account.
The way I look at it is risk free rate of return vs risk adjusted rate of return.
If I can get 4% from fed what risk am I taking to get 8-10%. There are companies out there with dividends that will yield you 8-10%.
As it relates to your real estate investment scenario, I think 8% appreciation next five years is aggressive since we have never had on record five straight years of that type of growth especially when we are headed toward a recession.
Hello @Chris Seveney,
Thank you for sharing your views.
We do see things differently. While you are not "losing" dollars from your account, more and more dollars are leaving your account to buy the same goods and services. Unless your income increases faster than inflation, you will run out of money or be forced to drop your living standard.
On your statement, "we have never had on record five straight years of that type of growth." Below are Las Vegas rent growth and appreciation since 2013 for our target property segment. The average appreciation since 2013 is over 15%. Rent growth is over 8%.

Hello @Chris Seveney,
Thank you for sharing your views.
We do see things differently. While you are not "losing" dollars from your account, more and more dollars are leaving your account to buy the same goods and services. Unless your income increases faster than inflation, you will run out of money or be forced to drop your living standard.
On your statement, "we have never had on record five straight years of that type of growth." Below are Las Vegas rent growth and appreciation since 2013 for our target property segment. The average appreciation since 2013 is over 15%. Rent growth is over 8%.

Hello @Jay Hinrichs,
Today’s market is not like in 2008. Below is a comparison.
2008:
Today:
So, I doubt we will see a significant downturn in the Las Vegas market. But what if one does occur? Below is what happened to our clients and our income during times of economic stress:
While I see little likelihood of a crash due to higher interest rates and fewer buyers, we are seeing an increase in inventory and finding some excellent deals. Inventory is leveling out at about 3.5 months. A balanced market in Las Vegas is six months, so it is still a seller’s market.
On the future…. Predicting anything beyond yesterday is guessing. Is 8% the right number? I have no idea. Below are some of the Las Vegas market drivers.
California - California seems to be doing all it can to force people and companies out of California. As long as this continues, Las Vegas investments will do well.
Cheap and reliable energy - California commercial energy is $0.246/KwH, and Nevada is $0.083/KwH. In addition, Las Vegas has dual electricity sources (California and Hoover Dam), resulting in high reliability.
If you adjust for inflation, prices are still below peak 2006/2007 prices. So, prices are not overheated.
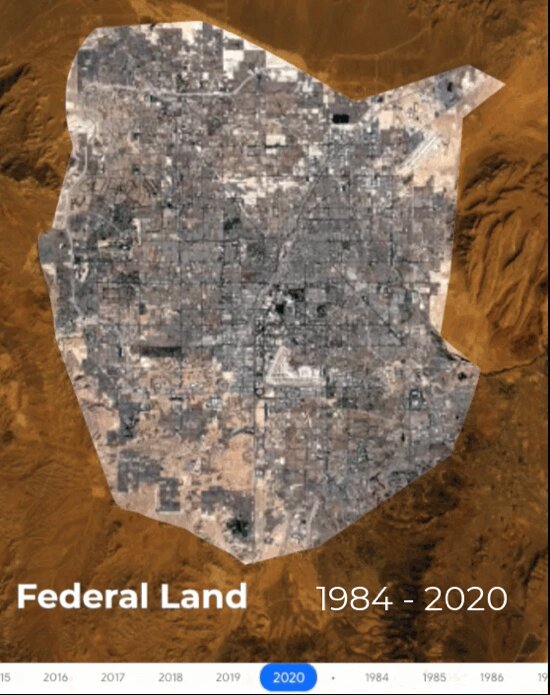
The combination of an increasing population and limited room for expansion almost ensures rents and prices will increase.
What is your prediction of what is likely to happen?
Many people are waiting on the sideline, letting their capital ride where it is. The consequences of this inaction depend on where the money is parked. One of the big factors is inflation.
What is the impact if you leave $1M in cash? At 8% inflation, you will lose: $1,000,000 x 8% = $80,000/Yr. or $6,667/Mo. in buying power.
If it is in stocks, YoY the market is down 21%. Your equity decreased by more than $200k, plus you lost $80,000 due to inflation.
CD or Treasury Bills? The best they can do is 4%; you’d lose $1,000,000 x (8% - 4%) = $40,000 when you see your cash again in a year. Then you will have to look for options again.
What if you buy a good property in a good location (such as Las Vegas) for $400,000? You’d have a long-term income stream that increases faster than inflation and appreciates faster than inflation. Below is a simplistic worksheet.

Over a 5-year hold period, IRR is 15%.
Does anybody see a better option to deploy cash in today’s environment?
Your calculation is bit off.
IRR 15% can only be achieved with cheap money policy.
In today's environment, actual IRR is 4-5% at best.
Best reward/risk is buying treasury or put into 4% CD. Even real estate is losing money now for inflation.
Hello @Jay Hinrichs,
Today’s market is not like in 2008. Below is a comparison.
2008:
Today:
So, I doubt we will see a significant downturn in the Las Vegas market. But what if one does occur? Below is what happened to our clients and our income during times of economic stress:
While I see little likelihood of a crash due to higher interest rates and fewer buyers, we are seeing an increase in inventory and finding some excellent deals. Inventory is leveling out at about 3.5 months. A balanced market in Las Vegas is six months, so it is still a seller’s market.
On the future…. Predicting anything beyond yesterday is guessing. Is 8% the right number? I have no idea. Below are some of the Las Vegas market drivers.
California - California seems to be doing all it can to force people and companies out of California. As long as this continues, Las Vegas investments will do well.
Cheap and reliable energy - California commercial energy is $0.246/KwH, and Nevada is $0.083/KwH. In addition, Las Vegas has dual electricity sources (California and Hoover Dam), resulting in high reliability.
If you adjust for inflation, prices are still below peak 2006/2007 prices. So, prices are not overheated.
The combination of an increasing population and limited room for expansion almost ensures rents and prices will increase.
What is your prediction of what is likely to happen?
@Eric Fernwood
Thank you for the information.
However, I see both housing and rental market in Las Vegas has softened a lot.
Many rental prices have dropped 20% from the peak. Many “good deals” house price have dropped 15% to 30% from the peak already.
In today’s declining market, it is very difficult for me to see an 8% appreciation in the next few years.
This year is just the beginning, looks like still have a long way to bottom out.
I don’t want to catch a falling knife.
Hello @Jay Hinrichs,
Today’s market is not like in 2008. Below is a comparison.
2008:
Today:
So, I doubt we will see a significant downturn in the Las Vegas market. But what if one does occur? Below is what happened to our clients and our income during times of economic stress:
While I see little likelihood of a crash due to higher interest rates and fewer buyers, we are seeing an increase in inventory and finding some excellent deals. Inventory is leveling out at about 3.5 months. A balanced market in Las Vegas is six months, so it is still a seller’s market.
On the future…. Predicting anything beyond yesterday is guessing. Is 8% the right number? I have no idea. Below are some of the Las Vegas market drivers.
California - California seems to be doing all it can to force people and companies out of California. As long as this continues, Las Vegas investments will do well.
Cheap and reliable energy - California commercial energy is $0.246/KwH, and Nevada is $0.083/KwH. In addition, Las Vegas has dual electricity sources (California and Hoover Dam), resulting in high reliability.
If you adjust for inflation, prices are still below peak 2006/2007 prices. So, prices are not overheated.
The combination of an increasing population and limited room for expansion almost ensures rents and prices will increase.
What is your prediction of what is likely to happen?
>2008 crash - Zero decline in rent and zero vacancies.
Rents crashed. The average Las Vegas rent in 2008 was $1276 and fell to $1079 in 2013. as of 2019, the rents still had not fully recovered. Vacancy rate from 2008 to 2010 increased by 5% hitting a pathetic 14.3% (meaning 1 out of every 7 units was vacant). False numbers cause me to question every aspect of the post.
The reality is Las Vegas was heavily impacted by the Great Recession. Home values fell, rents fell, vacancy rates rose. That is a trifecta of impacts.
Residential Rent Statistics for Las Vegas Nevada | Department of Numbers (deptofnumbers.com)
Las Vegas, NV: industrial vacancy rates 2008-2018 | Statista
>What is your prediction of what is likely to happen?
I certainly would not do a pro forma depicting 8% appreciation. I would not have used this high a number in 2013 and certainly would not use this high a number today. Aggressive pro formas are how investors get in financial trouble. I want my pro formas to be conservative. I hope to exceed my pro forma and will be disappointed with my pro forma if I underperform it without a huge unexpected event (such as the Great Recession).
In my market, my pro forma is showing 0% appreciation in the next 3 years. It reflects that my market has depreciated since May, that the fed has indicated further rate hikes are coming, that the last 10 years has incredible appreciation that cannot continue indefinitely, and that I desire my pro forma to be conservative. My long-term outlook on the appreciation in my market is a little less pessimistic, but what I hope is conservative.
If an investment does not work with conservative numbers, I question if it is a good investment.
Hello @Dan H.,
I looked into the “Department of Numbers” site and the Statista site you referenced. They both appear to average all properties in Las Vegas. Furthermore, Statista states: “Vacancy rate of industrial property in Las Vegas, Nevada from 2008 to 2018”. Industrial properties are cyclic and have no relationship to the narrow segment of residential properties I target. Plus, the latest data they cite is from 2018.
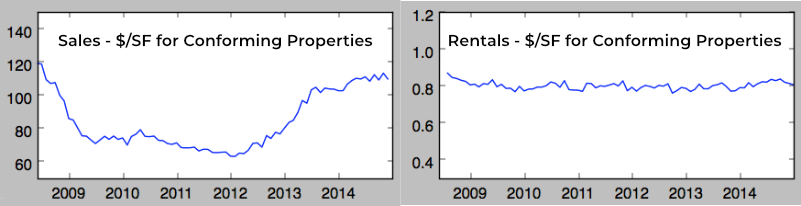
Neither site is current or relevant to a specific narrow residential segment I target. Also, they are using "averages" for Las Vegas. We do not buy "average" properties in "average" locations in Las Vegas. We've focused on a narrow tenant pool segment for the last 15+ years. The tenant pool we target has proven to be very reliable. Below is a chart showing how the rent and prices fared for my target segment after the 2008 crash. The data is pulled from MLS. As you can see, the prices plummeted as other properties, but rents for our target segment were virtually unchanged. C Class and many B Class properties did not perform nearly as well.
"I see both housing and rental market in Las Vegas has softened a lot."
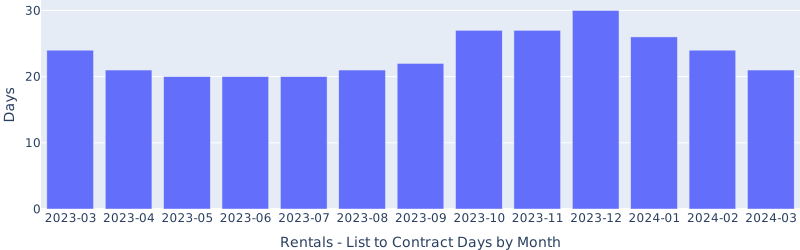
I can't speak of the entire Las Vegas rental market. We target a narrow tenant pool segment through the properties we select. Below are actual 13-month trailing statistics for the segment we target. The data is from the MLS.
Rentals - List to Contract Days by Month
Pre-COVID average time on the market for the properties we target was about 3-4 weeks, which is where we are today.
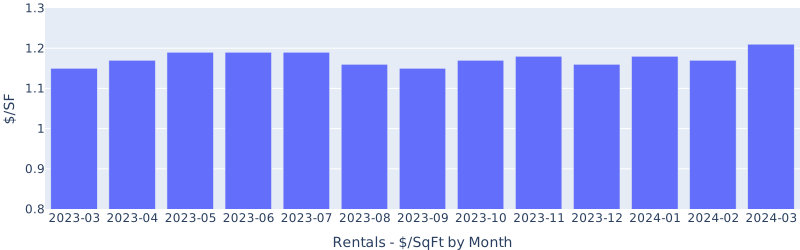
Rentals - Median $/SF by Month
October rents were up from September. YoY rents are up 5%. We are in the slowest rental season of the year, and I expect rents to remain soft for the remainder of the year.
We expect rents to increase next year due to the number of people moving to Las Vegas, plus many would-be buyers are forced into the rental market due to high-interest rates.
"Many rental prices have dropped 20% from the peak. Many “good deals” house prices have dropped 15% to 30% from the peak already."
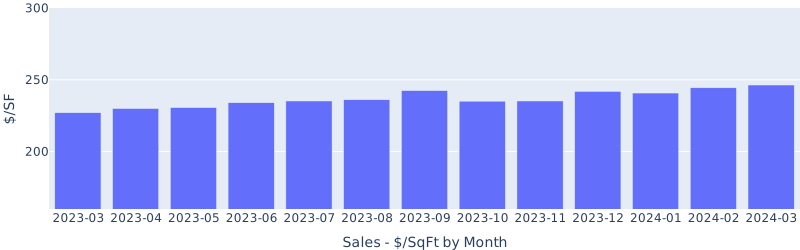
We have not seen this. What segment are you referring to? Below is the actual data for the segment we target.
Sales - Median $/SF by Month
Prices dropped again in October. I believe this is a combination of high-interest rates, economic uncertainty, and our normal seasonal trend. Prices are down 12% from the June peak for our segment. We see nothing like 15% to 30%, as you stated.
"In today’s declining market, it is difficult for me to see an 8% appreciation in the next few years."
There are a lot of unique variables in Las Vegas, including land shortage, rising population, over $22B in new construction, low energy costs, pro-business government, no state income taxes, and low operating costs. Is an average 8% appreciation reasonable for the next five years? No one knows. The segment I targeted appreciated 158% from 2013 - 2019 pre-COVID (see chart in my previous post), or an average of 22%+ a year, excluding the COVID effect. I recall a massive wave of doom and gloom prediction for “Las Vegas is finished” at the outbreak of COVID in the spring of 2020 when I held an unpopular opinion that Las Vegas would be fine. I look at market drivers, not people’s opinions or emotions.
"This year is just the beginning, looks like still have a long way to bottom out."
I agree that many locations will see prices fall significantly. The housing market is the most interest-rate-sensitive segment of the economy. However, the overall inventory for Las Vegas is 3.5 months at this moment (from the MLS for all property types). It's hard for me to see a significant price drop with 3.5 months of inventory in the market. Also, if interest rates fall (expected by many analysts), will prices start rising again? I believe so.
“In my market, my pro forma is showing 0% appreciation in the next 3 years.”
Which market are you in?
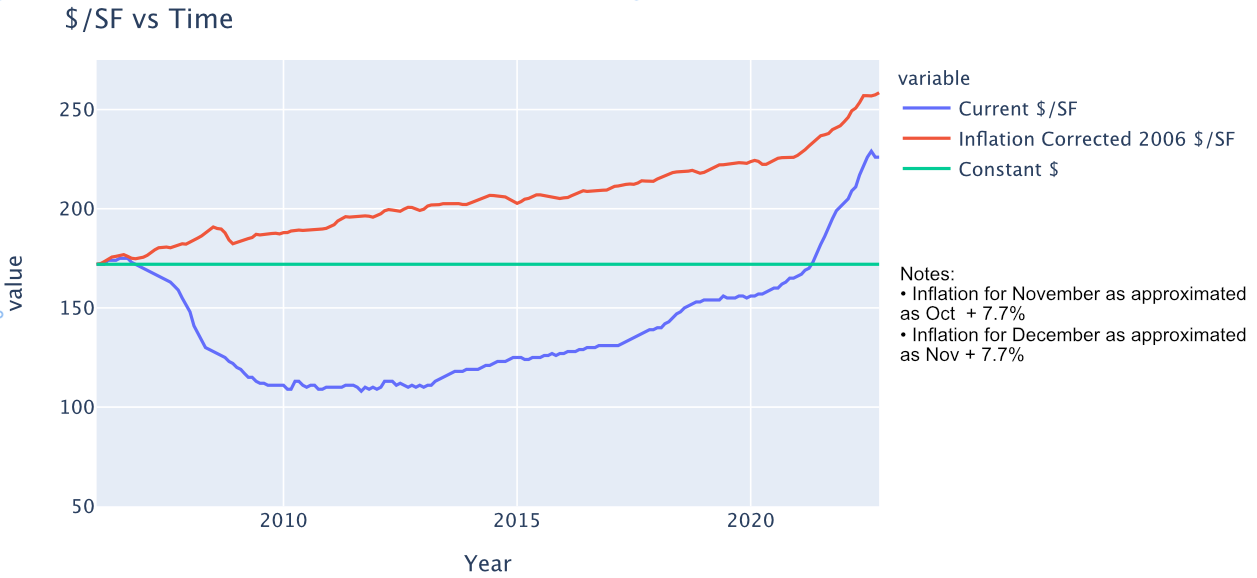
Also, current Las Vegas prices are below the 2006/2007 peak if you adjust for inflation.
Dan, projections are just that, projections. I have no crystal ball, and neither do you. I do my best to project based on the unique combination of variables in Las Vegas for the narrow segment we target. Will I be right or wrong, ask me again in 5 years.
@Eric Fernwood You’re missing quite a few items from expense deductions, including capex and inflation adjustments. You capture all upside in your simple calc an no downside.
Hello Allan,
In your statement, "You're missing quite a few items from expense deductions, including Capex and inflation adjustments." You are correct. However, if I used a real-world spreadsheet, it would be too complex for making my point of the post. That is why I prefaced the worksheet with the statement, "Below is a simplistic worksheet."
The formulas we use for return calculations are below:
You will note that we do not include tax savings, maintenance, and vacancy factors. Some comments, starting with maintenance cost.
Our population's average annual maintenance is about $350/Yr. The reason it is so low is due to several factors, including:
Below is a typical property we target.
There is not a lot to maintain with the properties we select.
The average stay of the tenant pool we target is over 5 years, so a reasonable annual vacancy cost is about $500/Yr.
If you add vacancy cost and maintenance cost, it represents between 2% and 4% of annual rent. Depending on your tax situation, depreciation increases the effective return by 3% to 6%. So, we do not include tax savings, maintenance, or vacancy costs in our initial calculations.
Capex is a popular phrase but only applies to commercial properties. For example, if you have a warehouse, you include a Capex maintenance provision for redoing the parking lot periodically.
In a way, residential properties are similar to commercial properties. Maintenance has two components. Base maintenance (dripping faucets, etc.), which is generally covered by monthly cash flow. Then you have high-priced items, like a water heater or an AC compressor. For such items, maintenance provisions are based on the remaining useful life of individual units. There is no general way to estimate maintenance costs that has any basis in reality. In summary, my intent with the spreadsheet was not to provide a comprehensive financial assessment. It was to point out a single factor.
@Eric Fernwood You’re missing quite a few items from expense deductions, including capex and inflation adjustments. You capture all upside in your simple calc an no downside.
Hello Allan,
In your statement, "You're missing quite a few items from expense deductions, including Capex and inflation adjustments." You are correct. However, if I used a real-world spreadsheet, it would be too complex for making my point of the post. That is why I prefaced the worksheet with the statement, "Below is a simplistic worksheet."
The formulas we use for return calculations are below:
You will note that we do not include tax savings, maintenance, and vacancy factors. Some comments, starting with maintenance cost.
Our population's average annual maintenance is about $350/Yr. The reason it is so low is due to several factors, including:
Below is a typical property we target.
There is not a lot to maintain with the properties we select.
The average stay of the tenant pool we target is over 5 years, so a reasonable annual vacancy cost is about $500/Yr.
If you add vacancy cost and maintenance cost, it represents between 2% and 4% of annual rent. Depending on your tax situation, depreciation increases the effective return by 3% to 6%. So, we do not include tax savings, maintenance, or vacancy costs in our initial calculations.
Capex is a popular phrase but only applies to commercial properties. For example, if you have a warehouse, you include a Capex maintenance provision for redoing the parking lot periodically.
In a way, residential properties are similar to commercial properties. Maintenance has two components. Base maintenance (dripping faucets, etc.), which is generally covered by monthly cash flow. Then you have high-priced items, like a water heater or an AC compressor. For such items, maintenance provisions are based on the remaining useful life of individual units. There is no general way to estimate maintenance costs that has any basis in reality. In summary, my intent with the spreadsheet was not to provide a comprehensive financial assessment. It was to point out a single factor.
I won't dispute your specific opex assumptions since you seem to have a streamlined asset selection process. However, most novice investors on this site won't have operating efficiencies that you realize, thus it's more appropriate to advertise a 30-40% opex factor so they have a more realistic assessment of cash flow.
I generally agree with your notion that residential properties mainly have two categories of maintenance, large and small. However, capex is still a concept folks should understand for calculating cash flow/reserve and depreciation/tax purposes. To ignore roof, appliance and other large mechanical replacements in amortized annual expense estimates leads to unrealistic yield assessments.
I'm diverging from the intent of your original post, but simplified analysis becomes misleading and distracting. Similar to the response of others, I also don't agree with the premise that buying real assets in this environment is the best way to deploy capital. I have a T-bill ladder that maintains liquidity when I need it, but the risk vs yield relationship in this environment has me on the sideline in most markets.
Hello @Dan H.,
I looked into the “Department of Numbers” site and the Statista site you referenced. They both appear to average all properties in Las Vegas. Furthermore, Statista states: “Vacancy rate of industrial property in Las Vegas, Nevada from 2008 to 2018”. Industrial properties are cyclic and have no relationship to the narrow segment of residential properties I target. Plus, the latest data they cite is from 2018.
Neither site is current or relevant to a specific narrow residential segment I target. Also, they are using "averages" for Las Vegas. We do not buy "average" properties in "average" locations in Las Vegas. We've focused on a narrow tenant pool segment for the last 15+ years. The tenant pool we target has proven to be very reliable. Below is a chart showing how the rent and prices fared for my target segment after the 2008 crash. The data is pulled from MLS. As you can see, the prices plummeted as other properties, but rents for our target segment were virtually unchanged. C Class and many B Class properties did not perform nearly as well.
"I see both housing and rental market in Las Vegas has softened a lot."
I can't speak of the entire Las Vegas rental market. We target a narrow tenant pool segment through the properties we select. Below are actual 13-month trailing statistics for the segment we target. The data is from the MLS.
Rentals - List to Contract Days by Month
Pre-COVID average time on the market for the properties we target was about 3-4 weeks, which is where we are today.
Rentals - Median $/SF by Month
October rents were up from September. YoY rents are up 5%. We are in the slowest rental season of the year, and I expect rents to remain soft for the remainder of the year.
We expect rents to increase next year due to the number of people moving to Las Vegas, plus many would-be buyers are forced into the rental market due to high-interest rates.
"Many rental prices have dropped 20% from the peak. Many “good deals” house prices have dropped 15% to 30% from the peak already."
We have not seen this. What segment are you referring to? Below is the actual data for the segment we target.
Sales - Median $/SF by Month
Prices dropped again in October. I believe this is a combination of high-interest rates, economic uncertainty, and our normal seasonal trend. Prices are down 12% from the June peak for our segment. We see nothing like 15% to 30%, as you stated.
"In today’s declining market, it is difficult for me to see an 8% appreciation in the next few years."
There are a lot of unique variables in Las Vegas, including land shortage, rising population, over $22B in new construction, low energy costs, pro-business government, no state income taxes, and low operating costs. Is an average 8% appreciation reasonable for the next five years? No one knows. The segment I targeted appreciated 158% from 2013 - 2019 pre-COVID (see chart in my previous post), or an average of 22%+ a year, excluding the COVID effect. I recall a massive wave of doom and gloom prediction for “Las Vegas is finished” at the outbreak of COVID in the spring of 2020 when I held an unpopular opinion that Las Vegas would be fine. I look at market drivers, not people’s opinions or emotions.
"This year is just the beginning, looks like still have a long way to bottom out."
I agree that many locations will see prices fall significantly. The housing market is the most interest-rate-sensitive segment of the economy. However, the overall inventory for Las Vegas is 3.5 months at this moment (from the MLS for all property types). It's hard for me to see a significant price drop with 3.5 months of inventory in the market. Also, if interest rates fall (expected by many analysts), will prices start rising again? I believe so.
“In my market, my pro forma is showing 0% appreciation in the next 3 years.”
Which market are you in?
Also, current Las Vegas prices are below the 2006/2007 peak if you adjust for inflation.
Dan, projections are just that, projections. I have no crystal ball, and neither do you. I do my best to project based on the unique combination of variables in Las Vegas for the narrow segment we target. Will I be right or wrong, ask me again in 5 years.
There are quotes in your reply that seem that you are attributing them to me, but they did not come from my post. I will assume this was unintentional.
You consistently take an approach that is aggressive. For example referencing maintenance cap ex that goes back only to 2013 is ignoring that virtually all cost items have expected lifespans in excess of 10 years.
I get you are trying to market a product, but aggressive forecasts are exactly the type of investment that I would warn less experienced investors to avoid. Aggressive includes forecasting future rent increase and appreciation based off the incredible run since 2013, not including cap ex/maintenance in the pro forma, not vacancy in the pro forma and referencing vacancy encountered since 2013 (ironically one year after average vacancy by some references was ~15% in Las Vegas), referencing cap ex/maintenance numbers that have resulted from holds only going back to 2013 when I hope you realize that the large, costly items have longer lifespans than the 9 years.
I also find it ironic that your initial post references a inflation rate that is highest in over 40 years but you are using a 9 year window for the RE comparison. Similar your stock comparison is YOY, but fails to mention S&P lifetime return is almost 10% and significantly more passive than residential RE. As a long term investor, I have less concern about one year performance than the long term return.
I would warn against any pro forma that was based on one of the best eras in RE ever (which is what you are doing).
Good luck
@Eric Fernwood
I was referring to national statistics.
I Recommend checking out Burns Intrinsic Home Value Index - they put out great content
What is the impact if you leave $1M in cash? At 8% inflation, you will lose: $1,000,000 x 8% = $80,000/Yr. or $6,667/Mo. in buying power.
Does anybody see a better option to deploy cash in today’s environment?
Money markets /MF cash funds are paying 2.6% so obviously nobody with that many cents is sitting in cash.
10yr treasury notes are around 4% as you mentioned. These are basically hassle free don't need to lift a finger nap returns.
To get me back into dealing with sellers, agents, tenants, the weather, market cycle/ recession risk etc I need at least 4x the safe nap returns. Not happening right now.
I can lift 1 finger and find good paper securities like utilities and reits near their 52 week low, paying 10% divs with low payout ratios. Easy 10% with upside at the click of a button.
My last apt sale took 5 weeks, 50 pgs of bs and $42k in transfer taxes and title insurance. Would've been $55k more with agents. Too much time and effort and cost and risk for me and RE right now.
I live in central Florida which experienced flooding in areas we've never experienced it before in our memory because of Ian and Nicole. Property insurance premiums have likewise gone up to historic levels if you can find it at all with no end to the increases in sight. There are also corresponding increases in deductibles.
On the flip side, Las Vegas is an island surrounded by desert suffering from a shortage of water caused by growth and a 20-year drought which is not showing any sign of letting up.
Personally, I live by the old adage, it's not the return on my money I'm concerned with, it's the return of my money. In my opinion, currently there are too many unknowns to making investing in any real property anything other than speculation so unless it's an amazingly good deal I'll pass.
btw I think the best,easiest,safest way to make money now is just to buy long term bond or TLT.
I believe the worst is over and bond is very juicy. Riding wave to 4-5% 30YFRM seems fun.
I appreciate all the feedback and comments. Thank you.
It’s obvious that fear is dominating the market. I understand that.
Remember that the most successful investors get greedy when others are fearful (Warren Buffett). But you’ve got to know where to look and how to analyze opportunities without any emotions.
Personally, I do not let cash sit in banks or bonds. I have deployed my investable cash into real estate as I believe I will fare better there in 4-5 years than any other options I can think of. It could be because I have done this (select and monetize properties) hundreds of times, so I have fairly high confidence that the properties I picked will perform well.
Last peak was 2006, and took 6 years to bottom in 2012.
The previous previous peak was 1990, and also took 6 years to bottom in 1996.
This cycle was just peak in March 2022, from the history, it possibly could take 6 years to bottom in 2028.
I highly doubt the bottom would hit in only 8 months in November 2022 now?
There will be many manipulating data to promote continued investing in real estate because they directy benefit from the ongoing sales.
Saw it in the 90's, saw it from 2009-2012.
If you would send me your email address, I'd be glad to send you all the data from MLS that I used to create the charts.
Btw, the clients who invested in 2009-2012 came out like gangbusters.
Hi @Eric Fernwood! Great post here and a lot of healthy discussion.
You asked in your original headline "...how to stop it?"
I'm going to come at this from an entirely different angle. I just spent hours with friends who have been trying to manage single family rentals. For most people it's far more challenging to manage single family rentals than they expect. It's usually not like it is on HGTV though I admit it works out for some people.
Again to your original question, I would say most investors would be most profitable, most safe, and most happy by investing passively in commercial real estate syndications or funds. The goals are principal protection, cashflow and growth are often achieved. The operators are taking the debt in their name, finding the deals (typically off market) and they are rolling with the punches of economic cycles nationally and locally.
Though it's easy to make a mistake in this arena as well, most investors who have a job, a life and a retirement might be happier and better off investing passively. Just my two cents!
Hi @Eric Fernwood! Great post here and a lot of healthy discussion.
You asked in your original headline "...how to stop it?"
I'm going to come at this from an entirely different angle. I just spent hours with friends who have been trying to manage single family rentals. For most people it's far more challenging to manage single family rentals than they expect. It's usually not like it is on HGTV though I admit it works out for some people.
Again to your original question, I would say most investors would be most profitable, most safe, and most happy by investing passively in commercial real estate syndications or funds. The goals are principal protection, cashflow and growth are often achieved. The operators are taking the debt in their name, finding the deals (typically off market) and they are rolling with the punches of economic cycles nationally and locally.
Though it's easy to make a mistake in this arena as well, most investors who have a job, a life and a retirement might be happier and better off investing passively. Just my two cents!