02043 Investment Properties for Sale
Browse homes for sale and investment properties in 02043. Refine your search by price, property type, or more.
Best cash flowing properties in 02043
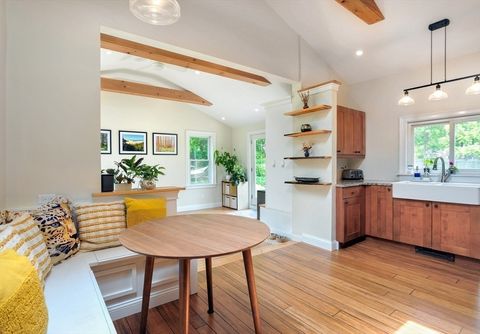
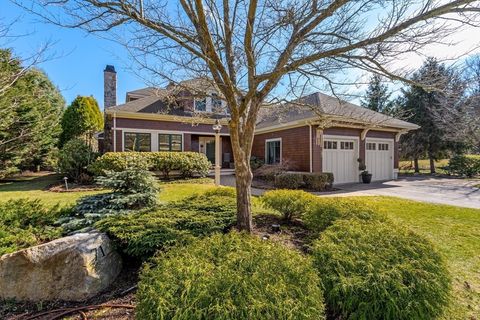
Active
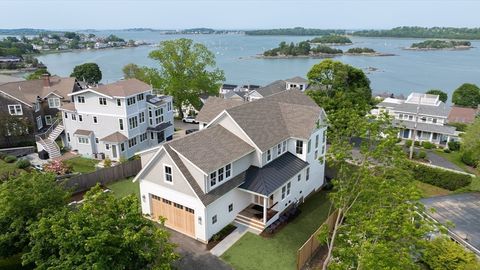
$799,000
3
bds
|
2
ba
|
1,576
sqft
|
built
1880
198 Hull St, Hingham, MA 02043
$-1,296
Cash flow
-8.5%
Cash-on-Cash Return
3.7%
Cap rate
0.6%
Rent to Value Ratio

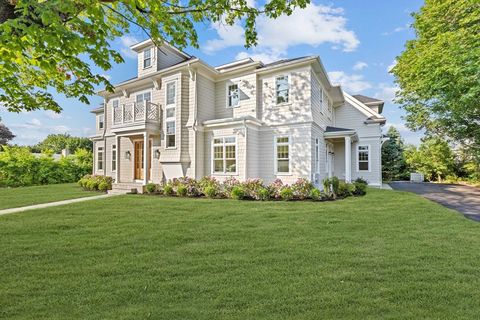
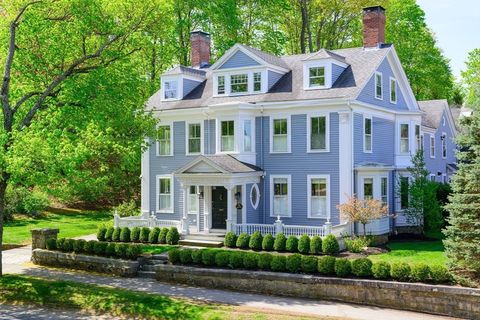
Active
$1,895,000
5
bds
|
4
ba
|
3,668
sqft
|
built
2024
8 Elizabeth Ln, Hingham, MA 02043
$-1,447
Cash flow
-4.0%
Cash-on-Cash Return
4.8%
Cap rate
0.6%
Rent to Value Ratio
18 out of 43 properties for sale in 02043
Limited Results Shown
Create a free account, or log in to reveal all property listings and enjoy the complete experience.
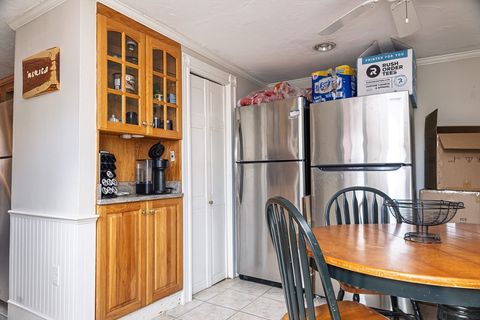
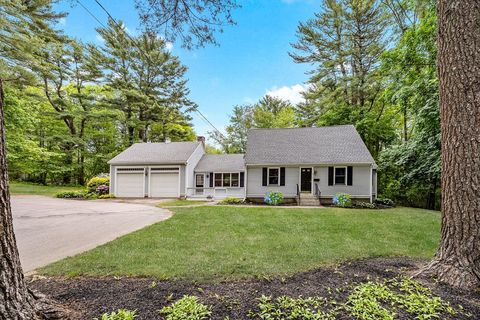
Active
$1,450,000
3
bds
|
2
ba
|
2,126
sqft
|
built
1850
166 Hull St, Hingham, MA 02043
$-3,751
Cash flow
-13.5%
Cash-on-Cash Return
2.6%
Cap rate
0.4%
Rent to Value Ratio

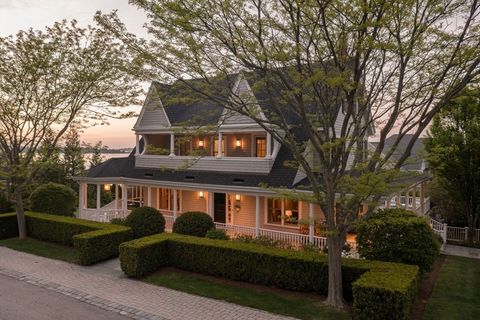
Active
$1,175,000
2
bds
|
3
ba
|
1,606
sqft
|
built
2018
10 Shipyard Dr, Hingham, MA 02043
$-3,196
Cash flow
-14.2%
Cash-on-Cash Return
2.4%
Cap rate
0.5%
Rent to Value Ratio
Active
$3,995,000
5
bds
|
6
ba
|
5,529
sqft
|
built
2024
16 Foley Beach Rd, Hingham, MA 02043
$-17,492
Cash flow
-22.8%
Cash-on-Cash Return
0.4%
Cap rate
0.1%
Rent to Value Ratio
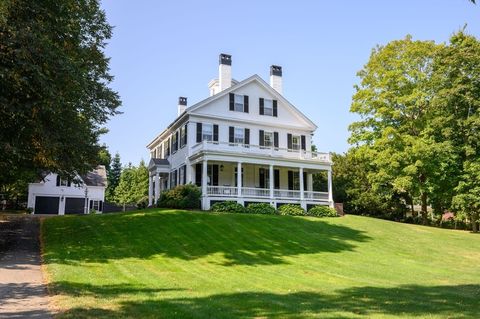
Active
$3,400,000
4
bds
|
6
ba
|
7,100
sqft
|
built
1999
130 Popes Ln, Hingham, MA 02043
$-13,261
Cash flow
-20.3%
Cash-on-Cash Return
1.0%
Cap rate
0.2%
Rent to Value Ratio
Active
$3,750,000
4
bds
|
6
ba
|
5,381
sqft
|
built
2025
34 Otis Hill Rd, Hingham, MA 02043
$-16,245
Cash flow
-22.6%
Cash-on-Cash Return
0.5%
Cap rate
0.1%
Rent to Value Ratio
Active
$990,000
3
bds
|
2
ba
|
2,482
sqft
|
built
1946
212 Cushing St, Hingham, MA 02043
$-2,145
Cash flow
-11.3%
Cash-on-Cash Return
3.1%
Cap rate
0.5%
Rent to Value Ratio
Active
$5,498,000
6
bds
|
5
ba
|
6,500
sqft
|
built
1890
17 Paige St, Hingham, MA 02043
$-23,346
Cash flow
-22.2%
Cash-on-Cash Return
0.6%
Cap rate
0.1%
Rent to Value Ratio
Active
$4,385,000
6
bds
|
4
ba
|
4,984
sqft
|
built
1840
50 Lincoln St, Hingham, MA 02043
$-18,335
Cash flow
-21.8%
Cash-on-Cash Return
0.7%
Cap rate
0.2%
Rent to Value Ratio
Active
$3,495,000
3
bds
|
5
ba
|
5,774
sqft
|
built
2004
71 Clubhouse Dr, Hingham, MA 02043
$-15,037
Cash flow
-22.4%
Cash-on-Cash Return
0.5%
Cap rate
0.2%
Rent to Value Ratio
Active
$4,549,000
6
bds
|
6
ba
|
7,101
sqft
|
built
1774
93 Main St, Hingham, MA 02043
$-18,007
Cash flow
-20.7%
Cash-on-Cash Return
0.9%
Cap rate
0.2%
Rent to Value Ratio
Active
$2,145,000
5
bds
|
4
ba
|
4,203
sqft
|
built
2025
34 Kimball Beach Rd, Hingham, MA 02043
$-7,322
Cash flow
-17.8%
Cash-on-Cash Return
1.6%
Cap rate
0.2%
Rent to Value Ratio
Active
$5,399,000
5
bds
|
8
ba
|
8,378
sqft
|
built
2012
86 Black Rock Dr, Hingham, MA 02043
$-27,802
Cash flow
-26.9%
Cash-on-Cash Return
-0.5%
Cap rate
0.1%
Rent to Value Ratio
Active
$2,145,000
4
bds
|
3
ba
|
5,013
sqft
|
built
1988
152 Prospect St, Hingham, MA 02043
$-5,653
Cash flow
-13.8%
Cash-on-Cash Return
2.5%
Cap rate
0.4%
Rent to Value Ratio
Active
$4,850,000
5
bds
|
6
ba
|
6,554
sqft
|
built
1929
17 Cole Rd, Hingham, MA 02043
$-20,153
Cash flow
-21.7%
Cash-on-Cash Return
0.7%
Cap rate
0.2%
Rent to Value Ratio
Active
$920,000
3
bds
|
2
ba
|
1,546
sqft
|
built
1922
21 Surry Rd, Hingham, MA 02043
$-2,384
Cash flow
-13.5%
Cash-on-Cash Return
2.6%
Cap rate
0.4%
Rent to Value Ratio

Active
$3,995,000
4
bds
|
4
ba
|
5,898
sqft
|
built
1987
70 Lazell St, Hingham, MA 02043
$-14,289
Cash flow
-18.7%
Cash-on-Cash Return
1.4%
Cap rate
0.3%
Rent to Value Ratio