02090 Investment Properties for Sale
Browse homes for sale and investment properties in 02090. Refine your search by price, property type, or more.
Best cash flowing properties in 02090
Active
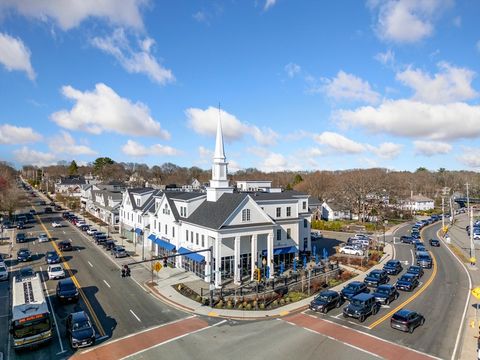
$875,000
2
bds
|
2
ba
|
1,332
sqft
|
built
2022
298 Washington St, Westwood, MA 02090
$-1,739
Cash flow
-10.4%
Cash-on-Cash Return
3.3%
Cap rate
0.6%
Rent to Value Ratio
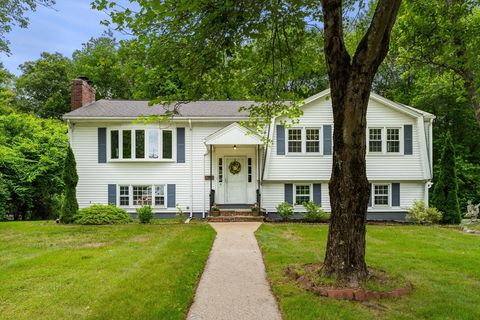
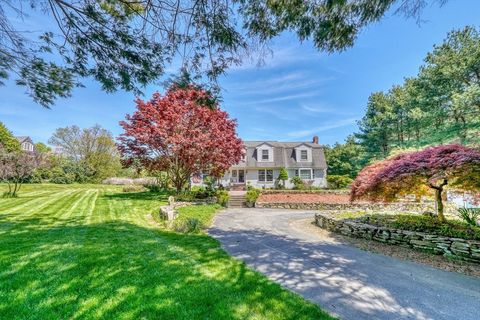
Active
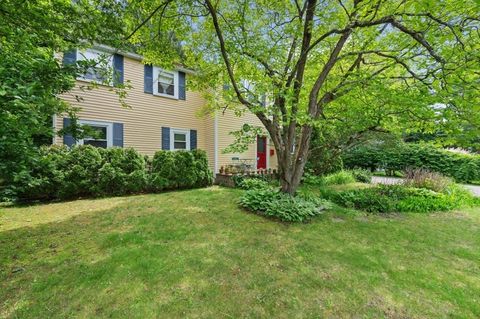
$1,195,000
5
bds
|
3
ba
|
3,171
sqft
|
built
1950
18 Edgewood Rd, Westwood, MA 02090
$-2,893
Cash flow
-12.6%
Cash-on-Cash Return
2.8%
Cap rate
0.5%
Rent to Value Ratio
17 out of 18 properties for sale in 02090
Limited Results Shown
Create a free account, or log in to reveal all property listings and enjoy the complete experience.
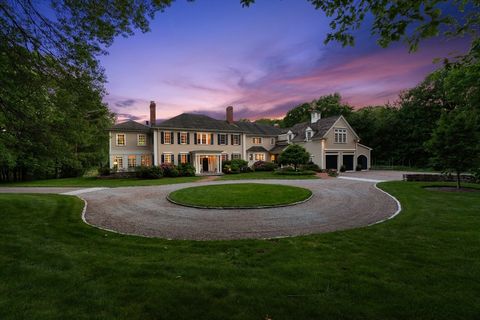
Active
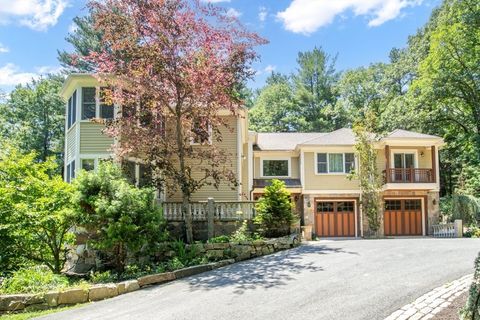
$3,199,000
4
bds
|
5
ba
|
5,299
sqft
|
built
1987
39 Westbrook Ln, Westwood, MA 02090
$-13,021
Cash flow
-21.2%
Cash-on-Cash Return
0.8%
Cap rate
0.2%
Rent to Value Ratio
Active
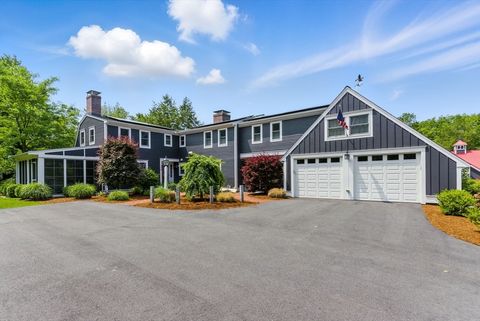
$3,199,000
5
bds
|
5
ba
|
5,631
sqft
|
built
1961
314 Grove St, Westwood, MA 02090
$-12,671
Cash flow
-20.7%
Cash-on-Cash Return
0.9%
Cap rate
0.2%
Rent to Value Ratio
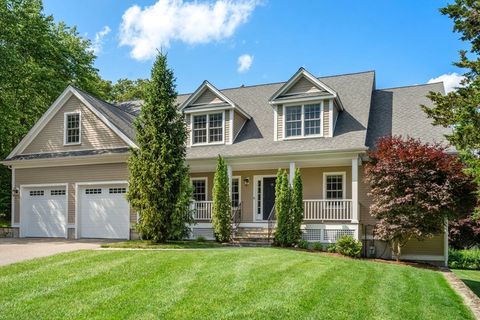
Active
$1,069,000
3
bds
|
3
ba
|
1,796
sqft
|
built
1968
15 Stanford Dr, Westwood, MA 02090
$-3,093
Cash flow
-15.1%
Cash-on-Cash Return
2.2%
Cap rate
0.4%
Rent to Value Ratio
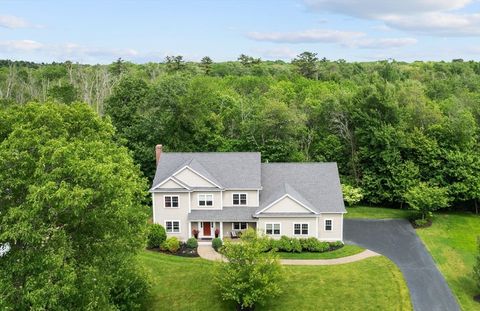
Active
$1,845,000
5
bds
|
5
ba
|
4,644
sqft
|
built
2012
10 Gloucester Rd, Westwood, MA 02090
$-4,449
Cash flow
-12.6%
Cash-on-Cash Return
2.8%
Cap rate
0.5%
Rent to Value Ratio
Active
$8,500,000
5
bds
|
7
ba
|
8,033
sqft
|
built
1997
26 Longmeadow Dr, Westwood, MA 02090
$-38,310
Cash flow
-23.5%
Cash-on-Cash Return
0.3%
Cap rate
0.1%
Rent to Value Ratio
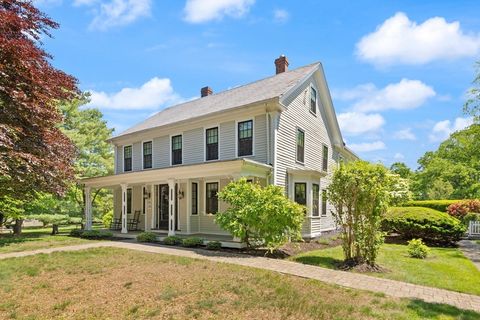
Active
$1,595,000
4
bds
|
4
ba
|
3,315
sqft
|
built
1790
240 Canton St, Westwood, MA 02090
$-5,008
Cash flow
-16.4%
Cash-on-Cash Return
1.9%
Cap rate
0.4%
Rent to Value Ratio
Active
$1,395,000
5
bds
|
3
ba
|
3,198
sqft
|
built
1976
300 Nahatan St, Westwood, MA 02090
$-3,548
Cash flow
-13.3%
Cash-on-Cash Return
2.6%
Cap rate
0.5%
Rent to Value Ratio
Active
$2,100,000
4
bds
|
4
ba
|
4,300
sqft
|
built
2013
53 Thompson Ave, Westwood, MA 02090
$-7,357
Cash flow
-18.3%
Cash-on-Cash Return
1.5%
Cap rate
0.3%
Rent to Value Ratio

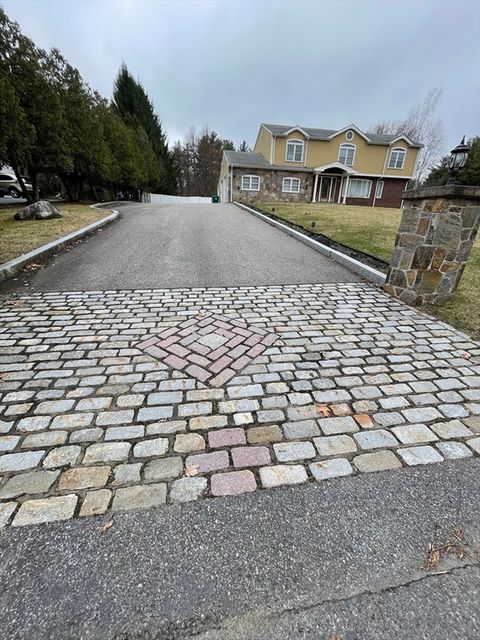
Active
$1,049,000
5
bds
|
2
ba
|
3,402
sqft
|
built
1954
290 East St, Westwood, MA 02090
$-3,026
Cash flow
-15.1%
Cash-on-Cash Return
2.2%
Cap rate
0.4%
Rent to Value Ratio
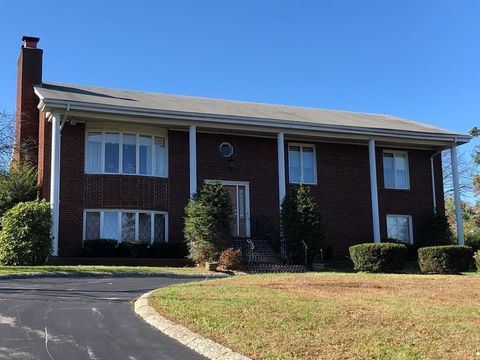
Active
$1,350,000
5
bds
|
3
ba
|
2,952
sqft
|
built
1954
87 Whitewood Rd, Westwood, MA 02090
$-4,217
Cash flow
-16.3%
Cash-on-Cash Return
1.9%
Cap rate
0.4%
Rent to Value Ratio
Active
$2,149,000
5
bds
|
5
ba
|
3,574
sqft
|
built
1977
243 Weatherbee Dr, Westwood, MA 02090
$-7,460
Cash flow
-18.1%
Cash-on-Cash Return
1.5%
Cap rate
0.3%
Rent to Value Ratio

Active
$7,000,000
6
bds
|
7
ba
|
9,342
sqft
|
built
1984
429 Summer St, Westwood, MA 02090
$-32,084
Cash flow
-23.9%
Cash-on-Cash Return
0.2%
Cap rate
0.1%
Rent to Value Ratio
Active
$1,219,000
4
bds
|
3
ba
|
2,563
sqft
|
built
1976
40 Weatherbee Dr, Westwood, MA 02090
$-3,554
Cash flow
-15.2%
Cash-on-Cash Return
2.2%
Cap rate
0.4%
Rent to Value Ratio
Active
$10,900,000
7
bds
|
8
ba
|
12,012
sqft
|
built
1936
401 Sandy Valley Rd, Westwood, MA 02090
$-48,747
Cash flow
-23.3%
Cash-on-Cash Return
0.3%
Cap rate
0.1%
Rent to Value Ratio
Active
$9,900,000
6
bds
|
9
ba
|
10,309
sqft
|
built
2017
300 Summer St, Westwood, MA 02090
$-45,282
Cash flow
-23.9%
Cash-on-Cash Return
0.2%
Cap rate
0.1%
Rent to Value Ratio