02127 Investment Properties for Sale
Browse homes for sale and investment properties in 02127. Refine your search by price, property type, or more.
Best cash flowing properties in 02127

Active
$512,000
1
bds
|
1
ba
|
550
sqft
|
built
1890
115 W 7th St, Boston, MA 02127
$-936
Cash flow
-9.5%
Cash-on-Cash Return
3.5%
Cap rate
0.5%
Rent to Value Ratio

Pending
$500,000
1
bds
|
1
ba
|
515
sqft
|
built
1890
291 W 3rd St, Boston, MA 02127
$-1,250
Cash flow
-13.0%
Cash-on-Cash Return
2.7%
Cap rate
0.5%
Rent to Value Ratio
81 out of 136 properties for sale in 02127
Limited Results Shown
Create a free account, or log in to reveal all property listings and enjoy the complete experience.

Active
$1,059,000
2
bds
|
1
ba
|
876
sqft
|
built
2019
420 W Broadway, Boston, MA 02127
$-3,096
Cash flow
-15.3%
Cash-on-Cash Return
2.2%
Cap rate
0.5%
Rent to Value Ratio

Active
$1,195,000
3
bds
|
3
ba
|
1,768
sqft
|
built
1900
20 Winfield St, Boston, MA 02127
$-2,645
Cash flow
-11.5%
Cash-on-Cash Return
3.0%
Cap rate
0.5%
Rent to Value Ratio

Active
$799,000
2
bds
|
2
ba
|
942
sqft
|
built
2013
360 W 2nd St, Boston, MA 02127
$-2,144
Cash flow
-14.0%
Cash-on-Cash Return
2.5%
Cap rate
0.5%
Rent to Value Ratio

Active under contract
$899,900
2
bds
|
2
ba
|
1,009
sqft
|
built
2014
37 P St, Boston, MA 02127
$-1,698
Cash flow
-9.8%
Cash-on-Cash Return
3.4%
Cap rate
0.5%
Rent to Value Ratio

Active
$529,000
1
bds
|
1
ba
|
500
sqft
|
built
1890
120 D St, Boston, MA 02127
$-1,512
Cash flow
-14.9%
Cash-on-Cash Return
2.2%
Cap rate
0.5%
Rent to Value Ratio

Active
$570,000
1
bds
|
1
ba
|
629
sqft
|
built
1920
805 E 4th St, Boston, MA 02127
$-1,427
Cash flow
-13.1%
Cash-on-Cash Return
2.7%
Cap rate
0.5%
Rent to Value Ratio

Active
$879,900
2
bds
|
2
ba
|
1,000
sqft
|
built
1920
870 E 4th St, Boston, MA 02127
$-2,387
Cash flow
-14.2%
Cash-on-Cash Return
2.4%
Cap rate
0.5%
Rent to Value Ratio

Active
$1,285,000
3
bds
|
3
ba
|
1,501
sqft
|
built
1890
707 E 4th St, Boston, MA 02127
$-3,125
Cash flow
-12.7%
Cash-on-Cash Return
2.8%
Cap rate
0.4%
Rent to Value Ratio

Active
$1,499,000
3
bds
|
2
ba
|
1,437
sqft
|
built
2017
1650 Columbia Rd, Boston, MA 02127
$-4,808
Cash flow
-16.7%
Cash-on-Cash Return
1.8%
Cap rate
0.4%
Rent to Value Ratio

Active
$619,000
2
bds
|
2
ba
|
700
sqft
|
built
1885
293 D St, Boston, MA 02127
$-1,441
Cash flow
-12.1%
Cash-on-Cash Return
2.9%
Cap rate
0.5%
Rent to Value Ratio

Active
$849,000
1
bds
|
2
ba
|
982
sqft
|
built
1920
53 Thomas Park, Boston, MA 02127
$-2,322
Cash flow
-14.3%
Cash-on-Cash Return
2.4%
Cap rate
0.5%
Rent to Value Ratio

Active
$1,380,000
2
bds
|
3
ba
|
1,698
sqft
|
built
2017
280 W 5th St, Boston, MA 02127
$-3,393
Cash flow
-12.8%
Cash-on-Cash Return
2.7%
Cap rate
0.4%
Rent to Value Ratio
Active
$1,250,000
3
bds
|
2
ba
|
1,365
sqft
|
built
2017
1650 Columbia Rd, Boston, MA 02127
$-2,995
Cash flow
-12.5%
Cash-on-Cash Return
2.8%
Cap rate
0.5%
Rent to Value Ratio

Active
$999,000
2
bds
|
2
ba
|
1,201
sqft
|
built
2018
150 W Broadway, Boston, MA 02127
$-2,707
Cash flow
-14.1%
Cash-on-Cash Return
2.4%
Cap rate
0.5%
Rent to Value Ratio

Active under contract
$565,000
1
bds
|
1
ba
|
655
sqft
|
built
2004
55 Woodward St, Boston, MA 02127
$-1,395
Cash flow
-12.9%
Cash-on-Cash Return
2.7%
Cap rate
0.5%
Rent to Value Ratio

Active
$749,000
2
bds
|
1
ba
|
857
sqft
|
built
1905
10 Peters St, Boston, MA 02127
$-1,523
Cash flow
-10.6%
Cash-on-Cash Return
3.2%
Cap rate
0.5%
Rent to Value Ratio

Active
$1,099,000
2
bds
|
2
ba
|
1,273
sqft
|
built
1875
823 E Broadway, Boston, MA 02127
$-3,471
Cash flow
-16.5%
Cash-on-Cash Return
1.9%
Cap rate
0.4%
Rent to Value Ratio
Active
$2,895,000
2
bds
|
2
ba
|
1,452
sqft
|
built
2015
22 Liberty Pl, Boston, MA 02127
$-11,505
Cash flow
-20.7%
Cash-on-Cash Return
0.9%
Cap rate
0.3%
Rent to Value Ratio

Active
$899,000
2
bds
|
2
ba
|
1,314
sqft
|
built
2016
488 Dorchester Ave, Boston, MA 02127
$-2,440
Cash flow
-14.2%
Cash-on-Cash Return
2.4%
Cap rate
0.6%
Rent to Value Ratio

Active
$1,425,000
2
bds
|
2
ba
|
1,864
sqft
|
built
1900
55 W Broadway, Boston, MA 02127
$-5,217
Cash flow
-19.1%
Cash-on-Cash Return
1.3%
Cap rate
0.4%
Rent to Value Ratio
Pending
$500,000
1
bds
|
1
ba
|
515
sqft
|
built
1890
291 W 3rd St, Boston, MA 02127
$-1,250
Cash flow
-13.0%
Cash-on-Cash Return
2.7%
Cap rate
0.5%
Rent to Value Ratio

Active
$1,149,000
2
bds
|
3
ba
|
1,421
sqft
|
built
1900
603 E 6th St, Boston, MA 02127
$-3,112
Cash flow
-14.1%
Cash-on-Cash Return
2.4%
Cap rate
0.4%
Rent to Value Ratio
Active
$512,000
1
bds
|
1
ba
|
550
sqft
|
built
1890
115 W 7th St, Boston, MA 02127
$-936
Cash flow
-9.5%
Cash-on-Cash Return
3.5%
Cap rate
0.5%
Rent to Value Ratio

Active under contract
$1,150,000
2
bds
|
2
ba
|
1,409
sqft
|
built
2013
615 E 6th St, Boston, MA 02127
$-3,310
Cash flow
-15.0%
Cash-on-Cash Return
2.2%
Cap rate
0.4%
Rent to Value Ratio

Active
$939,000
2
bds
|
2
ba
|
1,116
sqft
|
built
2016
488 Dorchester Ave, Boston, MA 02127
$-2,741
Cash flow
-15.2%
Cash-on-Cash Return
2.2%
Cap rate
0.5%
Rent to Value Ratio

Pending
$569,999
1
bds
|
1
ba
|
700
sqft
|
built
1899
53 Woodward St, Boston, MA 02127
$-1,454
Cash flow
-13.3%
Cash-on-Cash Return
2.6%
Cap rate
0.5%
Rent to Value Ratio

Active
$539,500
1
bds
|
1
ba
|
541
sqft
|
built
1899
350 W 4th St, Boston, MA 02127
$-1,385
Cash flow
-13.4%
Cash-on-Cash Return
2.6%
Cap rate
0.5%
Rent to Value Ratio

Active
$1,049,000
3
bds
|
2
ba
|
1,619
sqft
|
built
2019
510 Dorchester Ave, Boston, MA 02127
$-2,194
Cash flow
-10.9%
Cash-on-Cash Return
3.2%
Cap rate
0.6%
Rent to Value Ratio

Active
$1,025,000
2
bds
|
2
ba
|
1,300
sqft
|
built
2007
474 E 3rd St, Boston, MA 02127
$-2,918
Cash flow
-14.9%
Cash-on-Cash Return
2.3%
Cap rate
0.4%
Rent to Value Ratio

Pending
$775,000
2
bds
|
2
ba
|
910
sqft
|
built
1905
192 W 6th St, Boston, MA 02127
$-1,912
Cash flow
-12.9%
Cash-on-Cash Return
2.7%
Cap rate
0.5%
Rent to Value Ratio
Active
$868,000
2
bds
|
2
ba
|
1,209
sqft
|
built
1890
714 E 4th St, Boston, MA 02127
$-2,349
Cash flow
-14.1%
Cash-on-Cash Return
2.4%
Cap rate
0.4%
Rent to Value Ratio
Active
$925,000
2
bds
|
2
ba
|
990
sqft
|
built
2014
37 P St, Boston, MA 02127
$-2,877
Cash flow
-16.2%
Cash-on-Cash Return
1.9%
Cap rate
0.4%
Rent to Value Ratio

Active
$1,425,000
2
bds
|
2
ba
|
1,518
sqft
|
built
2017
928 E Broadway, Boston, MA 02127
$-4,738
Cash flow
-17.3%
Cash-on-Cash Return
1.7%
Cap rate
0.4%
Rent to Value Ratio

Active under contract
$1,150,000
2
bds
|
2
ba
|
1,050
sqft
|
built
1899
865 E 2nd St, Boston, MA 02127
$-1,988
Cash flow
-9.0%
Cash-on-Cash Return
3.6%
Cap rate
0.5%
Rent to Value Ratio
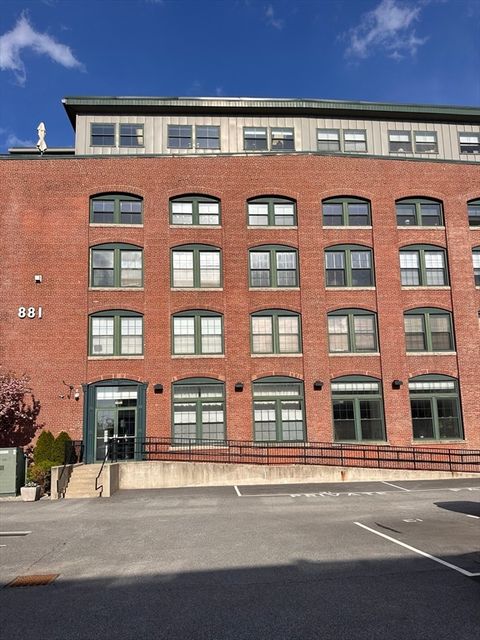
Active
$739,000
1
bds
|
1
ba
|
1,039
sqft
|
built
1899
881 E 1st St, Boston, MA 02127
$-1,375
Cash flow
-9.7%
Cash-on-Cash Return
3.4%
Cap rate
0.5%
Rent to Value Ratio

Active
$955,000
2
bds
|
2
ba
|
1,063
sqft
|
built
2020
420 W Broadway, Boston, MA 02127
$-2,146
Cash flow
-11.7%
Cash-on-Cash Return
3.0%
Cap rate
0.5%
Rent to Value Ratio

Active
$875,000
2
bds
|
2
ba
|
1,176
sqft
|
built
1905
290 W 5th St, Boston, MA 02127
$-2,279
Cash flow
-13.6%
Cash-on-Cash Return
2.6%
Cap rate
0.5%
Rent to Value Ratio

Active
$6,995,000
2
bds
|
3
ba
|
2,162
sqft
|
built
2015
22 Liberty Pl, Boston, MA 02127
$-35,228
Cash flow
-26.3%
Cash-on-Cash Return
-0.4%
Cap rate
0.1%
Rent to Value Ratio

Pending
$1,375,000
3
bds
|
3
ba
|
1,655
sqft
|
built
2016
111 B St, Boston, MA 02127
$-3,420
Cash flow
-13.0%
Cash-on-Cash Return
2.7%
Cap rate
0.5%
Rent to Value Ratio

Active
$919,000
2
bds
|
2
ba
|
953
sqft
|
built
2022
457 W Broadway, Boston, MA 02127
$-2,498
Cash flow
-14.2%
Cash-on-Cash Return
2.4%
Cap rate
0.5%
Rent to Value Ratio