02132 Investment Properties for Sale
Browse homes for sale and investment properties in 02132. Refine your search by price, property type, or more.
Best cash flowing properties in 02132
Active
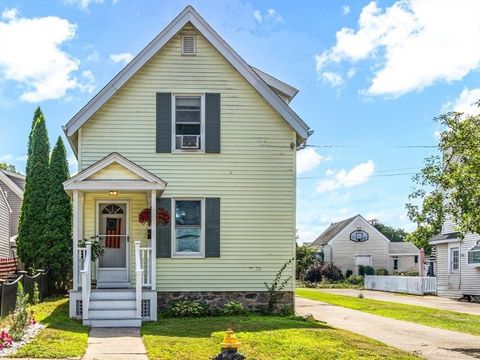
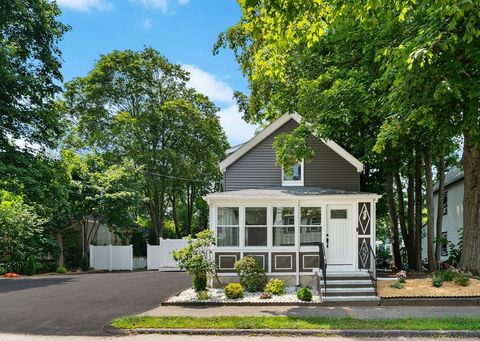
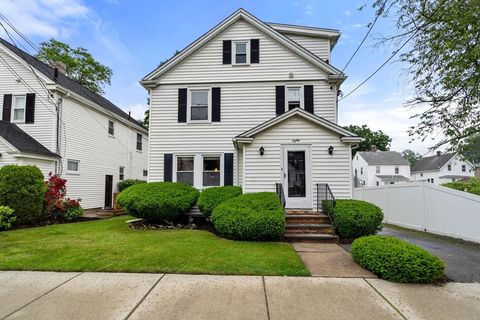
$639,900
3
bds
|
2
ba
|
1,067
sqft
|
built
1925
19 Johnson St, Boston, MA 02132
$-928
Cash flow
-7.6%
Cash-on-Cash Return
3.9%
Cap rate
0.5%
Rent to Value Ratio
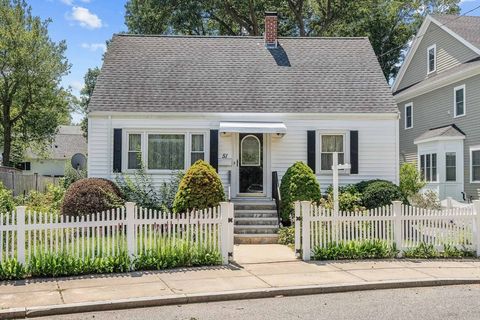
Active
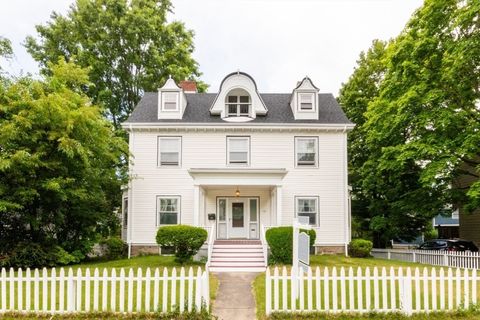
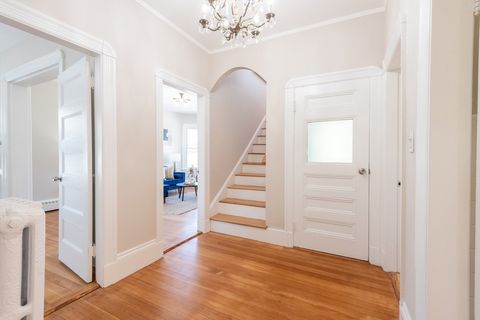
$729,000
3
bds
|
2
ba
|
1,250
sqft
|
built
1960
51 Ledge Hill Rd, Boston, MA 02132
$-1,095
Cash flow
-7.8%
Cash-on-Cash Return
3.9%
Cap rate
0.5%
Rent to Value Ratio
18 out of 23 properties for sale in 02132
Limited Results Shown
Create a free account, or log in to reveal all property listings and enjoy the complete experience.
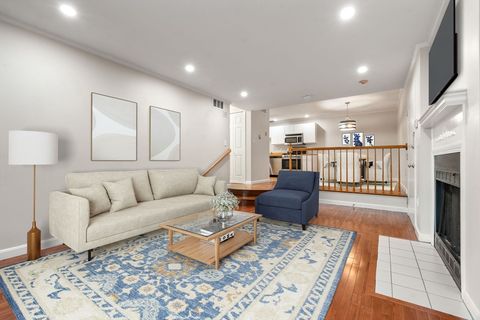
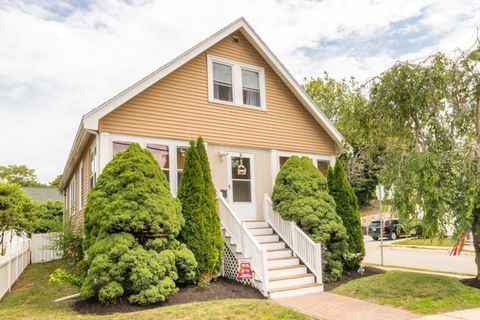
Active
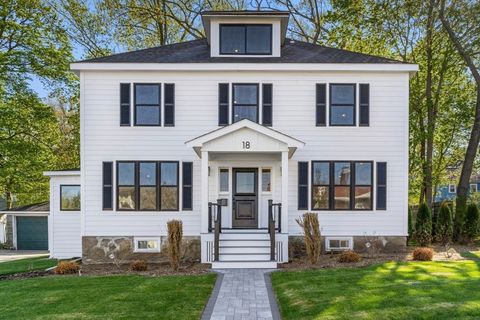
$465,000
2
bds
|
2
ba
|
1,055
sqft
|
built
1986
4975 Washington St, Boston, MA 02132
$-1,157
Cash flow
-13.0%
Cash-on-Cash Return
2.7%
Cap rate
0.6%
Rent to Value Ratio
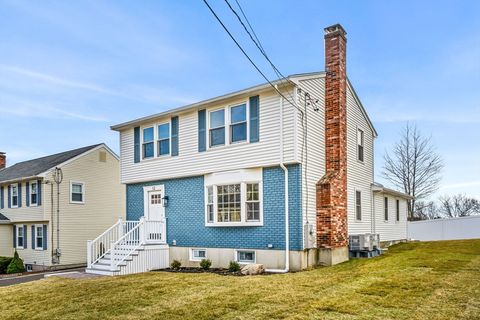
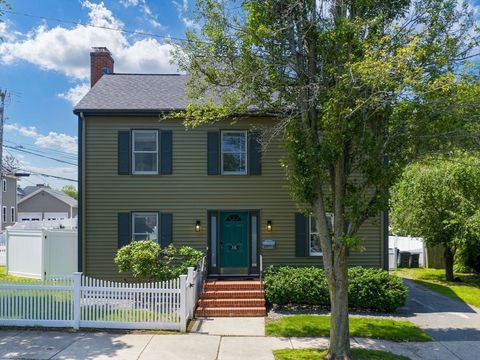
Active
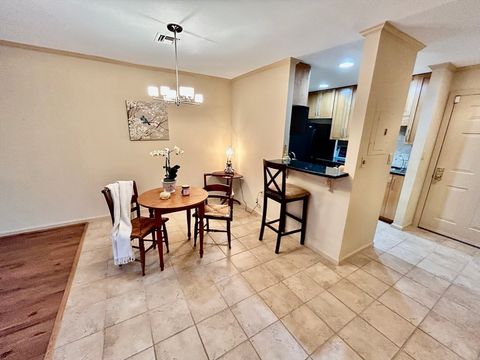
$535,000
2
bds
|
2
ba
|
1,030
sqft
|
built
1986
1216 Vfw Pkwy, Boston, MA 02132
$-1,526
Cash flow
-14.9%
Cash-on-Cash Return
2.3%
Cap rate
0.5%
Rent to Value Ratio
Active
$795,000
3
bds
|
3
ba
|
1,956
sqft
|
built
1935
840 Vfw Pkwy, Boston, MA 02132
$-1,692
Cash flow
-11.1%
Cash-on-Cash Return
3.1%
Cap rate
0.5%
Rent to Value Ratio
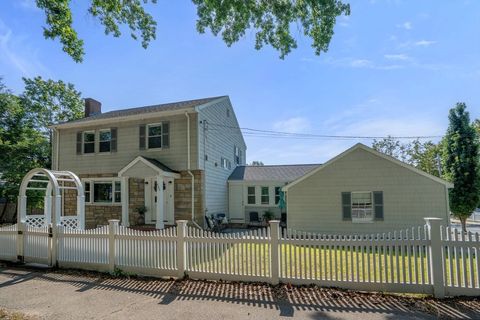
Active
$1,999,999
4
bds
|
4
ba
|
3,387
sqft
|
built
1920
35 Wren St, Boston, MA 02132
$-6,787
Cash flow
-17.7%
Cash-on-Cash Return
1.6%
Cap rate
0.3%
Rent to Value Ratio
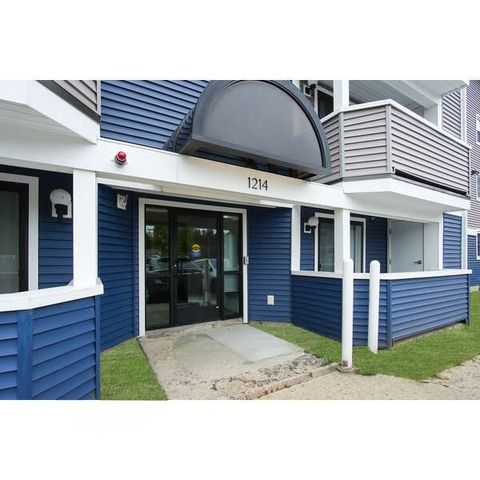
Active
$529,000
2
bds
|
2
ba
|
1,066
sqft
|
built
2022
1214 Vfw Pkwy, Boston, MA 02132
$-1,607
Cash flow
-15.8%
Cash-on-Cash Return
2.0%
Cap rate
0.5%
Rent to Value Ratio
Active
$1,145,000
3
bds
|
2
ba
|
2,325
sqft
|
built
1985
12 Eagle St, Boston, MA 02132
$-3,724
Cash flow
-17.0%
Cash-on-Cash Return
1.8%
Cap rate
0.3%
Rent to Value Ratio
Active
$949,999
3
bds
|
3
ba
|
2,391
sqft
|
built
1900
57 Rockland St, Boston, MA 02132
$-2,689
Cash flow
-14.8%
Cash-on-Cash Return
2.3%
Cap rate
0.4%
Rent to Value Ratio
Active
$1,380,000
7
bds
|
2
ba
|
3,903
sqft
|
built
1900
52 Wren St, Boston, MA 02132
$-3,338
Cash flow
-12.6%
Cash-on-Cash Return
2.8%
Cap rate
0.4%
Rent to Value Ratio
Active
$714,900
4
bds
|
3
ba
|
1,704
sqft
|
built
1920
19 Northdale Rd, Boston, MA 02132
$-1,459
Cash flow
-10.6%
Cash-on-Cash Return
3.2%
Cap rate
0.5%
Rent to Value Ratio
Active
$1,199,000
4
bds
|
3
ba
|
2,277
sqft
|
built
1995
168 Maple St, Boston, MA 02132
$-3,140
Cash flow
-13.7%
Cash-on-Cash Return
2.5%
Cap rate
0.4%
Rent to Value Ratio
Active
$755,000
3
bds
|
2
ba
|
1,840
sqft
|
built
1925
80 Joyce Kilmer Rd, Boston, MA 02132
$-1,191
Cash flow
-8.2%
Cash-on-Cash Return
3.8%
Cap rate
0.5%
Rent to Value Ratio
Active
$649,900
4
bds
|
2
ba
|
2,078
sqft
|
built
1900
1690 Centre St, Boston, MA 02132
$-1,455
Cash flow
-11.7%
Cash-on-Cash Return
3.0%
Cap rate
0.6%
Rent to Value Ratio
Active
$1,659,000
4
bds
|
5
ba
|
3,168
sqft
|
built
1921
18 Richwood St, Boston, MA 02132
$-6,023
Cash flow
-18.9%
Cash-on-Cash Return
1.3%
Cap rate
0.2%
Rent to Value Ratio
Active
$599,000
2
bds
|
2
ba
|
1,025
sqft
|
built
1989
97 Anderer Ln, Boston, MA 02132
$-1,424
Cash flow
-12.4%
Cash-on-Cash Return
2.8%
Cap rate
0.5%
Rent to Value Ratio
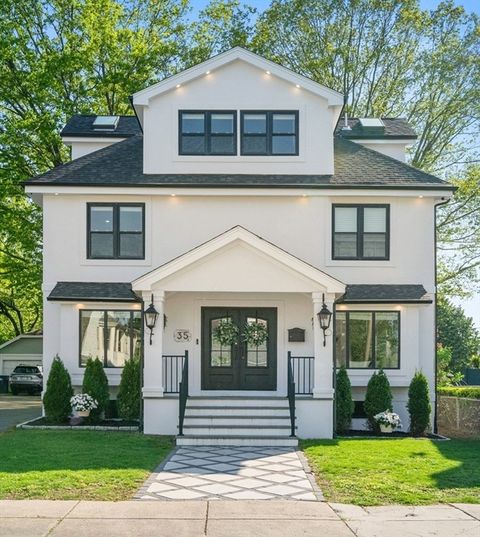
Active
$1,725,000
4
bds
|
4
ba
|
3,700
sqft
|
built
2022
7 Starling St, Boston, MA 02132
$-3,059
Cash flow
-9.3%
Cash-on-Cash Return
3.6%
Cap rate
0.5%
Rent to Value Ratio
Active
$1,999,000
9
bds
|
5
ba
|
7,386
sqft
|
built
1920
35 Heron St, Boston, MA 02132
$-6,424
Cash flow
-16.8%
Cash-on-Cash Return
1.8%
Cap rate
0.2%
Rent to Value Ratio