02171 Investment Properties for Sale
Browse homes for sale and investment properties in 02171. Refine your search by price, property type, or more.
Best cash flowing properties in 02171

Active
$275,000
0
bds
|
1
ba
|
510
sqft
|
built
1985
133 Commander Shea Blvd, Quincy, MA 02171
$-938
Cash flow
-17.8%
Cash-on-Cash Return
1.6%
Cap rate
0.6%
Rent to Value Ratio
Active
$625,000
2
bds
|
3
ba
|
1,395
sqft
|
built
1982
158 Quincy Shore Dr, Quincy, MA 02171
$-1,655
Cash flow
-13.8%
Cash-on-Cash Return
2.5%
Cap rate
0.5%
Rent to Value Ratio
14 out of 29 properties for sale in 02171
Limited Results Shown
Create a free account, or log in to reveal all property listings and enjoy the complete experience.
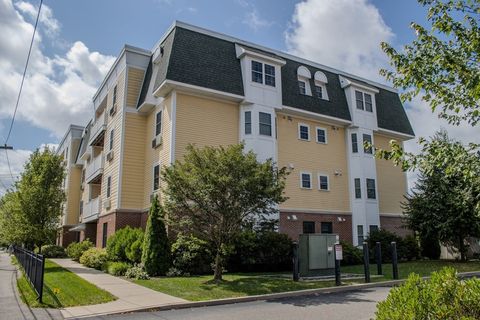
Active
$618,000
2
bds
|
2
ba
|
1,325
sqft
|
built
2015
39 Fayette St, Quincy, MA 02171
$-1,666
Cash flow
-14.1%
Cash-on-Cash Return
2.4%
Cap rate
0.5%
Rent to Value Ratio
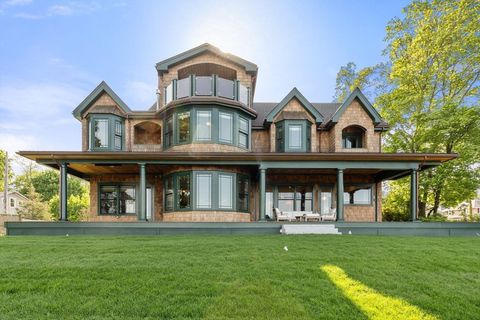
Active
$5,275,000
5
bds
|
6
ba
|
7,056
sqft
|
built
2022
62 Bay St, Quincy, MA 02171
$-22,311
Cash flow
-22.1%
Cash-on-Cash Return
0.6%
Cap rate
0.2%
Rent to Value Ratio
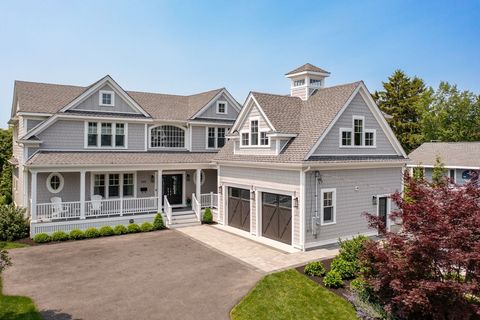
Active
$2,699,000
4
bds
|
6
ba
|
4,600
sqft
|
built
2021
935 E Squantum St, Quincy, MA 02171
$-8,039
Cash flow
-15.5%
Cash-on-Cash Return
2.1%
Cap rate
0.4%
Rent to Value Ratio
Active
$2,300,000
3
bds
|
3
ba
|
3,183
sqft
|
built
1925
50 Surfside Ln, Quincy, MA 02171
$-8,368
Cash flow
-19.0%
Cash-on-Cash Return
1.3%
Cap rate
0.3%
Rent to Value Ratio
Active
$2,199,000
3
bds
|
4
ba
|
3,140
sqft
|
built
2025
87 Dorchester St, Quincy, MA 02171
$-9,113
Cash flow
-21.6%
Cash-on-Cash Return
0.7%
Cap rate
0.1%
Rent to Value Ratio

Active
$1,690,000
6
bds
|
5
ba
|
4,200
sqft
|
built
1915
15 Dundee Rd, Quincy, MA 02171
$-5,754
Cash flow
-17.8%
Cash-on-Cash Return
1.6%
Cap rate
0.3%
Rent to Value Ratio
Active
$1,949,900
2
bds
|
3
ba
|
2,503
sqft
|
built
1987
2001 Marina Dr, Quincy, MA 02171
$-8,979
Cash flow
-24.0%
Cash-on-Cash Return
0.2%
Cap rate
0.3%
Rent to Value Ratio

Active
$549,000
1
bds
|
1
ba
|
820
sqft
|
built
1988
1001 Marina Dr, Quincy, MA 02171
$-1,749
Cash flow
-16.6%
Cash-on-Cash Return
1.9%
Cap rate
0.5%
Rent to Value Ratio

Active
$799,900
2
bds
|
2
ba
|
1,235
sqft
|
built
1988
1001 Marina Dr, Quincy, MA 02171
$-2,485
Cash flow
-16.2%
Cash-on-Cash Return
2.0%
Cap rate
0.5%
Rent to Value Ratio
Active
$569,900
2
bds
|
2
ba
|
1,364
sqft
|
built
1989
85 E Squantum St, Quincy, MA 02171
$-2,071
Cash flow
-19.0%
Cash-on-Cash Return
1.3%
Cap rate
0.5%
Rent to Value Ratio
Active
$799,000
2
bds
|
2
ba
|
1,452
sqft
|
built
1987
2001 Marina Dr, Quincy, MA 02171
$-2,570
Cash flow
-16.8%
Cash-on-Cash Return
1.8%
Cap rate
0.6%
Rent to Value Ratio

Active
$3,799,000
3
bds
|
4
ba
|
2,525
sqft
|
built
2019
153 Bayside Rd, Quincy, MA 02171
$-12,336
Cash flow
-16.9%
Cash-on-Cash Return
1.8%
Cap rate
0.3%
Rent to Value Ratio