02360 Investment Properties for Sale
Browse homes for sale and investment properties in 02360. Refine your search by price, property type, or more.
Best cash flowing properties in 02360
Active
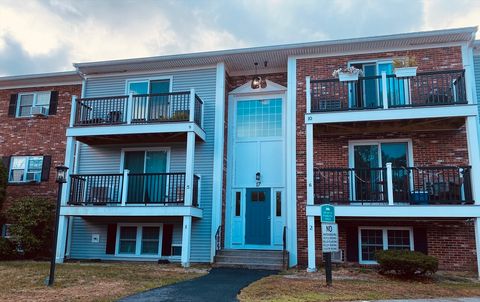
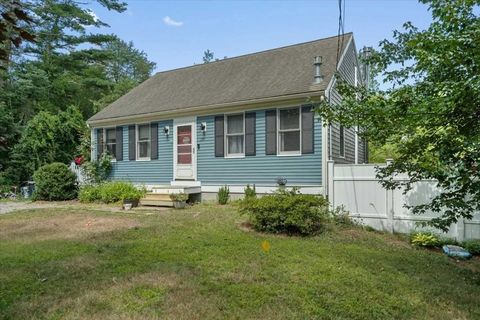
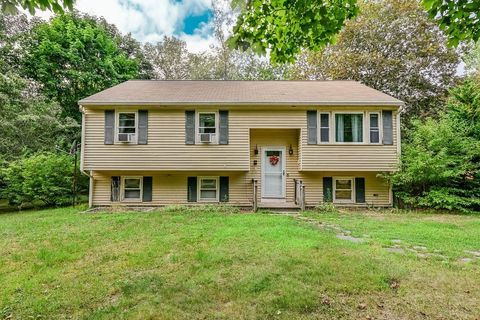
$220,000
1
bds
|
1
ba
|
785
sqft
|
built
1970
17 Chapel Hill Dr, Plymouth, MA 02360
$-379
Cash flow
-9.0%
Cash-on-Cash Return
3.6%
Cap rate
0.9%
Rent to Value Ratio
Active
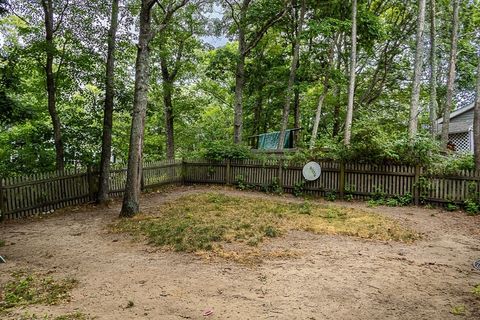
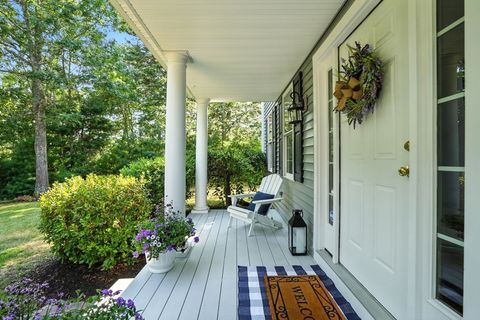
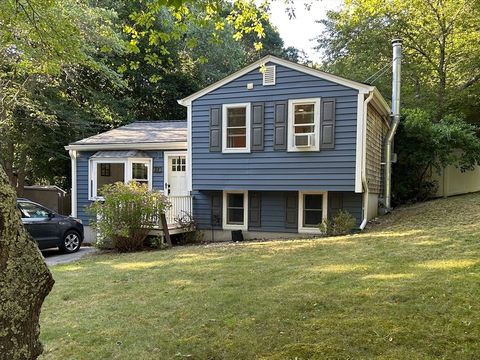
$449,000
2
bds
|
2
ba
|
910
sqft
|
built
1990
22 Cranberry Rd, Plymouth, MA 02360
$-582
Cash flow
-6.8%
Cash-on-Cash Return
4.1%
Cap rate
0.6%
Rent to Value Ratio
77 out of 146 properties for sale in 02360
Limited Results Shown
Create a free account, or log in to reveal all property listings and enjoy the complete experience.
Active
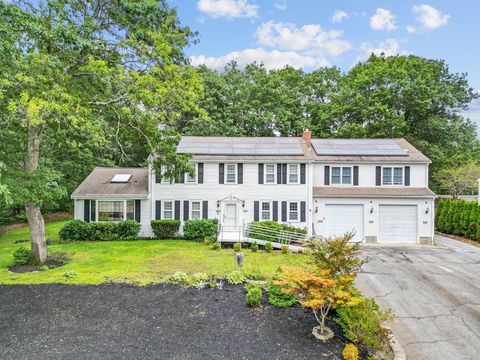
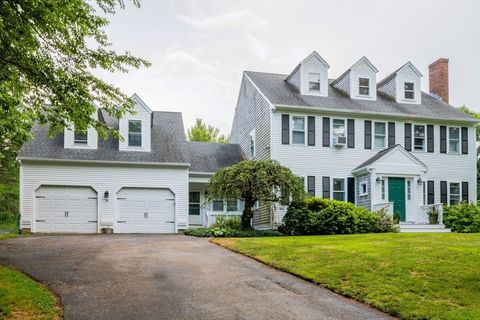
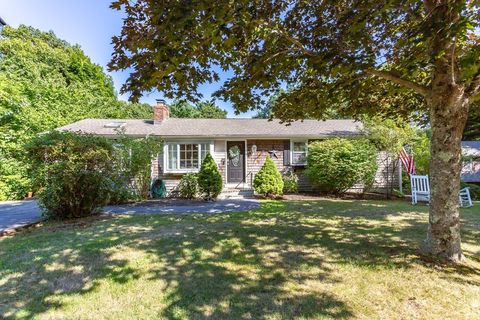
$699,000
4
bds
|
2
ba
|
2,956
sqft
|
built
1978
5 Hood Dr, Plymouth, MA 02360
$-1,273
Cash flow
-9.5%
Cash-on-Cash Return
3.5%
Cap rate
0.6%
Rent to Value Ratio
Active
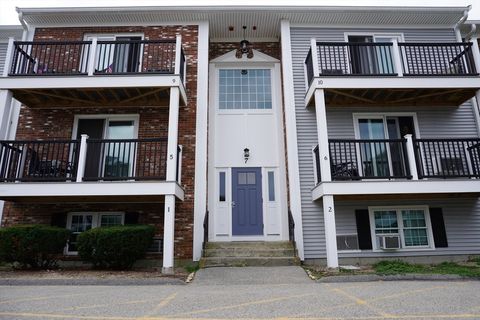
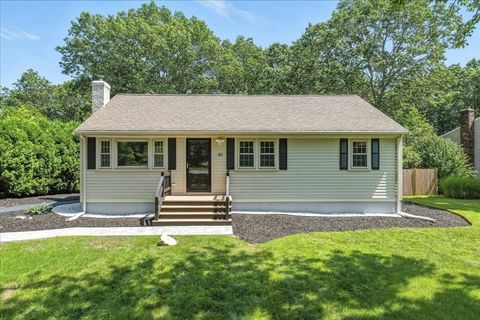
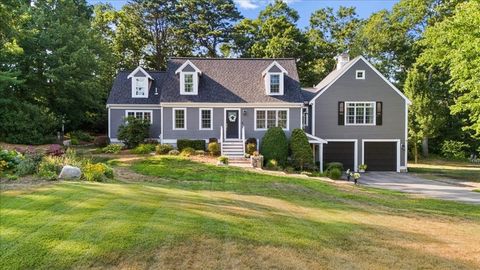
$298,000
2
bds
|
1
ba
|
895
sqft
|
built
1970
7 Chapel Hill Dr, Plymouth, MA 02360
$-690
Cash flow
-12.1%
Cash-on-Cash Return
2.9%
Cap rate
0.8%
Rent to Value Ratio
Active
$619,900
3
bds
|
1
ba
|
1,554
sqft
|
built
1952
253 Sandwich St, Plymouth, MA 02360
$-1,247
Cash flow
-10.5%
Cash-on-Cash Return
3.3%
Cap rate
0.5%
Rent to Value Ratio
Active
$635,000
3
bds
|
3
ba
|
1,450
sqft
|
built
1978
51 Nicks Rock Rd, Plymouth, MA 02360
$-1,324
Cash flow
-10.9%
Cash-on-Cash Return
3.2%
Cap rate
0.5%
Rent to Value Ratio
Active
$900,000
3
bds
|
3
ba
|
2,670
sqft
|
built
1956
30 Manomet Ave, Plymouth, MA 02360
$-2,469
Cash flow
-14.3%
Cash-on-Cash Return
2.4%
Cap rate
0.4%
Rent to Value Ratio
Active
$925,000
4
bds
|
3
ba
|
2,522
sqft
|
built
1987
89 Jordan Rd, Plymouth, MA 02360
$-2,053
Cash flow
-11.6%
Cash-on-Cash Return
3.0%
Cap rate
0.5%
Rent to Value Ratio
Active
$694,900
2
bds
|
2
ba
|
1,255
sqft
|
built
1906
76 Court St, Plymouth, MA 02360
$-2,233
Cash flow
-16.8%
Cash-on-Cash Return
1.8%
Cap rate
0.5%
Rent to Value Ratio
Active
$675,000
3
bds
|
3
ba
|
2,292
sqft
|
built
2018
3 Winter Holw, Plymouth, MA 02360
$-1,341
Cash flow
-10.4%
Cash-on-Cash Return
3.3%
Cap rate
0.5%
Rent to Value Ratio
Active
$995,000
2
bds
|
2
ba
|
1,855
sqft
|
built
1988
15 Caswell Ln, Plymouth, MA 02360
$-3,787
Cash flow
-19.9%
Cash-on-Cash Return
1.1%
Cap rate
0.4%
Rent to Value Ratio
Active
$675,000
2
bds
|
3
ba
|
1,912
sqft
|
built
2018
3 Heartwood, Plymouth, MA 02360
$-1,392
Cash flow
-10.8%
Cash-on-Cash Return
3.2%
Cap rate
0.6%
Rent to Value Ratio
Active
$659,900
3
bds
|
2
ba
|
1,485
sqft
|
built
1976
135 Shore Dr, Plymouth, MA 02360
$-1,369
Cash flow
-10.8%
Cash-on-Cash Return
3.2%
Cap rate
0.5%
Rent to Value Ratio
Active
$729,000
4
bds
|
3
ba
|
2,390
sqft
|
built
1976
44 Musket Rd, Plymouth, MA 02360
$-1,702
Cash flow
-12.2%
Cash-on-Cash Return
2.9%
Cap rate
0.5%
Rent to Value Ratio
Active
$524,900
3
bds
|
2
ba
|
1,400
sqft
|
built
1978
2462 State Rd, Plymouth, MA 02360
$-720
Cash flow
-7.2%
Cash-on-Cash Return
4.0%
Cap rate
0.6%
Rent to Value Ratio
Active
$699,900
2
bds
|
2
ba
|
1,920
sqft
|
built
2014
6 Marion St, Plymouth, MA 02360
$-1,565
Cash flow
-11.7%
Cash-on-Cash Return
3.0%
Cap rate
0.5%
Rent to Value Ratio
Active
$499,000
3
bds
|
1
ba
|
1,362
sqft
|
built
2000
109 Buzzards Bay Dr, Plymouth, MA 02360
$-690
Cash flow
-7.2%
Cash-on-Cash Return
4.0%
Cap rate
0.6%
Rent to Value Ratio
Active
$899,000
4
bds
|
3
ba
|
3,540
sqft
|
built
2008
18 Highview Rd, Plymouth, MA 02360
$-1,983
Cash flow
-11.5%
Cash-on-Cash Return
3.0%
Cap rate
0.5%
Rent to Value Ratio
Active
$925,000
3
bds
|
3
ba
|
3,500
sqft
|
built
1990
54 Bowsprit Ln, Plymouth, MA 02360
$-2,122
Cash flow
-12.0%
Cash-on-Cash Return
2.9%
Cap rate
0.5%
Rent to Value Ratio
Active
$668,000
3
bds
|
2
ba
|
1,786
sqft
|
built
1973
62 Jan Marie Dr, Plymouth, MA 02360
$-1,848
Cash flow
-14.4%
Cash-on-Cash Return
2.4%
Cap rate
0.4%
Rent to Value Ratio
Active
$549,000
4
bds
|
2
ba
|
1,750
sqft
|
built
1984
9 Lawrence Rd, Plymouth, MA 02360
$-1,055
Cash flow
-10.0%
Cash-on-Cash Return
3.4%
Cap rate
0.6%
Rent to Value Ratio
Active
$547,500
3
bds
|
2
ba
|
1,542
sqft
|
built
1976
22 Presidents Ln, Plymouth, MA 02360
$-876
Cash flow
-8.3%
Cash-on-Cash Return
3.8%
Cap rate
0.6%
Rent to Value Ratio
Active
$625,000
4
bds
|
2
ba
|
2,320
sqft
|
built
1976
16 Jan Marie Dr, Plymouth, MA 02360
$-1,014
Cash flow
-8.5%
Cash-on-Cash Return
3.7%
Cap rate
0.6%
Rent to Value Ratio
Active
$985,000
4
bds
|
3
ba
|
3,739
sqft
|
built
1990
11 April Way, Plymouth, MA 02360
$-2,341
Cash flow
-12.4%
Cash-on-Cash Return
2.8%
Cap rate
0.5%
Rent to Value Ratio
Active
$649,900
3
bds
|
2
ba
|
2,013
sqft
|
built
1965
1150 Long Pond Rd, Plymouth, MA 02360
$-1,119
Cash flow
-9.0%
Cash-on-Cash Return
3.6%
Cap rate
0.5%
Rent to Value Ratio
Active
$549,900
1
bds
|
1
ba
|
720
sqft
|
built
1930
41 Bay Shore Dr, Plymouth, MA 02360
$-1,263
Cash flow
-12.0%
Cash-on-Cash Return
2.9%
Cap rate
0.5%
Rent to Value Ratio
Active
$389,900
1
bds
|
1
ba
|
451
sqft
|
built
1900
13 Whiting St, Plymouth, MA 02360
$-1,301
Cash flow
-17.4%
Cash-on-Cash Return
1.7%
Cap rate
0.5%
Rent to Value Ratio
Active
$799,900
3
bds
|
2
ba
|
2,353
sqft
|
built
1985
45 Curtis Dr, Plymouth, MA 02360
$-1,760
Cash flow
-11.5%
Cash-on-Cash Return
3.0%
Cap rate
0.5%
Rent to Value Ratio
Active
$294,900
2
bds
|
1
ba
|
895
sqft
|
built
1970
9 Chapel Hill Dr, Plymouth, MA 02360
$-611
Cash flow
-10.8%
Cash-on-Cash Return
3.2%
Cap rate
0.8%
Rent to Value Ratio
Active
$849,999
4
bds
|
3
ba
|
4,000
sqft
|
built
2001
2 Gabriel Ln, Plymouth, MA 02360
$-2,008
Cash flow
-12.3%
Cash-on-Cash Return
2.8%
Cap rate
0.5%
Rent to Value Ratio
Active
$869,900
4
bds
|
3
ba
|
2,560
sqft
|
built
2022
8 Cranberry Farm Rd, Plymouth, MA 02360
$-1,749
Cash flow
-10.5%
Cash-on-Cash Return
3.3%
Cap rate
0.6%
Rent to Value Ratio
Active
$589,900
3
bds
|
2
ba
|
1,651
sqft
|
built
1975
34 Bourne Rd, Plymouth, MA 02360
$-839
Cash flow
-7.4%
Cash-on-Cash Return
4.0%
Cap rate
0.6%
Rent to Value Ratio
Active
$898,000
4
bds
|
3
ba
|
3,057
sqft
|
built
2013
35 Nautical Way, Plymouth, MA 02360
$-2,047
Cash flow
-11.9%
Cash-on-Cash Return
2.9%
Cap rate
0.5%
Rent to Value Ratio
Active
$550,000
1
bds
|
2
ba
|
884
sqft
|
built
2016
7 Sever St, Plymouth, MA 02360
$-1,452
Cash flow
-13.8%
Cash-on-Cash Return
2.5%
Cap rate
0.5%
Rent to Value Ratio
Active
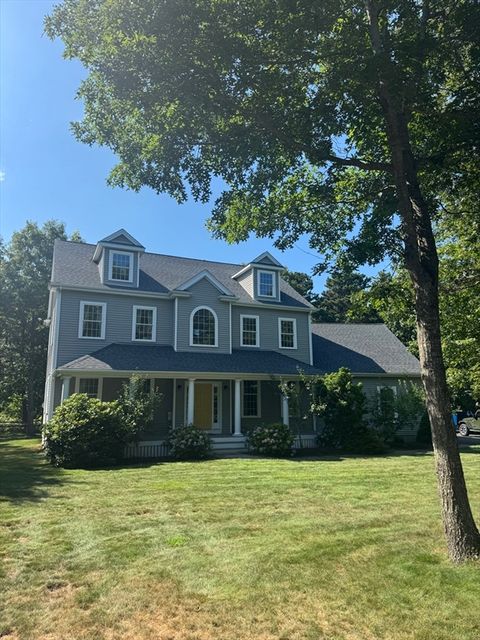
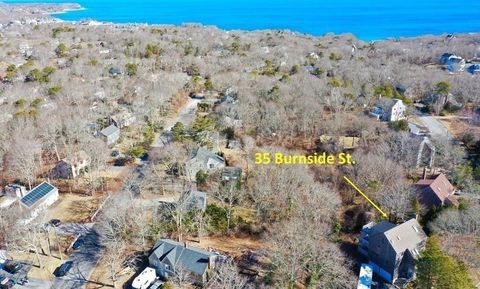
$769,000
3
bds
|
3
ba
|
2,504
sqft
|
built
1985
35 Burnside St, Plymouth, MA 02360
$-1,516
Cash flow
-10.3%
Cash-on-Cash Return
3.3%
Cap rate
0.5%
Rent to Value Ratio
Active
$499,999
2
bds
|
2
ba
|
1,280
sqft
|
built
1900
132 Summer St, Plymouth, MA 02360
$-848
Cash flow
-8.8%
Cash-on-Cash Return
3.6%
Cap rate
0.6%
Rent to Value Ratio
Active
$639,900
2
bds
|
3
ba
|
1,664
sqft
|
built
2022
21 Daisy Ln, Plymouth, MA 02360
$-1,492
Cash flow
-12.2%
Cash-on-Cash Return
2.9%
Cap rate
0.6%
Rent to Value Ratio
Active
$1,595,000
3
bds
|
3
ba
|
3,062
sqft
|
built
2007
116 Ryecroft, Plymouth, MA 02360
$-4,803
Cash flow
-15.7%
Cash-on-Cash Return
2.1%
Cap rate
0.4%
Rent to Value Ratio
Active
$669,000
2
bds
|
2
ba
|
1,521
sqft
|
built
1906
76 Court St, Plymouth, MA 02360
$-2,052
Cash flow
-16.0%
Cash-on-Cash Return
2.0%
Cap rate
0.5%
Rent to Value Ratio
Active
$624,900
2
bds
|
1
ba
|
864
sqft
|
built
1947
88 Beach St, Plymouth, MA 02360
$-1,454
Cash flow
-12.1%
Cash-on-Cash Return
2.9%
Cap rate
0.4%
Rent to Value Ratio