02420 Investment Properties for Sale
Browse homes for sale and investment properties in 02420. Refine your search by price, property type, or more.
Best cash flowing properties in 02420
Active
$895,000
3
bds
|
1
ba
|
1,212
sqft
|
built
1920
1437 Massachusetts Ave, Lexington, MA 02420
$-2,277
Cash flow
-13.3%
Cash-on-Cash Return
2.6%
Cap rate
0.4%
Rent to Value Ratio

Active
$995,000
3
bds
|
3
ba
|
1,600
sqft
|
built
1940
11 N Hancock St, Lexington, MA 02420
$-2,553
Cash flow
-13.4%
Cash-on-Cash Return
3.2%
Cap rate
0.5%
Rent to Value Ratio
30 out of 30 properties for sale in 02420
Limited Results Shown
Create a free account, or log in to reveal all property listings and enjoy the complete experience.
Active
$2,700,000
5
bds
|
5
ba
|
4,814
sqft
|
built
2014
84 Hancock St, Lexington, MA 02420
$-9,041
Cash flow
-17.5%
Cash-on-Cash Return
1.7%
Cap rate
0.3%
Rent to Value Ratio
Active
$3,150,000
6
bds
|
7
ba
|
5,752
sqft
|
built
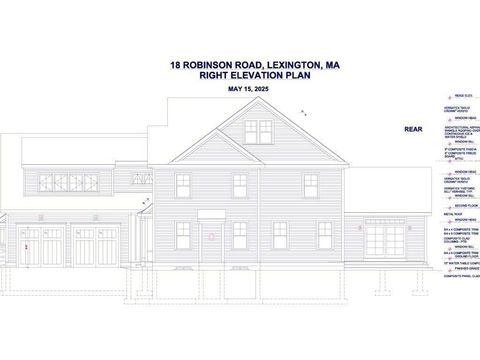
2025
18 Robinson Rd, Lexington, MA 02420
$-12,997
Cash flow
-21.5%
Cash-on-Cash Return
1.3%
Cap rate
0.2%
Rent to Value Ratio

Active
$1,995,000
4
bds
|
3
ba
|
3,650
sqft
|
built
1941
65 Blake Rd, Lexington, MA 02420
$-8,151
Cash flow
-21.3%
Cash-on-Cash Return
1.3%
Cap rate
0.3%
Rent to Value Ratio
Active
$1,998,000
4
bds
|
3
ba
|
2,792
sqft
|
built
1920
12 Coolidge Ave, Lexington, MA 02420
$-6,390
Cash flow
-16.7%
Cash-on-Cash Return
1.8%
Cap rate
0.4%
Rent to Value Ratio

Active
$980,000
3
bds
|
2
ba
|
1,428
sqft
|
built
1951
23 Ivan St, Lexington, MA 02420
$-2,931
Cash flow
-15.6%
Cash-on-Cash Return
2.7%
Cap rate
0.4%
Rent to Value Ratio

Active
$2,850,000
5
bds
|
5
ba
|
4,668
sqft
|
built
1928
8 Berwick Rd, Lexington, MA 02420
$-11,724
Cash flow
-21.5%
Cash-on-Cash Return
1.3%
Cap rate
0.3%
Rent to Value Ratio

Active
$2,599,000
5
bds
|
4
ba
|
4,665
sqft
|
built
2005
22 Flintlock Rd, Lexington, MA 02420
$-9,932
Cash flow
-19.9%
Cash-on-Cash Return
1.7%
Cap rate
0.3%
Rent to Value Ratio

Active
$3,150,000
3
bds
|
4
ba
|
3,443
sqft
|
built
1979
8 Brent Rd, Lexington, MA 02420
$-11,477
Cash flow
-19.0%
Cash-on-Cash Return
1.9%
Cap rate
0.2%
Rent to Value Ratio

Active
$1,650,000
4
bds
|
4
ba
|
2,665
sqft
|
built
1969
35 Circle Rd, Lexington, MA 02420
$-5,783
Cash flow
-18.3%
Cash-on-Cash Return
2.1%
Cap rate
0.4%
Rent to Value Ratio

Active
$1,240,000
4
bds
|
3
ba
|
2,170
sqft
|
built
1928
7 Theresa Ave, Lexington, MA 02420
$-4,120
Cash flow
-17.3%
Cash-on-Cash Return
2.3%
Cap rate
0.4%
Rent to Value Ratio

Active
$1,320,000
3
bds
|
2
ba
|
2,508
sqft
|
built
1955
38 Maple St, Lexington, MA 02420
$-4,471
Cash flow
-17.7%
Cash-on-Cash Return
2.2%
Cap rate
0.4%
Rent to Value Ratio

Active
$2,390,000
6
bds
|
4
ba
|
4,973
sqft
|
built
2004
134 Burlington St, Lexington, MA 02420
$-8,837
Cash flow
-19.3%
Cash-on-Cash Return
1.8%
Cap rate
0.3%
Rent to Value Ratio

Active
$3,595,000
6
bds
|
7
ba
|
6,086
sqft
|
built
2016
12 Cooke Rd, Lexington, MA 02420
$-15,471
Cash flow
-22.5%
Cash-on-Cash Return
1.1%
Cap rate
0.2%
Rent to Value Ratio

Active
$5,280,000
7
bds
|
10
ba
|
9,341
sqft
|
built
2025
10 Fairlawn Ln, Lexington, MA 02420
$-30,999
Cash flow
-30.6%
Cash-on-Cash Return
-0.8%
Cap rate
0.1%
Rent to Value Ratio
Active
$3,880,000
6
bds
|
7
ba
|
7,228
sqft
|
built
2025
18 Heritage Dr, Lexington, MA 02420
$-24,794
Cash flow
-33.3%
Cash-on-Cash Return
-1.4%
Cap rate
0.1%
Rent to Value Ratio
Active
$4,500,000
5
bds
|
8
ba
|
8,868
sqft
|
built
2025
197 Woburn St, Lexington, MA 02420
$-21,077
Cash flow
-24.4%
Cash-on-Cash Return
0.6%
Cap rate
0.1%
Rent to Value Ratio

Active
$3,200,000
5
bds
|
5
ba
|
5,482
sqft
|
built
2024
13 Woodland Rd, Lexington, MA 02420
$-15,356
Cash flow
-25.0%
Cash-on-Cash Return
0.5%
Cap rate
0.2%
Rent to Value Ratio

Active
$4,395,000
6
bds
|
7
ba
|
7,739
sqft
|
built
2024
15 Tyler Rd, Lexington, MA 02420
$-15,355
Cash flow
-18.2%
Cash-on-Cash Return
2.1%
Cap rate
0.3%
Rent to Value Ratio

Active
$4,199,999
7
bds
|
9
ba
|
6,662
sqft
|
built
2021
7 Fulton Rd, Lexington, MA 02420
$-19,906
Cash flow
-24.7%
Cash-on-Cash Return
0.6%
Cap rate
0.2%
Rent to Value Ratio

Active
$4,449,000
6
bds
|
8
ba
|
7,653
sqft
|
built
2025
8 Blueberry Ln, Lexington, MA 02420
$-20,191
Cash flow
-23.7%
Cash-on-Cash Return
0.8%
Cap rate
0.1%
Rent to Value Ratio

Active
$1,299,000
3
bds
|
2
ba
|
2,230
sqft
|
built
1952
101 Burlington St, Lexington, MA 02420
$-4,434
Cash flow
-17.8%
Cash-on-Cash Return
2.2%
Cap rate
0.4%
Rent to Value Ratio

Active
$4,250,000
6
bds
|
6
ba
|
6,905
sqft
|
built
2025
7 Whipple Rd, Lexington, MA 02420
$-19,706
Cash flow
-24.2%
Cash-on-Cash Return
0.7%
Cap rate
0.1%
Rent to Value Ratio
Active
$2,795,000
5
bds
|
6
ba
|
4,250
sqft
|
built
2025
17 Hamilton Rd, Lexington, MA 02420
$-19,889
Cash flow
-37.1%
Cash-on-Cash Return
-2.3%
Cap rate
0.2%
Rent to Value Ratio
Active
$6,100,000
6
bds
|
10
ba
|
8,649
sqft
|
built
2024
23 Thoreau Rd, Lexington, MA 02420
$-28,736
Cash flow
-24.6%
Cash-on-Cash Return
0.6%
Cap rate
0.2%
Rent to Value Ratio
Active
$4,395,000
6
bds
|
8
ba
|
6,196
sqft
|
built
2025
3 Brown Rd, Lexington, MA 02420
$-27,483
Cash flow
-32.6%
Cash-on-Cash Return
-1.2%
Cap rate
0.1%
Rent to Value Ratio
Active
$5,395,000
6
bds
|
10
ba
|
8,220
sqft
|
built
2009
23 Burroughs Rd, Lexington, MA 02420
$-25,017
Cash flow
-24.2%
Cash-on-Cash Return
0.7%
Cap rate
0.2%
Rent to Value Ratio

Active
$5,250,000
5
bds
|
8
ba
|
9,825
sqft
|
built
2003
197 Grant St, Lexington, MA 02420
$-23,332
Cash flow
-23.2%
Cash-on-Cash Return
0.9%
Cap rate
0.2%
Rent to Value Ratio

Active
$3,485,000
6
bds
|
6
ba
|
6,707
sqft
|
built
1985
7 Lothrop Cir, Lexington, MA 02420
$-13,576
Cash flow
-20.3%
Cash-on-Cash Return
1.6%
Cap rate
0.3%
Rent to Value Ratio