02563 Investment Properties for Sale
Browse homes for sale and investment properties in 02563. Refine your search by price, property type, or more.
Best cash flowing properties in 02563

Active
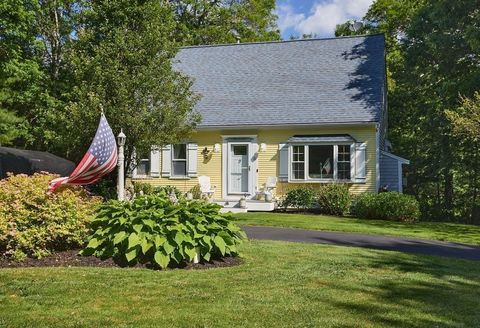
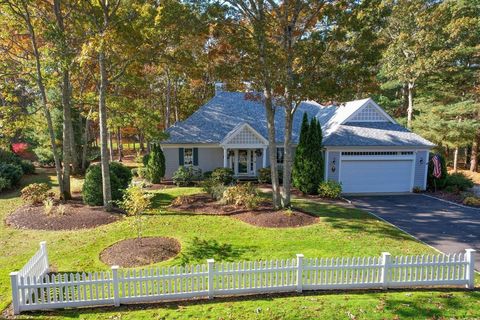
$599,000
3
bds
|
2
ba
|
1,056
sqft
|
built
1985
8 Holiday Ln, Sandwich, MA 02563
$-1,306
Cash flow
-11.4%
Cash-on-Cash Return
3.6%
Cap rate
0.5%
Rent to Value Ratio
Active
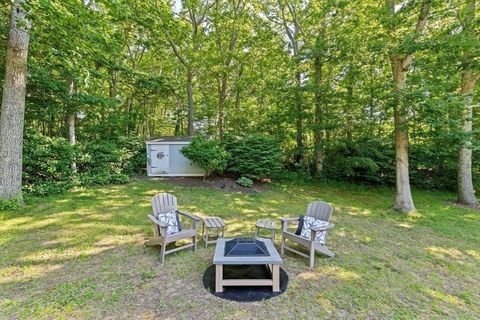
$669,000
3
bds
|
2
ba
|
1,547
sqft
|
built
1994
10 Ryder Cir, Sandwich, MA 02563
$-1,439
Cash flow
-11.2%
Cash-on-Cash Return
3.7%
Cap rate
0.5%
Rent to Value Ratio
27 out of 34 properties for sale in 02563
Limited Results Shown
Create a free account, or log in to reveal all property listings and enjoy the complete experience.
Active
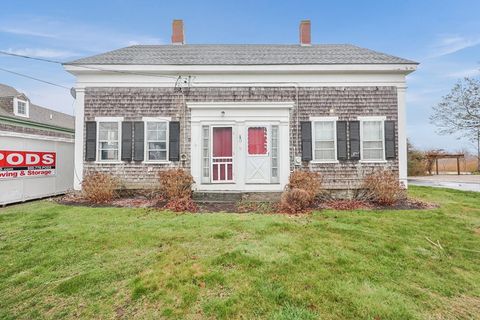
$699,000
3
bds
|
2
ba
|
1,144
sqft
|
built
1976
15 Surrey Ln, Sandwich, MA 02563
$-1,517
Cash flow
-11.3%
Cash-on-Cash Return
3.1%
Cap rate
0.5%
Rent to Value Ratio
Active
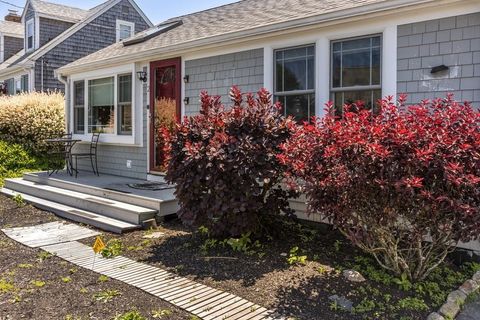
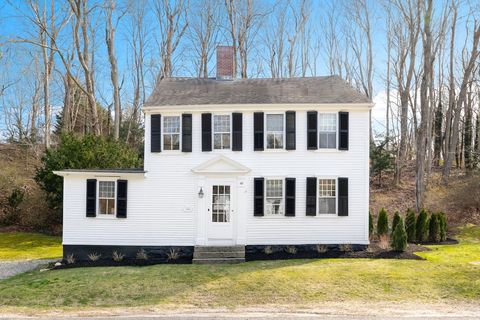
$699,900
4
bds
|
2
ba
|
3,108
sqft
|
built
1920
32 Church St, Sandwich, MA 02563
$-1,912
Cash flow
-14.3%
Cash-on-Cash Return
2.4%
Cap rate
0.4%
Rent to Value Ratio
Active
$525,000
2
bds
|
1
ba
|
620
sqft
|
built
1966
2 Feake Ave, Sandwich, MA 02563
$-1,600
Cash flow
-15.9%
Cash-on-Cash Return
2.6%
Cap rate
0.4%
Rent to Value Ratio
Active
$889,000
5
bds
|
5
ba
|
2,957
sqft
|
built
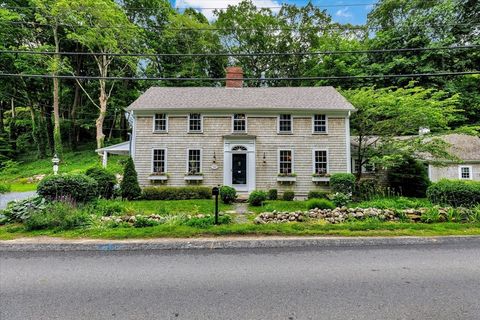
1816
108 Main St, Sandwich, MA 02563
$-2,440
Cash flow
-14.3%
Cash-on-Cash Return
2.9%
Cap rate
0.4%
Rent to Value Ratio
Active
$1,200,000
2
bds
|
2
ba
|
1,683
sqft
|
built
1937
19 Willow St, Sandwich, MA 02563
$-4,194
Cash flow
-18.2%
Cash-on-Cash Return
1.5%
Cap rate
0.3%
Rent to Value Ratio
Active
$1,600,000
4
bds
|
4
ba
|
3,337
sqft
|
built
1960
7 Sunrise Ln, Sandwich, MA 02563
$-6,220
Cash flow
-20.3%
Cash-on-Cash Return
1.6%
Cap rate
0.3%
Rent to Value Ratio

Active
$755,000
3
bds
|
3
ba
|
2,387
sqft
|
built
1961
6 Januit St, Sandwich, MA 02563
$-2,229
Cash flow
-15.4%
Cash-on-Cash Return
2.7%
Cap rate
0.4%
Rent to Value Ratio

Active
$975,000
3
bds
|
3
ba
|
1,622
sqft
|
built
1978
33 Dexter Ave, Sandwich, MA 02563
$-2,551
Cash flow
-13.7%
Cash-on-Cash Return
3.1%
Cap rate
0.5%
Rent to Value Ratio

Active
$699,000
2
bds
|
3
ba
|
1,760
sqft
|
built
2018
5 Whiffletree Cir, Sandwich, MA 02563
$-1,685
Cash flow
-12.6%
Cash-on-Cash Return
3.4%
Cap rate
0.5%
Rent to Value Ratio

Active
$839,900
3
bds
|
2
ba
|
1,008
sqft
|
built
1962
4 Knott Ave, Sandwich, MA 02563
$-2,705
Cash flow
-16.8%
Cash-on-Cash Return
2.4%
Cap rate
0.4%
Rent to Value Ratio

Active
$919,000
3
bds
|
2
ba
|
1,776
sqft
|
built
1968
47 Almy Ave, Sandwich, MA 02563
$-3,014
Cash flow
-17.1%
Cash-on-Cash Return
2.3%
Cap rate
0.4%
Rent to Value Ratio
Active
$610,000
3
bds
|
2
ba
|
1,062
sqft
|
built
1984
20 Nantucket Trl, Sandwich, MA 02563
$-1,452
Cash flow
-12.4%
Cash-on-Cash Return
3.4%
Cap rate
0.5%
Rent to Value Ratio

Active
$679,995
3
bds
|
2
ba
|
1,884
sqft
|
built
1973
13 Old Fields Rd, Sandwich, MA 02563
$-1,606
Cash flow
-12.3%
Cash-on-Cash Return
3.4%
Cap rate
0.5%
Rent to Value Ratio
Active
$950,000
2
bds
|
4
ba
|
3,668
sqft
|
built
2000
85 Reflection Dr, Sandwich, MA 02563
$-3,012
Cash flow
-16.5%
Cash-on-Cash Return
2.5%
Cap rate
0.5%
Rent to Value Ratio

Active
$999,000
3
bds
|
3
ba
|
2,332
sqft
|
built
1870
14 School St, Sandwich, MA 02563
$-2,786
Cash flow
-14.6%
Cash-on-Cash Return
2.9%
Cap rate
0.5%
Rent to Value Ratio
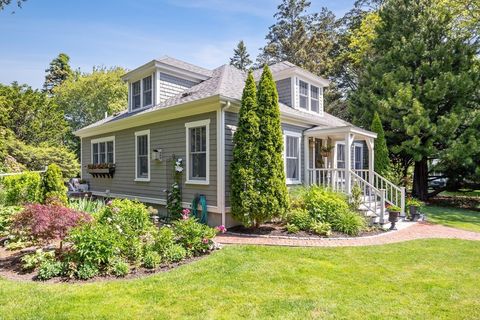
Active
$880,000
4
bds
|
2
ba
|
2,703
sqft
|
built
1740
118 Main St, Sandwich, MA 02563
$-2,365
Cash flow
-14.0%
Cash-on-Cash Return
3.0%
Cap rate
0.5%
Rent to Value Ratio

Active
$6,995,000
4
bds
|
4
ba
|
2,413
sqft
|
built
1940
63 Old Fields Rd, Sandwich, MA 02563
$-35,979
Cash flow
-26.8%
Cash-on-Cash Return
0.1%
Cap rate
0.0%
Rent to Value Ratio

Active
$899,000
2
bds
|
2
ba
|
1,504
sqft
|
built
1951
10 Chadwell Ave, Sandwich, MA 02563
$-3,364
Cash flow
-19.5%
Cash-on-Cash Return
1.8%
Cap rate
0.3%
Rent to Value Ratio

Active
$2,275,000
5
bds
|
6
ba
|
7,270
sqft
|
built
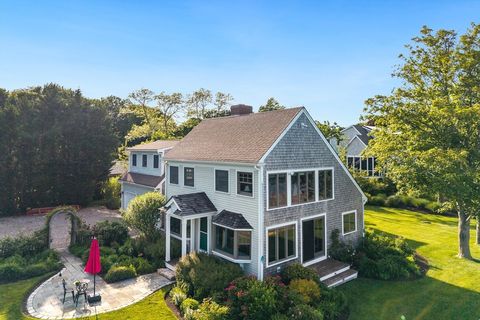
1833
143 Main St, Sandwich, MA 02563
$-8,108
Cash flow
-18.6%
Cash-on-Cash Return
2.0%
Cap rate
0.3%
Rent to Value Ratio

Active
$1,999,000
5
bds
|
6
ba
|
6,418
sqft
|
built
2000
10 Wintergreen Ln, Sandwich, MA 02563
$-8,378
Cash flow
-21.9%
Cash-on-Cash Return
1.2%
Cap rate
0.3%
Rent to Value Ratio

Active
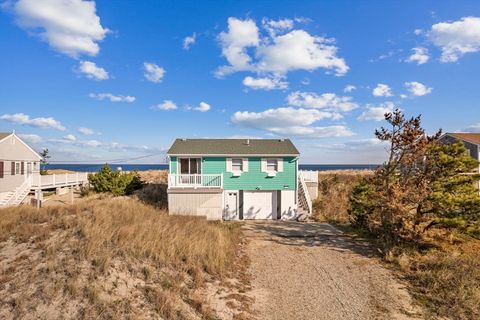
$749,900
2
bds
|
1
ba
|
770
sqft
|
built
1958
357 Phillips Rd, Sandwich, MA 02563
$-2,638
Cash flow
-18.4%
Cash-on-Cash Return
2.0%
Cap rate
0.3%
Rent to Value Ratio

Active
$650,000
4
bds
|
2
ba
|
1,776
sqft
|
built
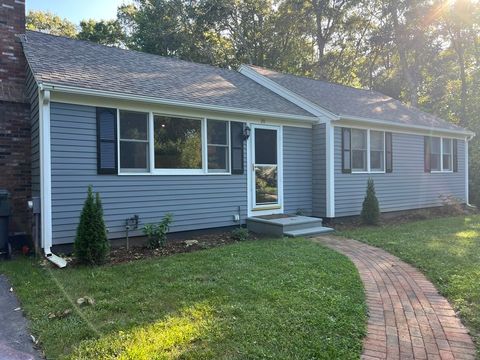
1978
62 Windsor Rd, Sandwich, MA 02563
$-1,657
Cash flow
-13.3%
Cash-on-Cash Return
3.2%
Cap rate
0.5%
Rent to Value Ratio

Active
$1,899,000
4
bds
|
4
ba
|
3,499
sqft
|
built
2020
69 Knott Ave, Sandwich, MA 02563
$-6,515
Cash flow
-17.9%
Cash-on-Cash Return
2.1%
Cap rate
0.3%
Rent to Value Ratio
Active
$1,899,000
3
bds
|
2
ba
|
1,030
sqft
|
built
1950
311 Phillips Rd, Sandwich, MA 02563
$-7,813
Cash flow
-21.5%
Cash-on-Cash Return
1.3%
Cap rate
0.3%
Rent to Value Ratio

Active
$836,000
3
bds
|
3
ba
|
2,116
sqft
|
built
1996
13 Quail Hollow Cir, Sandwich, MA 02563
$-2,253
Cash flow
-14.1%
Cash-on-Cash Return
3.0%
Cap rate
0.5%
Rent to Value Ratio