02745 Investment Properties for Sale
Browse homes for sale and investment properties in 02745. Refine your search by price, property type, or more.
Best cash flowing properties in 02745
Active
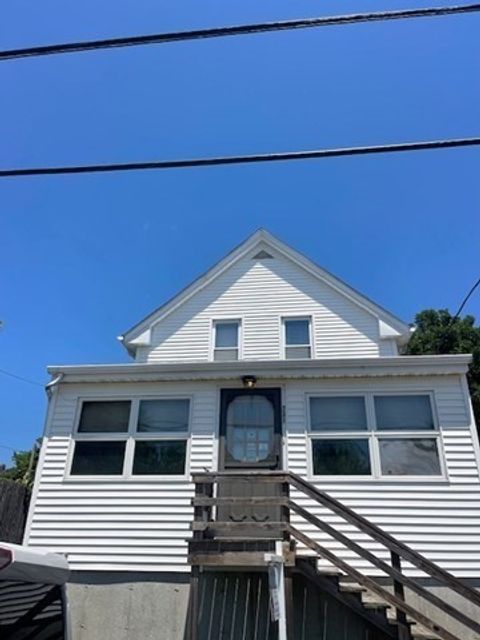
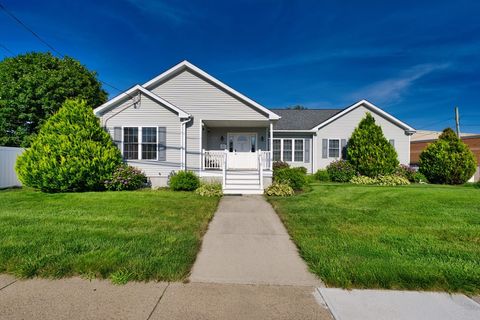
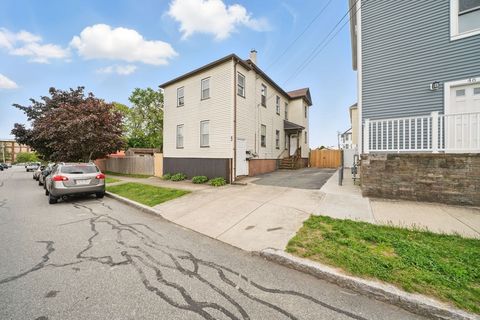
$339,900
4
bds
|
1
ba
|
1,400
sqft
|
built
1913
231 Irvington St, New Bedford, MA 02745
$9
Cash flow
0.1%
Cash-on-Cash Return
5.7%
Cap rate
0.8%
Rent to Value Ratio
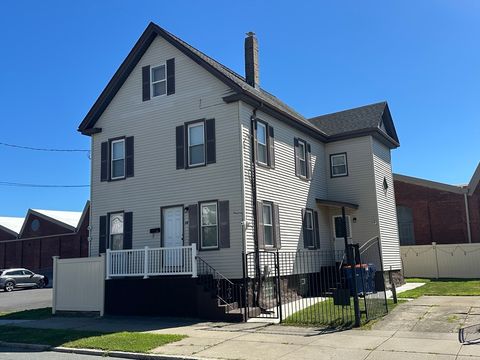
Active
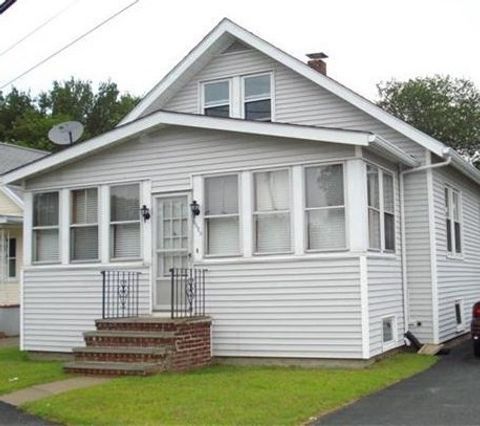
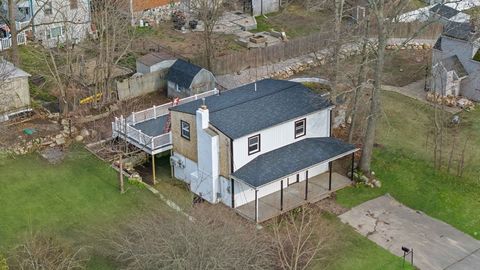
$375,000
4
bds
|
2
ba
|
1,040
sqft
|
built
1925
3020 Acushnet Ave, New Bedford, MA 02745
$-249
Cash flow
-3.5%
Cash-on-Cash Return
4.9%
Cap rate
0.7%
Rent to Value Ratio
14 out of 16 properties for sale in 02745
Limited Results Shown
Create a free account, or log in to reveal all property listings and enjoy the complete experience.
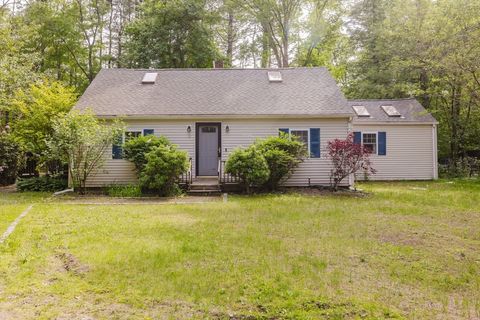
Active
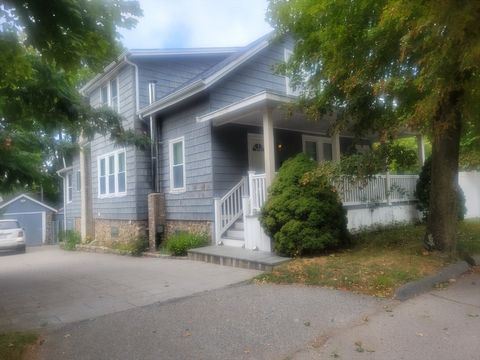
$689,000
5
bds
|
3
ba
|
2,800
sqft
|
built
1920
683 Church St, New Bedford, MA 02745
$-1,901
Cash flow
-14.4%
Cash-on-Cash Return
2.4%
Cap rate
0.4%
Rent to Value Ratio
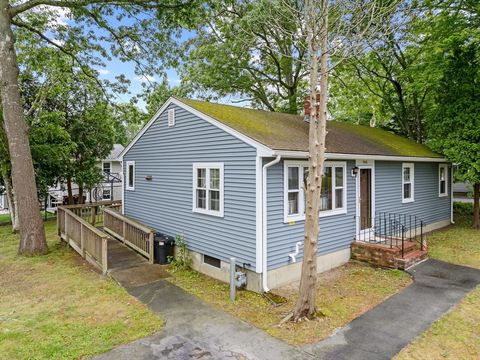
Active
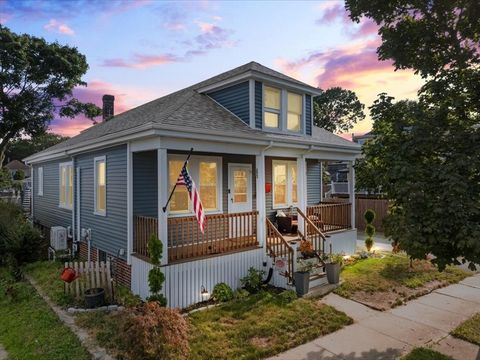
$449,000
3
bds
|
1
ba
|
1,292
sqft
|
built
1927
370 Wood St, New Bedford, MA 02745
$-689
Cash flow
-8.0%
Cash-on-Cash Return
3.8%
Cap rate
0.6%
Rent to Value Ratio
Active
$599,900
3
bds
|
3
ba
|
2,430
sqft
|
built
2015
957 Glen St, New Bedford, MA 02745
$-1,170
Cash flow
-10.2%
Cash-on-Cash Return
3.3%
Cap rate
0.5%
Rent to Value Ratio
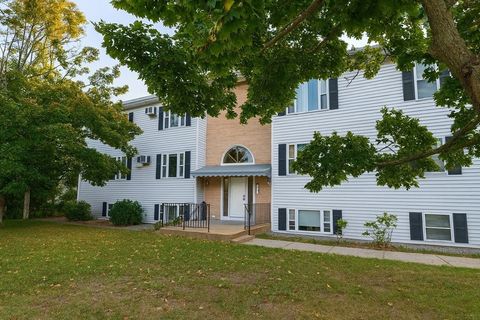
Active
$289,900
2
bds
|
1
ba
|
800
sqft
|
built
1988
3289 Acushnet Ave, New Bedford, MA 02745
$-482
Cash flow
-8.7%
Cash-on-Cash Return
3.7%
Cap rate
0.7%
Rent to Value Ratio
Active
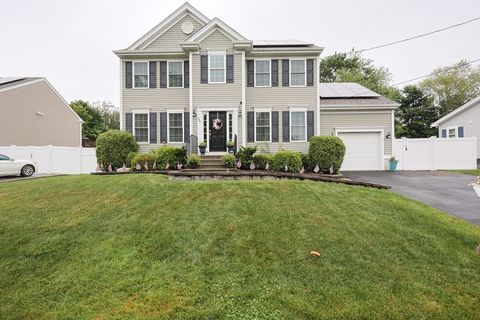
$550,000
3
bds
|
3
ba
|
2,017
sqft
|
built
1985
26 Rounseville St, New Bedford, MA 02745
$-1,008
Cash flow
-9.6%
Cash-on-Cash Return
3.5%
Cap rate
0.5%
Rent to Value Ratio
Active
$500,000
3
bds
|
2
ba
|
1,288
sqft
|
built
1993
868 Phillips Rd, New Bedford, MA 02745
$-870
Cash flow
-9.1%
Cash-on-Cash Return
3.6%
Cap rate
0.6%
Rent to Value Ratio
Active
$565,000
3
bds
|
2
ba
|
1,912
sqft
|
built
2014
2992 Acushnet Ave, New Bedford, MA 02745
$-1,120
Cash flow
-10.3%
Cash-on-Cash Return
3.3%
Cap rate
0.6%
Rent to Value Ratio
Active
$459,000
4
bds
|
2
ba
|
2,003
sqft
|
built
1906
18 Edison St, New Bedford, MA 02745
$-972
Cash flow
-11.0%
Cash-on-Cash Return
3.1%
Cap rate
0.5%
Rent to Value Ratio
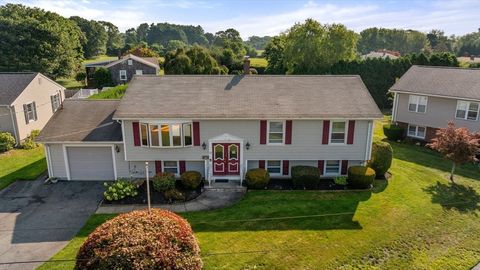
Active
$525,000
4
bds
|
2
ba
|
1,821
sqft
|
built
1957
13 Luscomb Ln, New Bedford, MA 02745
$-425
Cash flow
-4.2%
Cash-on-Cash Return
4.7%
Cap rate
0.7%
Rent to Value Ratio
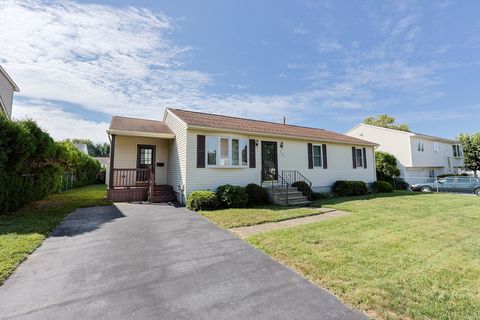
Active
$414,900
3
bds
|
1
ba
|
1,000
sqft
|
built
1980
946 Thorndike St, New Bedford, MA 02745
$-576
Cash flow
-7.2%
Cash-on-Cash Return
4.0%
Cap rate
0.6%
Rent to Value Ratio
Active
$539,000
3
bds
|
2
ba
|
1,612
sqft
|
built
1916
42 Query St, New Bedford, MA 02745
$-1,358
Cash flow
-13.1%
Cash-on-Cash Return
2.7%
Cap rate
0.4%
Rent to Value Ratio
Active
$449,900
4
bds
|
2
ba
|
1,320
sqft
|
built
1937
112 Worcester St, New Bedford, MA 02745
$-1,316
Cash flow
-15.3%
Cash-on-Cash Return
2.2%
Cap rate
0.4%
Rent to Value Ratio