02790 Investment Properties for Sale
Browse homes for sale and investment properties in 02790. Refine your search by price, property type, or more.
Best cash flowing properties in 02790
Active
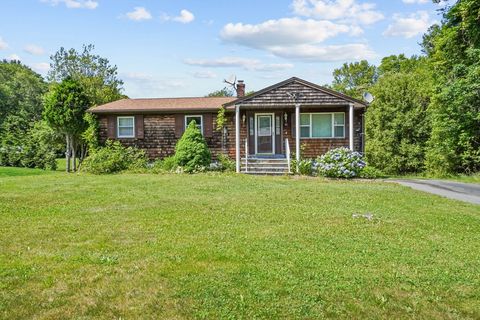
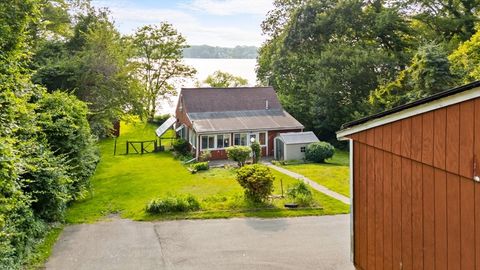
$400,000
3
bds
|
1
ba
|
1,200
sqft
|
built
1971
92 Benoit St, Westport, MA 02790
$-176
Cash flow
-2.3%
Cash-on-Cash Return
5.2%
Cap rate
0.7%
Rent to Value Ratio
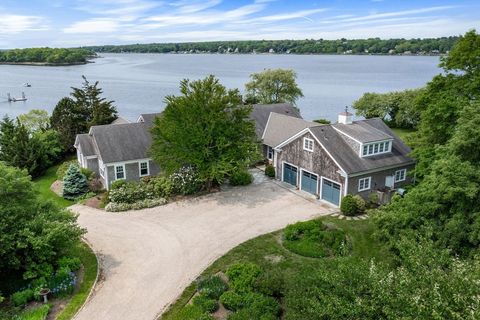
Active
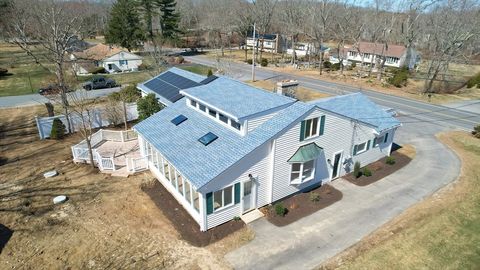
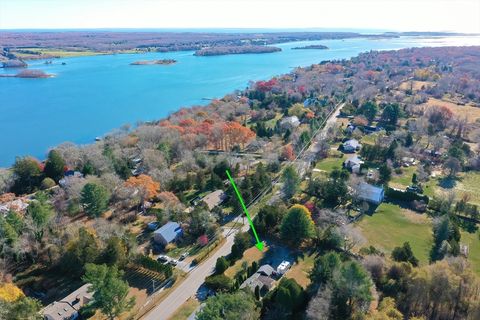
$675,000
3
bds
|
2
ba
|
2,920
sqft
|
built
1963
180 Tickle Rd, Westport, MA 02790
$-1,026
Cash flow
-7.9%
Cash-on-Cash Return
3.9%
Cap rate
0.5%
Rent to Value Ratio
20 out of 21 properties for sale in 02790
Limited Results Shown
Create a free account, or log in to reveal all property listings and enjoy the complete experience.
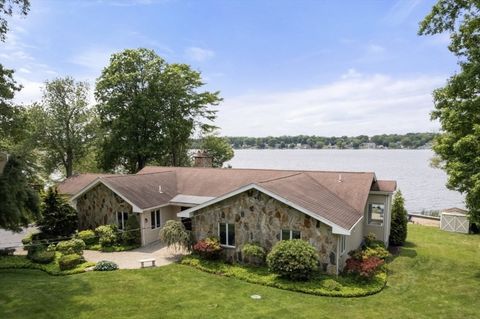
Active
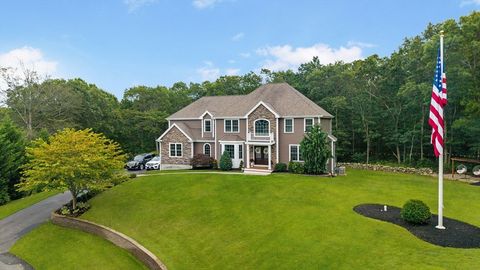
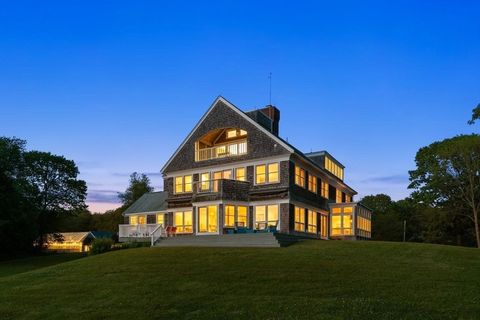
$1,299,000
4
bds
|
3
ba
|
3,899
sqft
|
built
2015
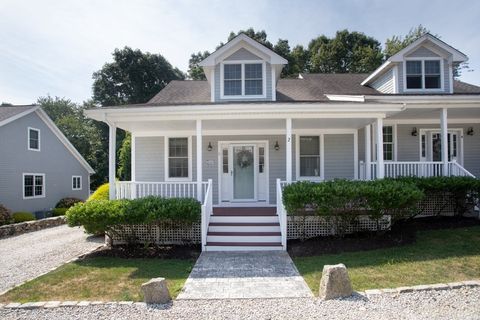
47 Devol Ave, Westport, MA 02790
$-2,782
Cash flow
-11.2%
Cash-on-Cash Return
3.1%
Cap rate
0.4%
Rent to Value Ratio
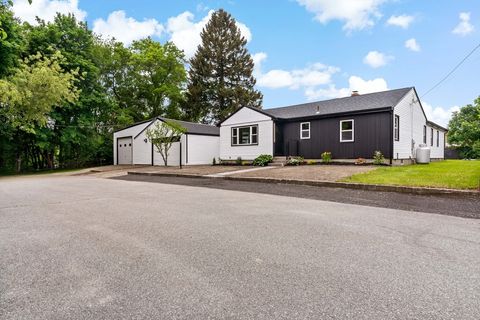
Active
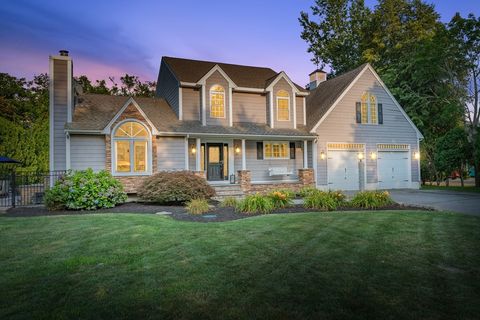
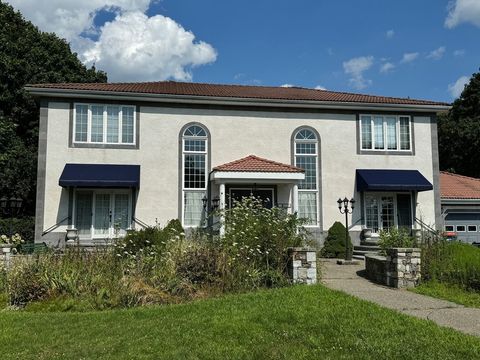
$890,000
4
bds
|
3
ba
|
2,698
sqft
|
built
1996
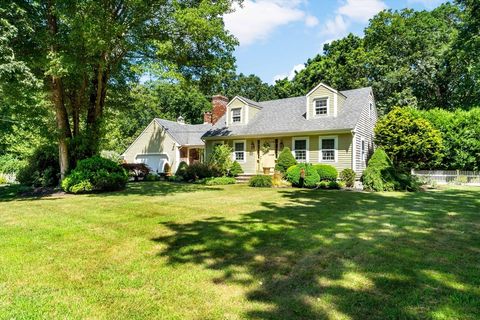
2 Lawtons Ln, Westport, MA 02790
$-1,606
Cash flow
-9.4%
Cash-on-Cash Return
3.5%
Cap rate
0.5%
Rent to Value Ratio
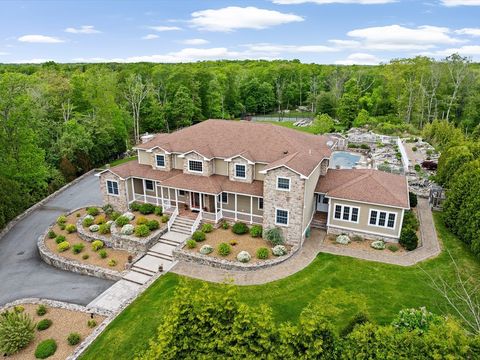
Active
$1,750,000
5
bds
|
2
ba
|
2,557
sqft
|
built
1900
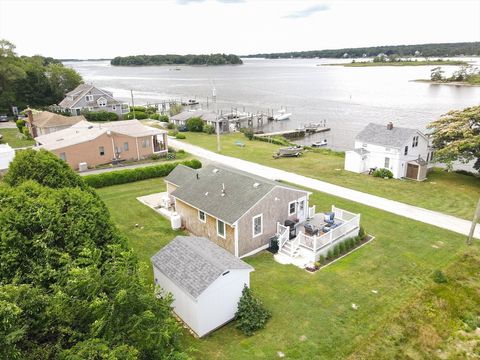
143 Horseneck Rd, Westport, MA 02790
$-5,995
Cash flow
-17.9%
Cash-on-Cash Return
1.6%
Cap rate
0.2%
Rent to Value Ratio
Active
$545,000
1
bds
|
2
ba
|
2,080
sqft
|
built
2008
1346 Main Rd, Westport, MA 02790
$-1,435
Cash flow
-13.7%
Cash-on-Cash Return
2.5%
Cap rate
0.5%
Rent to Value Ratio
Active
$699,900
3
bds
|
2
ba
|
1,757
sqft
|
built
1969
100 D Dr, Westport, MA 02790
$-1,375
Cash flow
-10.2%
Cash-on-Cash Return
3.3%
Cap rate
0.5%
Rent to Value Ratio
Active
$875,000
2
bds
|
1
ba
|
804
sqft
|
built
1960
99 Sylvia Ln, Westport, MA 02790
$-3,293
Cash flow
-19.6%
Cash-on-Cash Return
1.2%
Cap rate
0.2%
Rent to Value Ratio
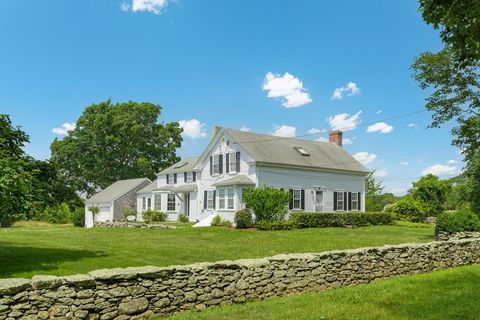
Active
$3,189,000
4
bds
|
3
ba
|
1,979
sqft
|
built
1770
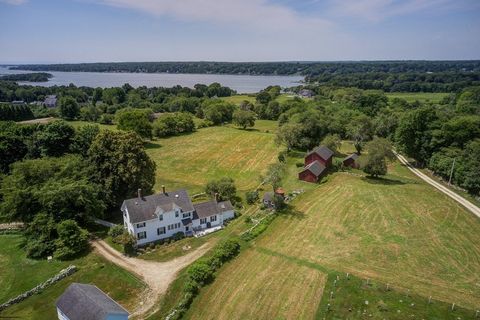
177 Howland Rd, Westport, MA 02790
$-13,400
Cash flow
-21.9%
Cash-on-Cash Return
0.6%
Cap rate
0.1%
Rent to Value Ratio
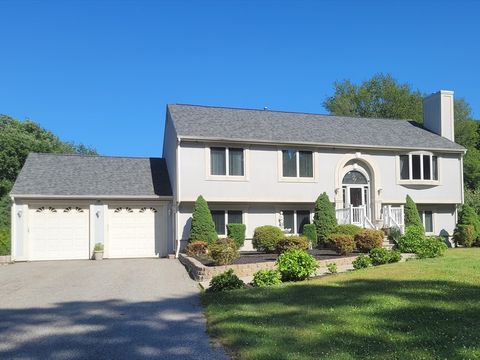
Active
$1,625,000
3
bds
|
3
ba
|
3,472
sqft
|
built
1976
47 Fallon Dr, Westport, MA 02790
$-5,197
Cash flow
-16.7%
Cash-on-Cash Return
1.8%
Cap rate
0.3%
Rent to Value Ratio
Active
$710,000
3
bds
|
2
ba
|
1,838
sqft
|
built
2000
211 Tickle Rd, Westport, MA 02790
$-1,545
Cash flow
-11.4%
Cash-on-Cash Return
3.1%
Cap rate
0.5%
Rent to Value Ratio
Active
$1,250,000
3
bds
|
1
ba
|
1,428
sqft
|
built
1930
1518 Drift Rd, Westport, MA 02790
$-4,548
Cash flow
-19.0%
Cash-on-Cash Return
1.3%
Cap rate
0.2%
Rent to Value Ratio
Active
$3,775,000
4
bds
|
5
ba
|
5,000
sqft
|
built
1978
37 Glen Rd, Westport, MA 02790
$-13,754
Cash flow
-19.0%
Cash-on-Cash Return
1.3%
Cap rate
0.2%
Rent to Value Ratio
Active
$1,198,000
4
bds
|
5
ba
|
5,552
sqft
|
built
1987
41 Plymouth Blvd, Westport, MA 02790
$-2,829
Cash flow
-12.3%
Cash-on-Cash Return
2.8%
Cap rate
0.4%
Rent to Value Ratio
Active
$669,900
3
bds
|
2
ba
|
2,276
sqft
|
built
1962
23 Donna St, Westport, MA 02790
$-1,428
Cash flow
-11.1%
Cash-on-Cash Return
3.1%
Cap rate
0.4%
Rent to Value Ratio
Active
$2,995,000
5
bds
|
6
ba
|
11,880
sqft
|
built
2008
33 Moniz Dr, Westport, MA 02790
$-11,855
Cash flow
-20.7%
Cash-on-Cash Return
0.9%
Cap rate
0.2%
Rent to Value Ratio
Active
$589,000
3
bds
|
2
ba
|
1,272
sqft
|
built
1952
165 Plymouth Blvd, Westport, MA 02790
$-1,043
Cash flow
-9.2%
Cash-on-Cash Return
3.6%
Cap rate
0.5%
Rent to Value Ratio
Active
$495,000
1
bds
|
1
ba
|
596
sqft
|
built
1945
1371 Drift Rd, Westport, MA 02790
$-1,445
Cash flow
-15.2%
Cash-on-Cash Return
2.2%
Cap rate
0.4%
Rent to Value Ratio
Active
$3,950,000
5
bds
|
7
ba
|
7,561
sqft
|
built
1989
1069 Horseneck Rd, Westport, MA 02790
$-16,669
Cash flow
-22.0%
Cash-on-Cash Return
0.6%
Cap rate
0.1%
Rent to Value Ratio
Active
$884,900
4
bds
|
3
ba
|
3,284
sqft
|
built
1989
116 Gifford Rd, Westport, MA 02790
$-1,287
Cash flow
-7.6%
Cash-on-Cash Return
3.9%
Cap rate
0.6%
Rent to Value Ratio