30017 Investment Properties for Sale
Browse homes for sale and investment properties in 30017. Refine your search by price, property type, or more.
Best cash flowing properties in 30017
Active
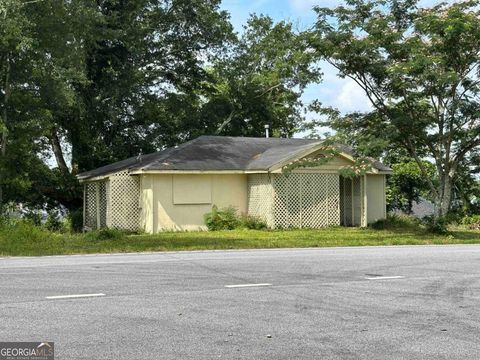
$180,000
3
bds
|
0
ba
|
1,224
sqft
|
built
1940
1891 Bennett Rd, Grayson, GA 30017
$-47
Cash flow
-1.4%
Cash-on-Cash Return
5.8%
Cap rate
0.8%
Rent to Value Ratio

Active
$374,900
2
bds
|
2
ba
|
1,806
sqft
|
built
2021
2678 Songbird Ln, Grayson, GA 30017
$-419
Cash flow
-5.8%
Cash-on-Cash Return
4.8%
Cap rate
0.7%
Rent to Value Ratio
78 out of 81 properties for sale in 30017
Limited Results Shown
Create a free account, or log in to reveal all property listings and enjoy the complete experience.
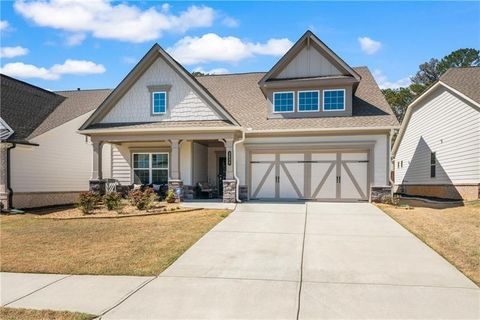
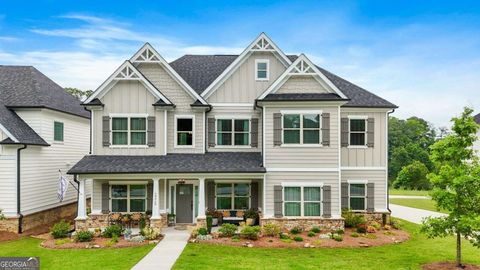
Active
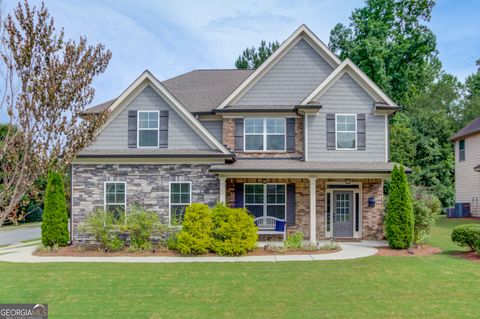
$470,000
4
bds
|
3.5
ba
|
2,855
sqft
|
built
2019
1565 Stargrass Dr, Grayson, GA 30017
$-745
Cash flow
-8.3%
Cash-on-Cash Return
4.2%
Cap rate
0.7%
Rent to Value Ratio
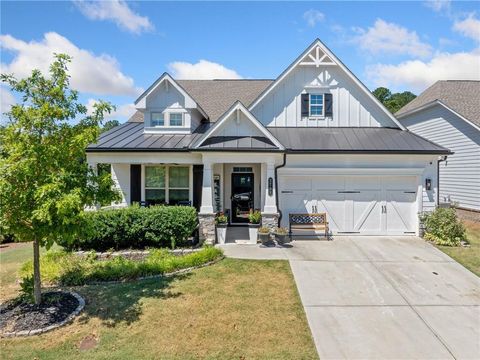
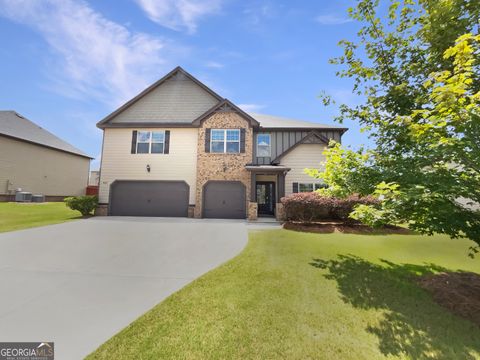
Active
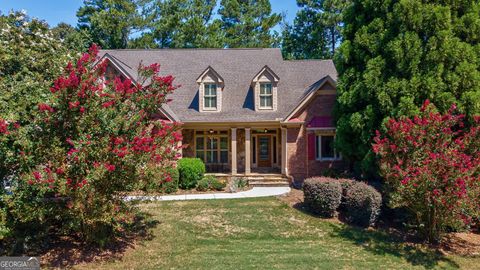
$695,000
5
bds
|
4
ba
|
3,576
sqft
|
built
2005
627 Heritage Post Ln, Grayson, GA 30017
$-1,587
Cash flow
-11.9%
Cash-on-Cash Return
3.4%
Cap rate
0.5%
Rent to Value Ratio
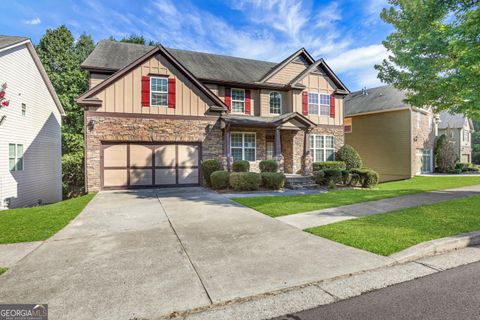
Active
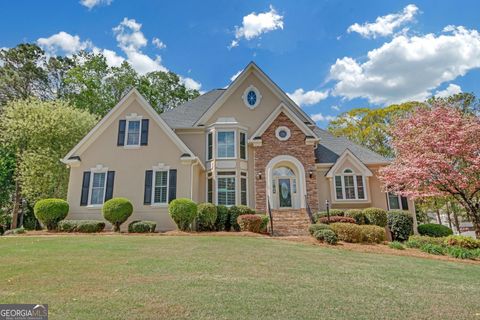
$725,000
6
bds
|
4.5
ba
|
5,696
sqft
|
built
1994
1405 Wilmington Way, Grayson, GA 30017
$-2,200
Cash flow
-15.8%
Cash-on-Cash Return
2.5%
Cap rate
0.4%
Rent to Value Ratio
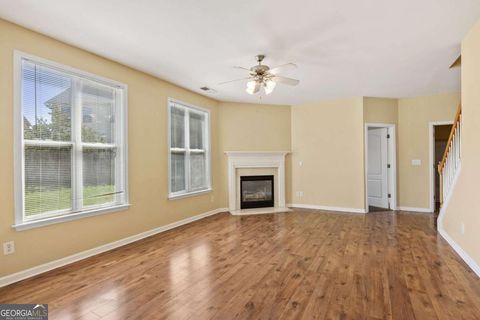
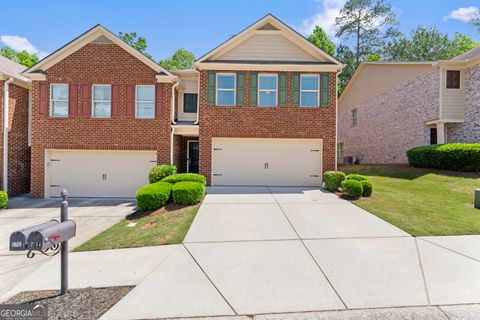
Active
$434,900
3
bds
|
3
ba
|
2,466
sqft
|
built
2021
2638 Songbird Ln, Grayson, GA 30017
$-803
Cash flow
-9.6%
Cash-on-Cash Return
3.9%
Cap rate
0.7%
Rent to Value Ratio
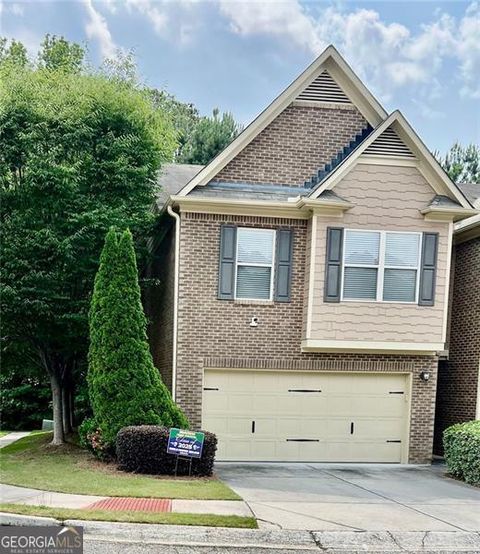
Active
$455,000
4
bds
|
3
ba
|
0
sqft
|
built
2021
2708 Songbird Ln, Grayson, GA 30017
$-967
Cash flow
-11.1%
Cash-on-Cash Return
3.6%
Cap rate
0.5%
Rent to Value Ratio
Active
$499,900
6
bds
|
5
ba
|
5,675
sqft
|
built
2006
410 Chandler Bluff Ct, Grayson, GA 30017
$-1,055
Cash flow
-11.0%
Cash-on-Cash Return
3.6%
Cap rate
0.6%
Rent to Value Ratio
Active
$450,000
5
bds
|
0
ba
|
2,964
sqft
|
built
2007
1122 Tranquil Lake Dr, Grayson, GA 30017
$-1,126
Cash flow
-13.1%
Cash-on-Cash Return
3.1%
Cap rate
0.6%
Rent to Value Ratio
Active
$950,000
6
bds
|
5
ba
|
8,155
sqft
|
built
2007
866 Coopers Ridge Path, Grayson, GA 30017
$-3,476
Cash flow
-19.1%
Cash-on-Cash Return
1.8%
Cap rate
0.3%
Rent to Value Ratio
Active
$799,900
7
bds
|
5.5
ba
|
5,732
sqft
|
built
2002
1360 Mount Mc Kinley Dr, Grayson, GA 30017
$-2,041
Cash flow
-13.3%
Cash-on-Cash Return
3.1%
Cap rate
0.5%
Rent to Value Ratio
Active
$439,990
3
bds
|
3
ba
|
0
sqft
|
built
2000
1010 Capella Creek Way, Grayson, GA 30017
$-625
Cash flow
-7.4%
Cash-on-Cash Return
4.4%
Cap rate
0.6%
Rent to Value Ratio

Active
$1,000,000
5
bds
|
0
ba
|
6,700
sqft
|
built
2006
692 Heritage Post Ln, Grayson, GA 30017
$-2,353
Cash flow
-12.3%
Cash-on-Cash Return
3.3%
Cap rate
0.5%
Rent to Value Ratio
Active
$349,900
3
bds
|
0
ba
|
1,493
sqft
|
built
1988
250 Meadow View Dr, Grayson, GA 30017
$-737
Cash flow
-11.0%
Cash-on-Cash Return
3.7%
Cap rate
0.6%
Rent to Value Ratio
Active
$580,000
5
bds
|
0
ba
|
0
sqft
|
built
2022
2326 Britt St, Grayson, GA 30017
$-1,270
Cash flow
-11.4%
Cash-on-Cash Return
3.5%
Cap rate
0.6%
Rent to Value Ratio
Active
$531,000
5
bds
|
3.5
ba
|
3,682
sqft
|
built
2015
622 Madison Park Dr, Grayson, GA 30017
$-1,155
Cash flow
-11.3%
Cash-on-Cash Return
3.5%
Cap rate
0.6%
Rent to Value Ratio
Active
$335,000
3
bds
|
0
ba
|
1,778
sqft
|
built
2011
2714 Haynescrest Dr, Grayson, GA 30017
$-744
Cash flow
-11.6%
Cash-on-Cash Return
3.5%
Cap rate
0.7%
Rent to Value Ratio
Active
$325,000
3
bds
|
0
ba
|
1,864
sqft
|
built
2008
2691 Pointcrest Way, Grayson, GA 30017
$-672
Cash flow
-10.8%
Cash-on-Cash Return
3.7%
Cap rate
0.6%
Rent to Value Ratio

Active
$480,000
5
bds
|
0
ba
|
2,821
sqft
|
built
2002
300 Brackin Trce, Grayson, GA 30017
$-879
Cash flow
-9.6%
Cash-on-Cash Return
4.0%
Cap rate
0.5%
Rent to Value Ratio

Active
$545,000
5
bds
|
4
ba
|
3,861
sqft
|
built
2004
871 Windsor Creek Dr, Grayson, GA 30017
$-1,294
Cash flow
-12.4%
Cash-on-Cash Return
3.3%
Cap rate
0.5%
Rent to Value Ratio
Active
$356,000
3
bds
|
0
ba
|
0
sqft
|
built
2022
1388 Ben Park Way, Grayson, GA 30017
$-803
Cash flow
-11.8%
Cash-on-Cash Return
3.4%
Cap rate
0.6%
Rent to Value Ratio

Active
$624,900
5
bds
|
0
ba
|
5,121
sqft
|
built
2001
1640 Mount Mc Kinley Dr, Grayson, GA 30017
$-1,520
Cash flow
-12.7%
Cash-on-Cash Return
3.2%
Cap rate
0.5%
Rent to Value Ratio

Active
$500,000
4
bds
|
0
ba
|
2,875
sqft
|
built
2003
836 Windsor Place Ct, Grayson, GA 30017
$-971
Cash flow
-10.1%
Cash-on-Cash Return
3.8%
Cap rate
0.5%
Rent to Value Ratio

Active
$600,000
4
bds
|
0
ba
|
3,058
sqft
|
built
1994
1360 Wilmington Way, Grayson, GA 30017
$-1,271
Cash flow
-11.1%
Cash-on-Cash Return
3.6%
Cap rate
0.6%
Rent to Value Ratio

Active
$620,000
5
bds
|
0
ba
|
2,715
sqft
|
built
1999
1304 Swallows Walk, Grayson, GA 30017
$-1,427
Cash flow
-12.0%
Cash-on-Cash Return
3.4%
Cap rate
0.6%
Rent to Value Ratio

Active
$660,000
5
bds
|
0
ba
|
6,316
sqft
|
built
1997
1561 Annapolis Way, Grayson, GA 30017
$-1,217
Cash flow
-9.6%
Cash-on-Cash Return
3.9%
Cap rate
0.7%
Rent to Value Ratio

Active
$999,996
7
bds
|
0
ba
|
7,641
sqft
|
built
2005
2609 Jacobs Crest Cv, Grayson, GA 30017
$-3,897
Cash flow
-20.3%
Cash-on-Cash Return
1.5%
Cap rate
0.4%
Rent to Value Ratio

Active
$324,000
3
bds
|
0
ba
|
0
sqft
|
built
1984
2055 Pinella Dr, Grayson, GA 30017
$-725
Cash flow
-11.7%
Cash-on-Cash Return
3.5%
Cap rate
0.6%
Rent to Value Ratio

Active
$359,900
3
bds
|
0
ba
|
1,746
sqft
|
built
2021
1363 Cooper Springs Rd, Grayson, GA 30017
$-579
Cash flow
-8.4%
Cash-on-Cash Return
4.2%
Cap rate
0.7%
Rent to Value Ratio

Active
$390,000
4
bds
|
0
ba
|
0
sqft
|
built
1996
1818 Mc Connell Rd, Grayson, GA 30017
$-551
Cash flow
-7.4%
Cash-on-Cash Return
4.5%
Cap rate
0.6%
Rent to Value Ratio

Active
$510,000
4
bds
|
3
ba
|
0
sqft
|
built
2000
2260 Cobble Creek Ln, Grayson, GA 30017
$-1,166
Cash flow
-11.9%
Cash-on-Cash Return
3.4%
Cap rate
0.6%
Rent to Value Ratio

Active
$629,900
5
bds
|
0
ba
|
3,957
sqft
|
built
2006
1771 Silvergrass Ln, Grayson, GA 30017
$-1,744
Cash flow
-14.4%
Cash-on-Cash Return
2.8%
Cap rate
0.5%
Rent to Value Ratio

Active
$420,000
5
bds
|
0
ba
|
6,432
sqft
|
built
2006
1875 Cutleaf Creek Rd, Grayson, GA 30017
$-821
Cash flow
-10.2%
Cash-on-Cash Return
3.8%
Cap rate
0.6%
Rent to Value Ratio
Active
$435,000
2
bds
|
2
ba
|
0
sqft
|
built
2023
740 Pineberry Ct, Grayson, GA 30017
$-1,440
Cash flow
-17.3%
Cash-on-Cash Return
2.2%
Cap rate
0.5%
Rent to Value Ratio

Active
$425,000
4
bds
|
0
ba
|
0
sqft
|
built
1994
270 Meadow View Dr, Grayson, GA 30017
$-904
Cash flow
-11.1%
Cash-on-Cash Return
3.6%
Cap rate
0.5%
Rent to Value Ratio

Active
$490,000
5
bds
|
0
ba
|
3,472
sqft
|
built
1999
2295 Amberbrook Ln, Grayson, GA 30017
$-1,032
Cash flow
-11.0%
Cash-on-Cash Return
3.6%
Cap rate
0.6%
Rent to Value Ratio

Active
$385,000
3
bds
|
0
ba
|
2,070
sqft
|
built
2002
1186 Hawthorn Ln, Grayson, GA 30017
$-763
Cash flow
-10.3%
Cash-on-Cash Return
3.8%
Cap rate
0.6%
Rent to Value Ratio

Active
$575,000
5
bds
|
3
ba
|
3,088
sqft
|
built
2016
1021 Reddy Farm Rd, Grayson, GA 30017
$-1,597
Cash flow
-14.5%
Cash-on-Cash Return
2.8%
Cap rate
0.5%
Rent to Value Ratio

Active
$285,000
2
bds
|
0
ba
|
1,325
sqft
|
built
2004
175 Camry Ln, Grayson, GA 30017
$-806
Cash flow
-14.8%
Cash-on-Cash Return
2.8%
Cap rate
0.6%
Rent to Value Ratio

Active
$439,900
3
bds
|
0
ba
|
2,398
sqft
|
built
2004
2291 Mission Oak Ter, Grayson, GA 30017
$-755
Cash flow
-9.0%
Cash-on-Cash Return
4.1%
Cap rate
0.7%
Rent to Value Ratio