33019 Investment Properties for Sale
Browse homes for sale and investment properties in 33019. Refine your search by price, property type, or more.
Best cash flowing properties in 33019

Active
$285,000
1
bds
|
2
ba
|
850
sqft
|
built
1971
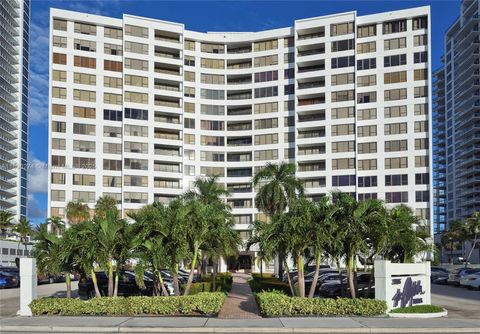
211 S Ocean Dr, Hollywood, FL 33019
$-102
Cash flow
-1.9%
Cash-on-Cash Return
5.7%
Cap rate
0.9%
Rent to Value Ratio
Active
$380,000
2
bds
|
2
ba
|
1,370
sqft
|
built
1968
3505 S Ocean Dr, Hollywood, FL 33019
$-290
Cash flow
-4.0%
Cash-on-Cash Return
5.2%
Cap rate
0.9%
Rent to Value Ratio
508 out of 631 properties for sale in 33019
Limited Results Shown
Create a free account, or log in to reveal all property listings and enjoy the complete experience.

Active
$395,000
1
bds
|
1
ba
|
817
sqft
|
built
1966
3001 S Ocean Dr, Hollywood, FL 33019
$-1,779
Cash flow
-23.5%
Cash-on-Cash Return
0.7%
Cap rate
0.6%
Rent to Value Ratio
Active
$1,299,000
3
bds
|
3
ba
|
2,204
sqft
|
built
2000
1375 Harbor Vw E, Hollywood, FL 33019
$-3,390
Cash flow
-13.6%
Cash-on-Cash Return
3.0%
Cap rate
0.7%
Rent to Value Ratio

Active
$290,000
1
bds
|
2
ba
|
874
sqft
|
built
1970
1410 S Ocean Dr, Hollywood, FL 33019
$-501
Cash flow
-9.0%
Cash-on-Cash Return
4.1%
Cap rate
0.9%
Rent to Value Ratio

Active
$730,000
3
bds
|
2
ba
|
1,150
sqft
|
built
1957
922 N 13th Ter, Hollywood, FL 33019
$-2,103
Cash flow
-15.0%
Cash-on-Cash Return
2.7%
Cap rate
0.5%
Rent to Value Ratio

Active
$445,000
2
bds
|
2
ba
|
1,212
sqft
|
built
1970
3000 S Ocean Dr, Hollywood, FL 33019
$-2,074
Cash flow
-24.3%
Cash-on-Cash Return
0.6%
Cap rate
0.7%
Rent to Value Ratio

Active
$465,000
1
bds
|
1
ba
|
540
sqft
|
built
1985
311 Connecticut St, Hollywood, FL 33019
$-1,444
Cash flow
-16.2%
Cash-on-Cash Return
2.4%
Cap rate
0.6%
Rent to Value Ratio

Active
$320,000
1
bds
|
2
ba
|
900
sqft
|
built
1973
3800 S Ocean Dr, Hollywood, FL 33019
$-1,232
Cash flow
-20.1%
Cash-on-Cash Return
1.5%
Cap rate
0.8%
Rent to Value Ratio

Active
$300,000
2
bds
|
2
ba
|
1,250
sqft
|
built
1968
1801 S Ocean Dr, Hollywood, FL 33019
$-1,120
Cash flow
-19.5%
Cash-on-Cash Return
1.7%
Cap rate
0.9%
Rent to Value Ratio

Active
$1,150,000
2
bds
|
2
ba
|
1,145
sqft
|
built
2017
4111 S Ocean Dr, Hollywood, FL 33019
$-4,266
Cash flow
-19.4%
Cash-on-Cash Return
1.7%
Cap rate
0.6%
Rent to Value Ratio

Active
$744,000
4
bds
|
3
ba
|
1,573
sqft
|
built
1966
906 N 13th Ave, Hollywood, FL 33019
$-1,802
Cash flow
-12.6%
Cash-on-Cash Return
3.2%
Cap rate
0.6%
Rent to Value Ratio
Active
$700,000
3
bds
|
3
ba
|
1,990
sqft
|
built
1982
1201 S Ocean Dr, Hollywood, FL 33019
$-3,341
Cash flow
-24.9%
Cash-on-Cash Return
0.4%
Cap rate
0.7%
Rent to Value Ratio

Active
$769,000
3
bds
|
3
ba
|
1,919
sqft
|
built
1996
1140 Linden St, Hollywood, FL 33019
$-1,660
Cash flow
-11.3%
Cash-on-Cash Return
3.6%
Cap rate
0.7%
Rent to Value Ratio

Active
$900,000
2
bds
|
2
ba
|
1,075
sqft
|
built
2019
4010 S Ocean Dr, Hollywood, FL 33019
$-3,979
Cash flow
-23.1%
Cash-on-Cash Return
0.8%
Cap rate
0.6%
Rent to Value Ratio

Active
$1,099,000
3
bds
|
3
ba
|
1,985
sqft
|
built
1951
742 Harrison St, Hollywood, FL 33019
$-2,335
Cash flow
-11.1%
Cash-on-Cash Return
3.6%
Cap rate
0.6%
Rent to Value Ratio

Active
$1,100,000
2
bds
|
2
ba
|
1,768
sqft
|
built
1973
2751 S Ocean Dr, Hollywood, FL 33019
$-3,687
Cash flow
-17.5%
Cash-on-Cash Return
2.1%
Cap rate
0.6%
Rent to Value Ratio

Active
$550,000
1
bds
|
2
ba
|
1,070
sqft
|
built
1969
3801 S Ocean Dr, Hollywood, FL 33019
$-2,398
Cash flow
-22.7%
Cash-on-Cash Return
0.9%
Cap rate
0.7%
Rent to Value Ratio

Active
$499,900
1
bds
|
1
ba
|
874
sqft
|
built
1969
3901 S Ocean Dr, Hollywood, FL 33019
$-1,943
Cash flow
-20.3%
Cash-on-Cash Return
1.5%
Cap rate
0.6%
Rent to Value Ratio

Active
$780,000
2
bds
|
2
ba
|
2,100
sqft
|
built
1952
1107 Adams St, Hollywood, FL 33019
$-1,690
Cash flow
-11.3%
Cash-on-Cash Return
3.5%
Cap rate
0.7%
Rent to Value Ratio

Active
$1,800,000
6
bds
|
4
ba
|
3,352
sqft
|
built
1956
1240 Jefferson St, Hollywood, FL 33019
$-3,527
Cash flow
-10.2%
Cash-on-Cash Return
3.8%
Cap rate
0.6%
Rent to Value Ratio

Active
$439,000
2
bds
|
2
ba
|
1,070
sqft
|
built
1968
320 S Surf Rd, Hollywood, FL 33019
$-1,622
Cash flow
-19.3%
Cash-on-Cash Return
1.7%
Cap rate
0.7%
Rent to Value Ratio

Active
$799,000
4
bds
|
3
ba
|
2,022
sqft
|
built
1995
1470 Sweetbay Way, Hollywood, FL 33019
$-1,665
Cash flow
-10.9%
Cash-on-Cash Return
3.6%
Cap rate
0.7%
Rent to Value Ratio

Active
$1,099,000
3
bds
|
2
ba
|
1,921
sqft
|
built
1957
952 Hollywood Blvd, Hollywood, FL 33019
$-2,318
Cash flow
-11.0%
Cash-on-Cash Return
3.6%
Cap rate
0.6%
Rent to Value Ratio
Active
$1,289,000
4
bds
|
4
ba
|
2,999
sqft
|
built
1951
1022 Jefferson St, Hollywood, FL 33019
$-2,864
Cash flow
-11.6%
Cash-on-Cash Return
3.5%
Cap rate
0.5%
Rent to Value Ratio

Active
$499,900
2
bds
|
2
ba
|
1,176
sqft
|
built
1969
3901 S Ocean Dr, Hollywood, FL 33019
$-2,214
Cash flow
-23.1%
Cash-on-Cash Return
0.8%
Cap rate
0.7%
Rent to Value Ratio

Active
$799,000
2
bds
|
2
ba
|
1,360
sqft
|
built
1973
2751 S Ocean Dr, Hollywood, FL 33019
$-1,890
Cash flow
-12.3%
Cash-on-Cash Return
3.3%
Cap rate
0.5%
Rent to Value Ratio

Active
$280,000
1
bds
|
1
ba
|
487
sqft
|
built
1968
2501 S Ocean Dr, Hollywood, FL 33019
$-1,050
Cash flow
-19.6%
Cash-on-Cash Return
1.6%
Cap rate
0.7%
Rent to Value Ratio

Active
$980,000
2
bds
|
2
ba
|
1,075
sqft
|
built
2019
4010 S Ocean Dr, Hollywood, FL 33019
$-4,481
Cash flow
-23.9%
Cash-on-Cash Return
0.7%
Cap rate
0.6%
Rent to Value Ratio

Active
$590,000
2
bds
|
2
ba
|
1,100
sqft
|
built
1973
2101 S Ocean Dr, Hollywood, FL 33019
$-1,356
Cash flow
-12.0%
Cash-on-Cash Return
3.4%
Cap rate
0.9%
Rent to Value Ratio
Active
$249,000
1
bds
|
1
ba
|
590
sqft
|
built
1968
2501 S Ocean Dr, Hollywood, FL 33019
$-1,126
Cash flow
-23.6%
Cash-on-Cash Return
0.7%
Cap rate
0.8%
Rent to Value Ratio

Active
$1,150,000
2
bds
|
2
ba
|
1,044
sqft
|
built
2019
4010 S Ocean Dr, Hollywood, FL 33019
$-4,197
Cash flow
-19.0%
Cash-on-Cash Return
1.8%
Cap rate
0.6%
Rent to Value Ratio

Active
$1,075,000
2
bds
|
2
ba
|
1,145
sqft
|
built
2017
4111 S Ocean Dr, Hollywood, FL 33019
$-3,602
Cash flow
-17.5%
Cash-on-Cash Return
2.1%
Cap rate
0.7%
Rent to Value Ratio
Active
$1,499,000
3
bds
|
3
ba
|
2,233
sqft
|
built
1999
6051 N Ocean Dr, Hollywood, FL 33019
$-6,935
Cash flow
-24.1%
Cash-on-Cash Return
0.6%
Cap rate
0.5%
Rent to Value Ratio

Active
$399,000
1
bds
|
1
ba
|
646
sqft
|
built
2017
777 N Ocean Dr, Hollywood, FL 33019
$-1,846
Cash flow
-24.1%
Cash-on-Cash Return
0.6%
Cap rate
0.7%
Rent to Value Ratio

Active
$390,000
2
bds
|
2
ba
|
1,350
sqft
|
built
1973
2101 S Ocean Dr, Hollywood, FL 33019
$-1,357
Cash flow
-18.2%
Cash-on-Cash Return
2.0%
Cap rate
0.8%
Rent to Value Ratio

Active
$430,000
1
bds
|
1
ba
|
789
sqft
|
built
1969
3801 S Ocean Dr, Hollywood, FL 33019
$-1,529
Cash flow
-18.6%
Cash-on-Cash Return
1.9%
Cap rate
0.7%
Rent to Value Ratio

Active
$744,900
2
bds
|
2
ba
|
1,575
sqft
|
built
1951
1359 Washington St, Hollywood, FL 33019
$-1,774
Cash flow
-12.4%
Cash-on-Cash Return
3.3%
Cap rate
0.6%
Rent to Value Ratio
Active
$5,290,000
5
bds
|
4
ba
|
3,125
sqft
|
built
1959
1100 N Northlake Dr, Hollywood, FL 33019
$-24,737
Cash flow
-24.4%
Cash-on-Cash Return
0.5%
Cap rate
0.1%
Rent to Value Ratio

Active
$1,395,000
4
bds
|
3
ba
|
1,432
sqft
|
built
1937
1108 Harrison St, Hollywood, FL 33019
$-6,287
Cash flow
-23.5%
Cash-on-Cash Return
0.7%
Cap rate
0.2%
Rent to Value Ratio