33019 Investment Properties for Sale
Browse homes for sale and investment properties in 33019. Refine your search by price, property type, or more.
Best cash flowing properties in 33019

Active
$290,000
1
bds
|
2
ba
|
874
sqft
|
built
1970
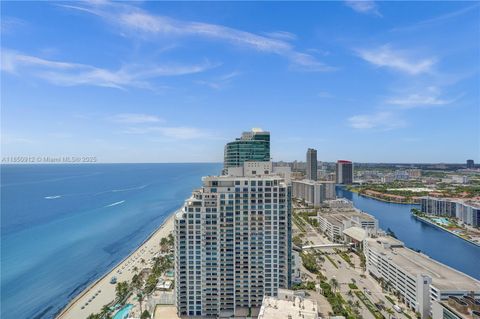
1410 S Ocean Dr, Hollywood, FL 33019
$-501
Cash flow
-9.0%
Cash-on-Cash Return
4.1%
Cap rate
0.9%
Rent to Value Ratio
Active
$449,000
2
bds
|
2
ba
|
1,242
sqft
|
built
1970
1401 S Ocean Dr, Hollywood, FL 33019
$-604
Cash flow
-7.0%
Cash-on-Cash Return
4.5%
Cap rate
0.8%
Rent to Value Ratio
426 out of 532 properties for sale in 33019
Limited Results Shown
Create a free account, or log in to reveal all property listings and enjoy the complete experience.

Active
$1,195,000
4
bds
|
3
ba
|
2,152
sqft
|
built
1958
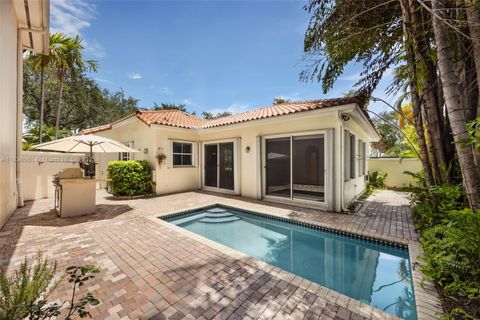
1255 Hollywood Blvd, Hollywood, FL 33019
$-3,278
Cash flow
-14.3%
Cash-on-Cash Return
2.9%
Cap rate
0.5%
Rent to Value Ratio
Active
$319,997
1
bds
|
2
ba
|
1,016
sqft
|
built
1970
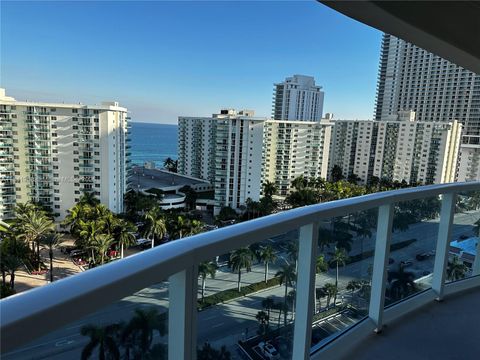
3000 S Ocean Dr, Hollywood, FL 33019
$-1,770
Cash flow
-28.9%
Cash-on-Cash Return
-0.5%
Cap rate
0.8%
Rent to Value Ratio

Active
$357,500
1
bds
|
2
ba
|
900
sqft
|
built
1973
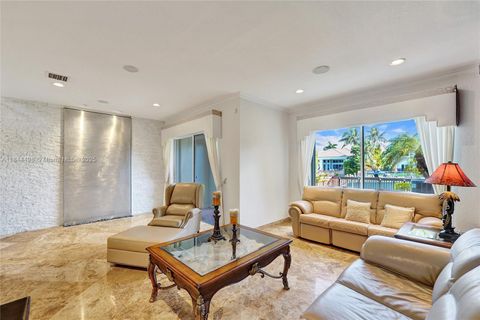
3800 S Ocean Dr, Hollywood, FL 33019
$-1,487
Cash flow
-21.7%
Cash-on-Cash Return
1.2%
Cap rate
0.7%
Rent to Value Ratio
Active
$475,000
1
bds
|
2
ba
|
812
sqft
|
built
1967
3111 N Ocean Dr, Hollywood, FL 33019
$-702
Cash flow
-7.7%
Cash-on-Cash Return
4.4%
Cap rate
0.7%
Rent to Value Ratio

Active
$1,250,000
3
bds
|
3
ba
|
2,067
sqft
|
built
1976
919 N Northlake Dr, Hollywood, FL 33019
$-2,837
Cash flow
-11.8%
Cash-on-Cash Return
3.4%
Cap rate
0.6%
Rent to Value Ratio

Active
$385,000
1
bds
|
2
ba
|
875
sqft
|
built
1971
3725 S Ocean Dr, Hollywood, FL 33019
$-1,021
Cash flow
-13.8%
Cash-on-Cash Return
3.0%
Cap rate
0.9%
Rent to Value Ratio

Active
$599,900
2
bds
|
2
ba
|
1,198
sqft
|
built
1968
2501 S Ocean Dr, Hollywood, FL 33019
$-3,045
Cash flow
-26.5%
Cash-on-Cash Return
0.1%
Cap rate
0.6%
Rent to Value Ratio

Active
$485,000
2
bds
|
2
ba
|
1,334
sqft
|
built
1973
3800 S Ocean Dr, Hollywood, FL 33019
$-1,254
Cash flow
-13.5%
Cash-on-Cash Return
3.0%
Cap rate
0.8%
Rent to Value Ratio

Active
$795,000
2
bds
|
2
ba
|
1,570
sqft
|
built
1982
1201 S Ocean Dr, Hollywood, FL 33019
$-3,531
Cash flow
-23.2%
Cash-on-Cash Return
0.8%
Cap rate
0.6%
Rent to Value Ratio
Active
$209,000
0
bds
|
1
ba
|
262
sqft
|
built
1956
322 Harding St, Hollywood, FL 33019
$-632
Cash flow
-15.8%
Cash-on-Cash Return
2.5%
Cap rate
1.1%
Rent to Value Ratio

Active
$1,195,000
3
bds
|
2
ba
|
1,632
sqft
|
built
1955
800 Polk St, Hollywood, FL 33019
$-3,030
Cash flow
-13.2%
Cash-on-Cash Return
3.1%
Cap rate
0.4%
Rent to Value Ratio

Active
$2,300,000
3
bds
|
3
ba
|
2,385
sqft
|
built
2016
2101 S Surf Rd, Hollywood, FL 33019
$-9,949
Cash flow
-22.6%
Cash-on-Cash Return
1.0%
Cap rate
0.4%
Rent to Value Ratio

Active
$375,000
2
bds
|
2
ba
|
963
sqft
|
built
1970
3000 S Ocean Dr, Hollywood, FL 33019
$-1,894
Cash flow
-26.4%
Cash-on-Cash Return
0.1%
Cap rate
0.7%
Rent to Value Ratio

Active
$510,000
2
bds
|
2
ba
|
1,287
sqft
|
built
1973
1500 S Ocean Dr, Hollywood, FL 33019
$-2,217
Cash flow
-22.7%
Cash-on-Cash Return
0.9%
Cap rate
0.7%
Rent to Value Ratio
Active
$1,739,000
3
bds
|
4
ba
|
2,115
sqft
|
built
2005
3101 S Ocean Dr, Hollywood, FL 33019
$-7,604
Cash flow
-22.8%
Cash-on-Cash Return
0.9%
Cap rate
0.5%
Rent to Value Ratio

Active
$250,000
1
bds
|
1
ba
|
750
sqft
|
built
1965
2600 S Ocean Dr, Hollywood, FL 33019
$-933
Cash flow
-19.5%
Cash-on-Cash Return
1.7%
Cap rate
0.8%
Rent to Value Ratio

Active
$529,000
1
bds
|
2
ba
|
1,113
sqft
|
built
1966
3001 S Ocean Dr, Hollywood, FL 33019
$-2,475
Cash flow
-24.4%
Cash-on-Cash Return
0.5%
Cap rate
0.6%
Rent to Value Ratio

Active
$439,000
2
bds
|
2
ba
|
1,050
sqft
|
built
1974
2201 S Ocean Dr, Hollywood, FL 33019
$-1,496
Cash flow
-17.8%
Cash-on-Cash Return
2.1%
Cap rate
0.8%
Rent to Value Ratio

Active
$2,150,000
5
bds
|
3
ba
|
2,020
sqft
|
built
2004
1223 Jackson St, Hollywood, FL 33019
$-5,647
Cash flow
-13.7%
Cash-on-Cash Return
3.0%
Cap rate
0.5%
Rent to Value Ratio

Active
$3,999,995
6
bds
|
6
ba
|
4,479
sqft
|
built
2001
1031 Harbor Ct, Hollywood, FL 33019
$-17,845
Cash flow
-23.3%
Cash-on-Cash Return
0.8%
Cap rate
0.3%
Rent to Value Ratio

Active
$310,000
1
bds
|
1
ba
|
960
sqft
|
built
1968
1701 S Ocean Dr, Hollywood, FL 33019
$-1,294
Cash flow
-21.8%
Cash-on-Cash Return
1.1%
Cap rate
0.8%
Rent to Value Ratio

Active
$560,000
1
bds
|
2
ba
|
820
sqft
|
built
1970
400 N Surf Rd, Hollywood, FL 33019
$-2,322
Cash flow
-21.6%
Cash-on-Cash Return
1.2%
Cap rate
0.6%
Rent to Value Ratio

Active
$450,000
1
bds
|
1
ba
|
874
sqft
|
built
1969
3801 S Ocean Dr, Hollywood, FL 33019
$-2,269
Cash flow
-26.3%
Cash-on-Cash Return
0.1%
Cap rate
0.5%
Rent to Value Ratio

Active
$460,000
1
bds
|
2
ba
|
905
sqft
|
built
1969
4001 S Ocean Dr, Hollywood, FL 33019
$-2,084
Cash flow
-23.6%
Cash-on-Cash Return
0.7%
Cap rate
0.7%
Rent to Value Ratio

Active
$460,000
1
bds
|
1
ba
|
745
sqft
|
built
1968
2501 S Ocean Dr, Hollywood, FL 33019
$-1,658
Cash flow
-18.8%
Cash-on-Cash Return
1.8%
Cap rate
0.7%
Rent to Value Ratio

Active
$389,000
2
bds
|
2
ba
|
1,270
sqft
|
built
1973
3800 S Ocean Dr, Hollywood, FL 33019
$-1,970
Cash flow
-26.4%
Cash-on-Cash Return
0.1%
Cap rate
0.7%
Rent to Value Ratio

Active
$1,850,000
4
bds
|
3
ba
|
2,464
sqft
|
built
1969
1245 Coral Ln, Hollywood, FL 33019
$-7,021
Cash flow
-19.8%
Cash-on-Cash Return
1.6%
Cap rate
0.3%
Rent to Value Ratio

Active
$374,000
2
bds
|
2
ba
|
1,218
sqft
|
built
1971
1600 S Ocean Dr, Hollywood, FL 33019
$-1,816
Cash flow
-25.3%
Cash-on-Cash Return
0.3%
Cap rate
0.8%
Rent to Value Ratio

Active
$449,000
1
bds
|
1
ba
|
874
sqft
|
built
1969
3801 S Ocean Dr, Hollywood, FL 33019
$-1,894
Cash flow
-22.0%
Cash-on-Cash Return
1.1%
Cap rate
0.7%
Rent to Value Ratio

Active
$510,000
2
bds
|
2
ba
|
1,358
sqft
|
built
1969
4001 S Ocean Dr, Hollywood, FL 33019
$-2,567
Cash flow
-26.3%
Cash-on-Cash Return
0.1%
Cap rate
0.8%
Rent to Value Ratio

Active
$555,000
2
bds
|
2
ba
|
1,346
sqft
|
built
1969
4001 S Ocean Dr, Hollywood, FL 33019
$-2,079
Cash flow
-19.5%
Cash-on-Cash Return
1.7%
Cap rate
0.8%
Rent to Value Ratio

Active
$390,000
1
bds
|
1
ba
|
812
sqft
|
built
1969
3901 S Ocean Dr, Hollywood, FL 33019
$-1,572
Cash flow
-21.0%
Cash-on-Cash Return
1.3%
Cap rate
0.7%
Rent to Value Ratio

Active
$225,000
0
bds
|
1
ba
|
600
sqft
|
built
1966
1901 S Ocean Dr, Hollywood, FL 33019
$-814
Cash flow
-18.9%
Cash-on-Cash Return
1.8%
Cap rate
1.0%
Rent to Value Ratio
Active
$875,000
3
bds
|
2
ba
|
1,561
sqft
|
built
1998
1571 Breakwater Ter, Hollywood, FL 33019
$-3,113
Cash flow
-18.6%
Cash-on-Cash Return
1.9%
Cap rate
0.6%
Rent to Value Ratio
Active
$419,000
2
bds
|
2
ba
|
1,270
sqft
|
built
1973
3800 S Ocean Dr, Hollywood, FL 33019
$-2,021
Cash flow
-25.2%
Cash-on-Cash Return
0.4%
Cap rate
0.7%
Rent to Value Ratio
Active
$1,299,000
3
bds
|
3
ba
|
2,204
sqft
|
built
2000
1375 Harbor Vw E, Hollywood, FL 33019
$-3,390
Cash flow
-13.6%
Cash-on-Cash Return
3.0%
Cap rate
0.7%
Rent to Value Ratio

Active
$730,000
3
bds
|
2
ba
|
1,150
sqft
|
built
1957
922 N 13th Ter, Hollywood, FL 33019
$-2,103
Cash flow
-15.0%
Cash-on-Cash Return
2.7%
Cap rate
0.5%
Rent to Value Ratio

Active
$445,000
2
bds
|
2
ba
|
1,212
sqft
|
built
1970
3000 S Ocean Dr, Hollywood, FL 33019
$-2,074
Cash flow
-24.3%
Cash-on-Cash Return
0.6%
Cap rate
0.7%
Rent to Value Ratio