33027 Investment Properties for Sale
Browse homes for sale and investment properties in 33027. Refine your search by price, property type, or more.
Best cash flowing properties in 33027

Active
$122,000
1
bds
|
2
ba
|
811
sqft
|
built
1984
150 SW 134th Way, Pembroke Pines, FL 33027
$-211
Cash flow
-9.0%
Cash-on-Cash Return
4.1%
Cap rate
1.3%
Rent to Value Ratio
Active
$164,500
1
bds
|
2
ba
|
811
sqft
|
built
1985
13350 SW 1st St, Pembroke Pines, FL 33027
$-321
Cash flow
-10.2%
Cash-on-Cash Return
3.8%
Cap rate
1.0%
Rent to Value Ratio
32 out of 34 properties for sale in 33027
Limited Results Shown
Create a free account, or log in to reveal all property listings and enjoy the complete experience.

Active
$434,000
3
bds
|
3
ba
|
1,776
sqft
|
built
2005
13227 SW 42nd St, Miramar, FL 33027
$-3,697
Cash flow
-44.4%
Cash-on-Cash Return
-4.1%
Cap rate
0.7%
Rent to Value Ratio

Pending
$445,000
3
bds
|
3
ba
|
1,747
sqft
|
built
2011
803 SW 143rd Ave, Pembroke Pines, FL 33027
$-1,252
Cash flow
-14.7%
Cash-on-Cash Return
2.8%
Cap rate
0.7%
Rent to Value Ratio
Active
$122,000
1
bds
|
2
ba
|
811
sqft
|
built
1984
150 SW 134th Way, Pembroke Pines, FL 33027
$-211
Cash flow
-9.0%
Cash-on-Cash Return
4.1%
Cap rate
1.3%
Rent to Value Ratio
Active
$199,000
1
bds
|
2
ba
|
702
sqft
|
built
1985
1401 SW 134th Way, Pembroke Pines, FL 33027
$-450
Cash flow
-11.8%
Cash-on-Cash Return
3.4%
Cap rate
1.0%
Rent to Value Ratio

Active under contract
$275,000
1
bds
|
1
ba
|
775
sqft
|
built
2004
4404 SW 160th Ave, Miramar, FL 33027
$-810
Cash flow
-15.4%
Cash-on-Cash Return
2.6%
Cap rate
0.7%
Rent to Value Ratio

Active
$275,000
1
bds
|
1
ba
|
775
sqft
|
built
2003
4400 SW 160th Ave, Miramar, FL 33027
$-555
Cash flow
-10.5%
Cash-on-Cash Return
3.7%
Cap rate
0.8%
Rent to Value Ratio

Active
$345,000
2
bds
|
3
ba
|
1,067
sqft
|
built
2006
4913 SW 141st Ave, Miramar, FL 33027
$-1,171
Cash flow
-17.7%
Cash-on-Cash Return
2.1%
Cap rate
0.7%
Rent to Value Ratio

Active
$324,999
2
bds
|
2
ba
|
890
sqft
|
built
2004
4506 SW 160th Ave, Miramar, FL 33027
$-892
Cash flow
-14.3%
Cash-on-Cash Return
2.9%
Cap rate
0.8%
Rent to Value Ratio
Active
$435,000
3
bds
|
3
ba
|
1,396
sqft
|
built
2007
1035 SW 144th Ave, Pembroke Pines, FL 33027
$-1,409
Cash flow
-16.9%
Cash-on-Cash Return
2.3%
Cap rate
0.6%
Rent to Value Ratio

Active
$415,000
3
bds
|
3
ba
|
1,481
sqft
|
built
2007
12430 SW 50th St, Miramar, FL 33027
$-1,281
Cash flow
-16.1%
Cash-on-Cash Return
2.4%
Cap rate
0.7%
Rent to Value Ratio

Active under contract
$357,000
2
bds
|
2
ba
|
1,105
sqft
|
built
1990
501 SW 158th Ter, Pembroke Pines, FL 33027
$-1,325
Cash flow
-19.4%
Cash-on-Cash Return
1.7%
Cap rate
0.7%
Rent to Value Ratio
Active
$338,900
2
bds
|
2
ba
|
1,115
sqft
|
built
1990
502 SW 158th Ter, Pembroke Pines, FL 33027
$-1,122
Cash flow
-17.3%
Cash-on-Cash Return
2.2%
Cap rate
0.7%
Rent to Value Ratio

Active
$354,000
2
bds
|
2
ba
|
1,158
sqft
|
built
1991
401 SW 158th Ter, Pembroke Pines, FL 33027
$-1,262
Cash flow
-18.6%
Cash-on-Cash Return
1.9%
Cap rate
0.7%
Rent to Value Ratio
Active
$169,900
2
bds
|
2
ba
|
819
sqft
|
built
1985
1401 SW 134th Way, Pembroke Pines, FL 33027
$-358
Cash flow
-11.0%
Cash-on-Cash Return
3.6%
Cap rate
1.1%
Rent to Value Ratio

Active
$418,000
3
bds
|
2
ba
|
1,239
sqft
|
built
1994
15865 SW 6th Pl, Pembroke Pines, FL 33027
$-1,367
Cash flow
-17.1%
Cash-on-Cash Return
2.2%
Cap rate
0.7%
Rent to Value Ratio
Active
$365,000
2
bds
|
2
ba
|
1,040
sqft
|
built
2007
433 SW 147th Ave, Pembroke Pines, FL 33027
$-1,268
Cash flow
-18.1%
Cash-on-Cash Return
2.0%
Cap rate
0.7%
Rent to Value Ratio

Active
$398,900
3
bds
|
2
ba
|
1,340
sqft
|
built
2002
4331 SW 160th Ave, Miramar, FL 33027
$-1,042
Cash flow
-13.6%
Cash-on-Cash Return
3.0%
Cap rate
0.7%
Rent to Value Ratio

Active
$240,000
2
bds
|
2
ba
|
1,192
sqft
|
built
1987
1501 SW 134th Way, Pembroke Pines, FL 33027
$-512
Cash flow
-11.1%
Cash-on-Cash Return
3.6%
Cap rate
0.9%
Rent to Value Ratio

Active
$489,999
3
bds
|
4
ba
|
1,817
sqft
|
built
2015
946 SW 147th Ave, Pembroke Pines, FL 33027
$-1,780
Cash flow
-19.0%
Cash-on-Cash Return
1.8%
Cap rate
0.6%
Rent to Value Ratio
Active under contract
$365,000
3
bds
|
2
ba
|
1,318
sqft
|
built
2007
441 SW 147th Ave, Pembroke Pines, FL 33027
$-1,098
Cash flow
-15.7%
Cash-on-Cash Return
2.5%
Cap rate
0.8%
Rent to Value Ratio
Active
$415,000
3
bds
|
3
ba
|
1,491
sqft
|
built
2002
4435 SW 160th Ave, Miramar, FL 33027
$-1,204
Cash flow
-15.1%
Cash-on-Cash Return
2.7%
Cap rate
0.7%
Rent to Value Ratio
Active
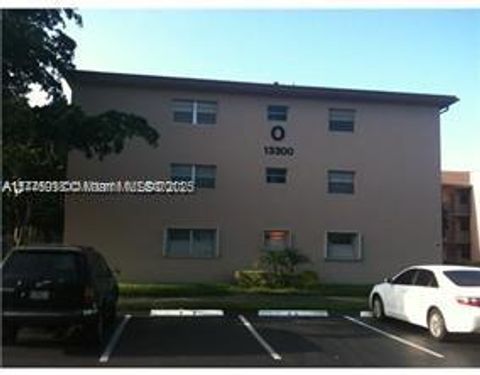
$145,000
1
bds
|
2
ba
|
811
sqft
|
built
1985
13300 SW 1st St, Pembroke Pines, FL 33027
$-518
Cash flow
-18.6%
Cash-on-Cash Return
1.9%
Cap rate
1.2%
Rent to Value Ratio
Active
$499,900
3
bds
|
4
ba
|
1,782
sqft
|
built
2013
14749 SW 9th St, Pembroke Pines, FL 33027
$-1,748
Cash flow
-18.2%
Cash-on-Cash Return
2.0%
Cap rate
0.6%
Rent to Value Ratio
Active
$450,000
3
bds
|
3
ba
|
1,662
sqft
|
built
2013
827 SW 147th Ave, Pembroke Pines, FL 33027
$-1,202
Cash flow
-13.9%
Cash-on-Cash Return
2.9%
Cap rate
0.7%
Rent to Value Ratio
Active
$429,900
3
bds
|
2
ba
|
1,490
sqft
|
built
1992
301 SW 158th Ter, Pembroke Pines, FL 33027
$-1,230
Cash flow
-14.9%
Cash-on-Cash Return
2.7%
Cap rate
0.7%
Rent to Value Ratio

Active
$165,000
2
bds
|
2
ba
|
954
sqft
|
built
1984
13455 SW 3rd St, Pembroke Pines, FL 33027
$-396
Cash flow
-12.5%
Cash-on-Cash Return
3.3%
Cap rate
1.1%
Rent to Value Ratio
Active
$150,000
1
bds
|
2
ba
|
811
sqft
|
built
1985
801 SW 133rd Ter, Pembroke Pines, FL 33027
$-434
Cash flow
-15.1%
Cash-on-Cash Return
2.7%
Cap rate
1.2%
Rent to Value Ratio

Active
$395,000
3
bds
|
2
ba
|
1,340
sqft
|
built
2002
4351 SW 160th Ave, Miramar, FL 33027
$-729
Cash flow
-9.6%
Cash-on-Cash Return
3.9%
Cap rate
0.8%
Rent to Value Ratio
Active
$355,000
2
bds
|
2
ba
|
1,118
sqft
|
built
2004
4402 SW 160th Ave, Miramar, FL 33027
$-913
Cash flow
-13.4%
Cash-on-Cash Return
3.1%
Cap rate
0.8%
Rent to Value Ratio
Active
$164,500
1
bds
|
2
ba
|
811
sqft
|
built
1985
13350 SW 1st St, Pembroke Pines, FL 33027
$-321
Cash flow
-10.2%
Cash-on-Cash Return
3.8%
Cap rate
1.0%
Rent to Value Ratio

Active
$399,999
2
bds
|
3
ba
|
1,662
sqft
|
built
2015
1017 SW 147th Ave, Pembroke Pines, FL 33027
$-1,064
Cash flow
-13.9%
Cash-on-Cash Return
3.0%
Cap rate
0.8%
Rent to Value Ratio
Active
$485,000
3
bds
|
3
ba
|
1,776
sqft
|
built
2005
4331 SW 131st Ln, Miramar, FL 33027
$-1,105
Cash flow
-11.9%
Cash-on-Cash Return
3.4%
Cap rate
0.7%
Rent to Value Ratio