33064 Investment Properties for Sale
Browse homes for sale and investment properties in 33064. Refine your search by price, property type, or more.
Best cash flowing properties in 33064
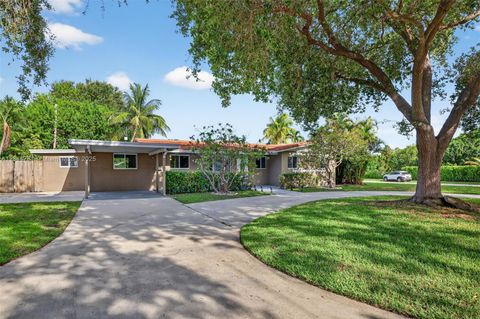
Active
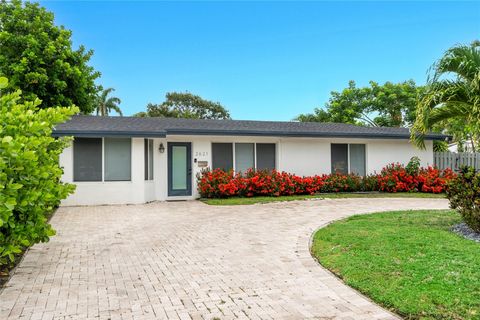
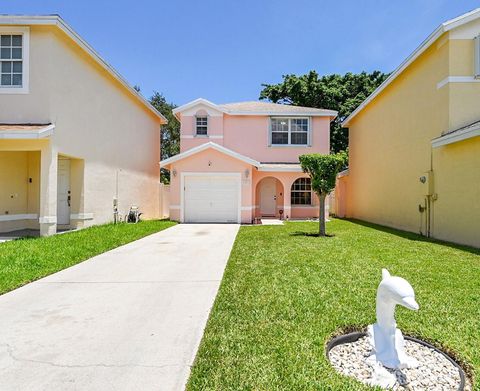
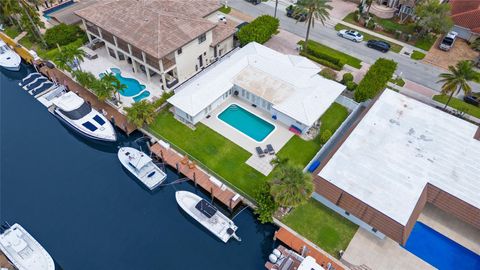
$869,000
3
bds
|
4
ba
|
1,519
sqft
|
built
1956
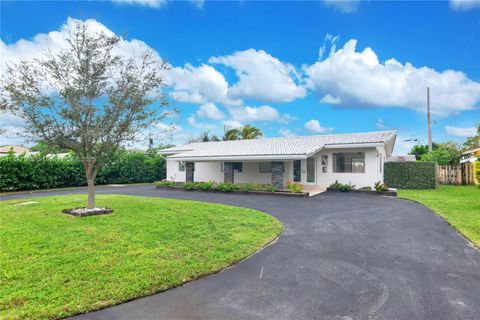
2621 NE 20th Ave, Lighthouse Point, FL 33064
$-110
Cash flow
-0.7%
Cash-on-Cash Return
6.0%
Cap rate
0.9%
Rent to Value Ratio
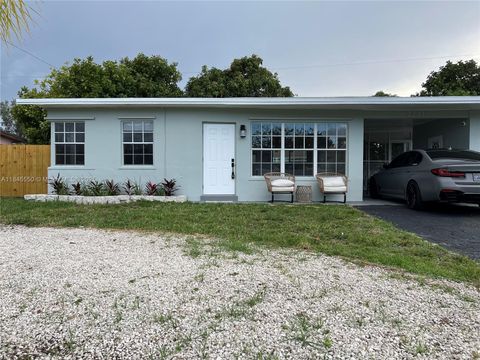
Active
$190,000
2
bds
|
1
ba
|
840
sqft
|
built
1965
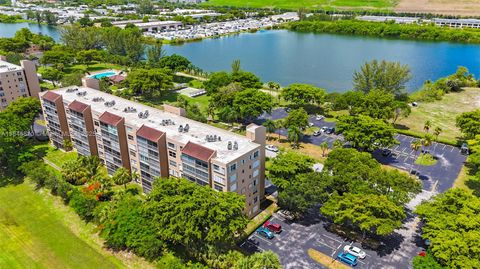
1050 E Sample Rd, Pompano Beach, FL 33064
$-153
Cash flow
-4.2%
Cash-on-Cash Return
5.2%
Cap rate
0.9%
Rent to Value Ratio
249 out of 275 properties for sale in 33064
Limited Results Shown
Create a free account, or log in to reveal all property listings and enjoy the complete experience.
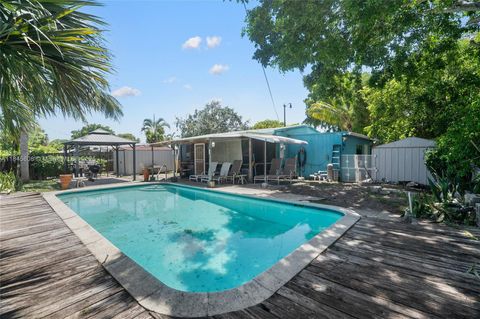
Active
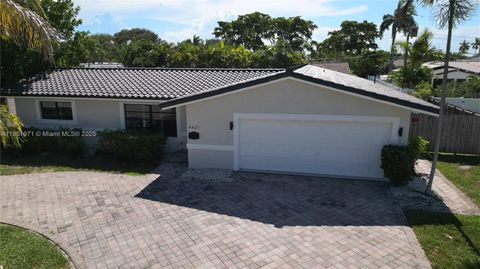
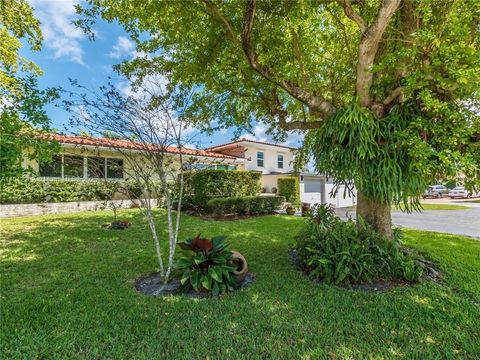
$549,000
3
bds
|
1
ba
|
1,159
sqft
|
built
1961
2950 NE 11th Ave, Pompano Beach, FL 33064
$-1,129
Cash flow
-10.7%
Cash-on-Cash Return
3.7%
Cap rate
0.6%
Rent to Value Ratio
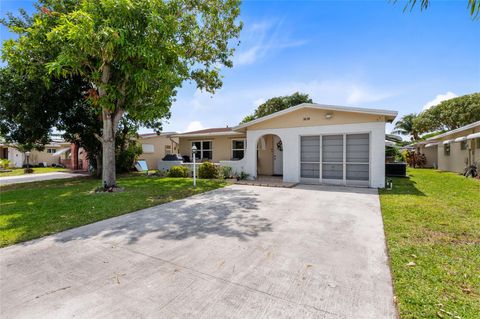
Active
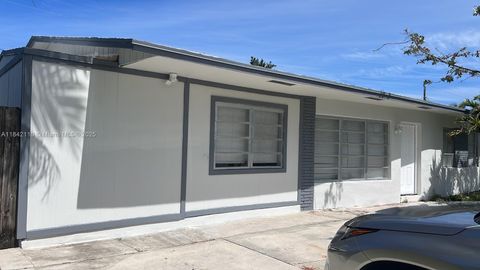
$815,000
4
bds
|
3
ba
|
2,053
sqft
|
built
1966
4431 NE 28th Ave, Lighthouse Point, FL 33064
$-1,905
Cash flow
-12.2%
Cash-on-Cash Return
3.3%
Cap rate
0.6%
Rent to Value Ratio
Active
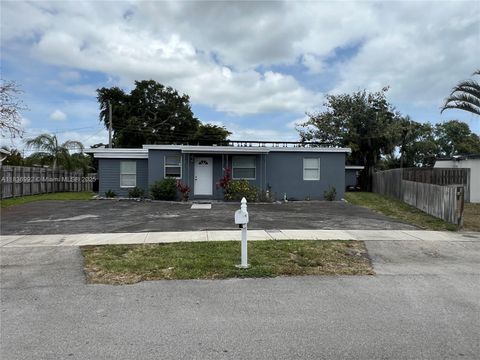
$720,000
3
bds
|
2
ba
|
1,572
sqft
|
built
1957
4911 NE 24th Ave, Lighthouse Point, FL 33064
$-1,347
Cash flow
-9.8%
Cash-on-Cash Return
3.9%
Cap rate
0.5%
Rent to Value Ratio
Active
$528,000
4
bds
|
4
ba
|
1,510
sqft
|
built
1961
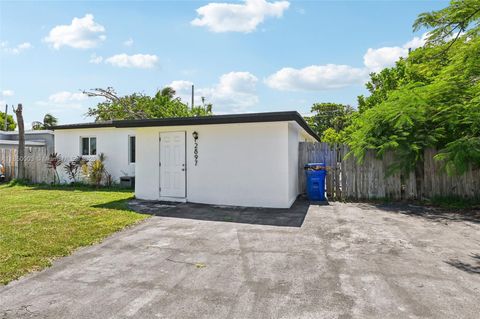
601 NW 38th St, Deerfield Beach, FL 33064
$-1,212
Cash flow
-12.0%
Cash-on-Cash Return
3.4%
Cap rate
0.6%
Rent to Value Ratio
Active
$720,000
3
bds
|
3
ba
|
1,882
sqft
|
built
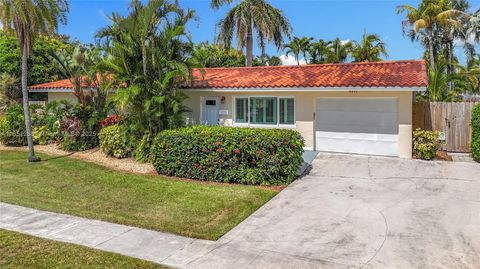
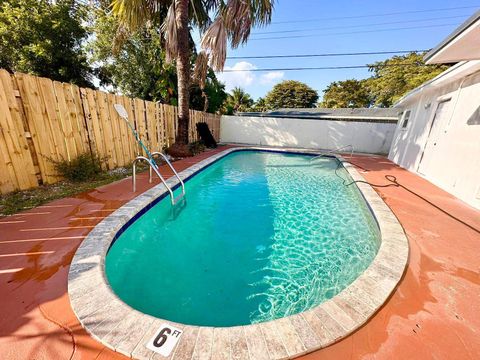
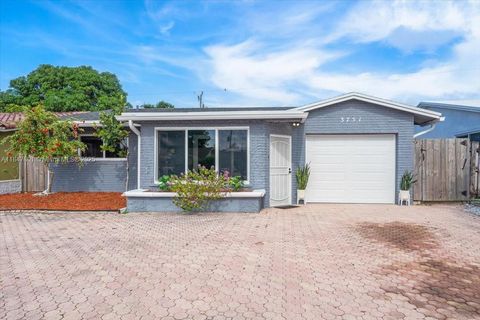
1973
3751 NE 16th Ave, Pompano Beach, FL 33064
$-1,533
Cash flow
-11.1%
Cash-on-Cash Return
3.6%
Cap rate
0.6%
Rent to Value Ratio
Active
$212,500
2
bds
|
2
ba
|
1,070
sqft
|
built
1979
4570 NW 18th Ave, Deerfield Beach, FL 33064
$-764
Cash flow
-18.8%
Cash-on-Cash Return
1.8%
Cap rate
1.0%
Rent to Value Ratio
Active
$430,000
3
bds
|
2
ba
|
1,184
sqft
|
built
1955
2897 NE 12th Ave, Pompano Beach, FL 33064
$-359
Cash flow
-4.4%
Cash-on-Cash Return
5.1%
Cap rate
0.8%
Rent to Value Ratio
Active
$550,000
3
bds
|
3
ba
|
1,830
sqft
|
built
2020
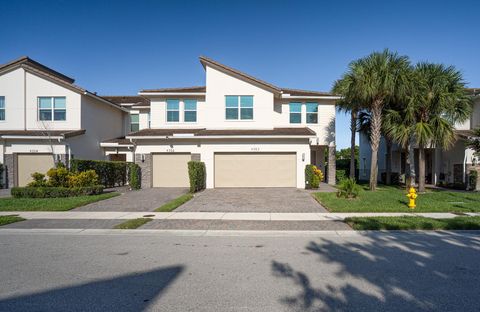
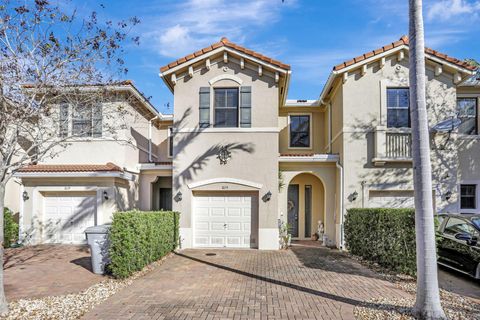
4350 Veleiros Ave, Deerfield Beach, FL 33064
$-1,285
Cash flow
-12.2%
Cash-on-Cash Return
3.3%
Cap rate
0.7%
Rent to Value Ratio
Active
$165,000
2
bds
|
1
ba
|
721
sqft
|
built
1974
651 NW 42nd Ct, Deerfield Beach, FL 33064
$-232
Cash flow
-7.3%
Cash-on-Cash Return
4.5%
Cap rate
1.1%
Rent to Value Ratio
Active
$229,000
2
bds
|
1
ba
|
912
sqft
|
built
1976
3200 NW 5th Ter, Pompano Beach, FL 33064
$-781
Cash flow
-17.8%
Cash-on-Cash Return
2.1%
Cap rate
0.8%
Rent to Value Ratio
Active
$550,000
3
bds
|
2
ba
|
1,442
sqft
|
built
1961
3851 NW 3rd Ter, Deerfield Beach, FL 33064
$-1,123
Cash flow
-10.7%
Cash-on-Cash Return
3.7%
Cap rate
0.5%
Rent to Value Ratio
Active
$1,999,788
4
bds
|
3
ba
|
2,142
sqft
|
built
1957
2810 NE 48th Ct, Lighthouse Point, FL 33064
$-6,707
Cash flow
-17.5%
Cash-on-Cash Return
2.1%
Cap rate
0.3%
Rent to Value Ratio
Active
$260,000
1
bds
|
2
ba
|
900
sqft
|
built
1974
3150 NE 48th Ct, Lighthouse Point, FL 33064
$-1,046
Cash flow
-21.0%
Cash-on-Cash Return
1.3%
Cap rate
0.8%
Rent to Value Ratio
Active
$315,000
2
bds
|
2
ba
|
1,525
sqft
|
built
1975
1760 NW 49th St, Deerfield Beach, FL 33064
$-634
Cash flow
-10.5%
Cash-on-Cash Return
3.7%
Cap rate
0.8%
Rent to Value Ratio
Active
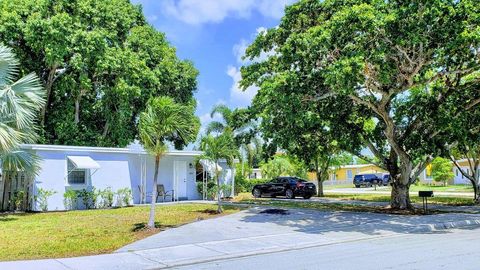
$490,000
3
bds
|
2
ba
|
2,175
sqft
|
built
1959
4031 NE 18th Ave, Pompano Beach, FL 33064
$-227
Cash flow
-2.4%
Cash-on-Cash Return
5.6%
Cap rate
0.9%
Rent to Value Ratio
Active
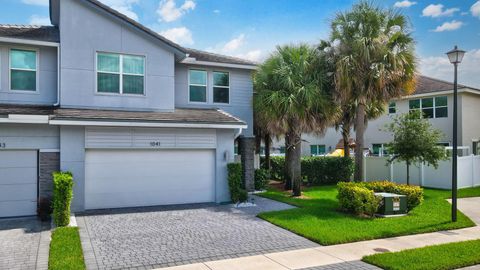
$475,000
3
bds
|
3
ba
|
1,661
sqft
|
built
2017
1035 NW 33rd Mnr, Pompano Beach, FL 33064
$-690
Cash flow
-7.6%
Cash-on-Cash Return
4.4%
Cap rate
0.7%
Rent to Value Ratio
Active
$9,750,000
5
bds
|
8
ba
|
6,818
sqft
|
built
2014
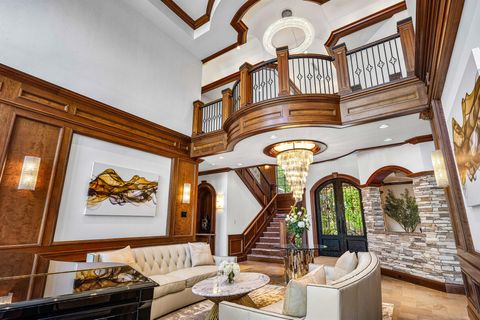
2325 NE 27th St, Lighthouse Point, FL 33064
$-49,396
Cash flow
-26.4%
Cash-on-Cash Return
0.1%
Cap rate
0.1%
Rent to Value Ratio
Active
$199,800
2
bds
|
2
ba
|
1,070
sqft
|
built
1979
4570 NW 18th Ave, Deerfield Beach, FL 33064
$-427
Cash flow
-11.2%
Cash-on-Cash Return
3.6%
Cap rate
1.1%
Rent to Value Ratio
Active
$755,000
3
bds
|
3
ba
|
1,971
sqft
|
built
1959
4000 NE 22nd Ave, Lighthouse Point, FL 33064
$-1,178
Cash flow
-8.1%
Cash-on-Cash Return
4.3%
Cap rate
0.6%
Rent to Value Ratio
Active
$394,000
2
bds
|
1
ba
|
767
sqft
|
built
1960
2731 NE 11th Ter, Pompano Beach, FL 33064
$-1,624
Cash flow
-21.5%
Cash-on-Cash Return
1.2%
Cap rate
0.4%
Rent to Value Ratio
Active
$389,000
2
bds
|
1
ba
|
928
sqft
|
built
1956
3120 NE 13th Ave, Pompano Beach, FL 33064
$-374
Cash flow
-5.0%
Cash-on-Cash Return
5.0%
Cap rate
0.7%
Rent to Value Ratio
Active
$374,995
2
bds
|
2
ba
|
1,240
sqft
|
built
1975
1010 NW 49th Ct, Deerfield Beach, FL 33064
$-484
Cash flow
-6.7%
Cash-on-Cash Return
4.6%
Cap rate
0.7%
Rent to Value Ratio
Active
$475,000
3
bds
|
3
ba
|
1,671
sqft
|
built
1997
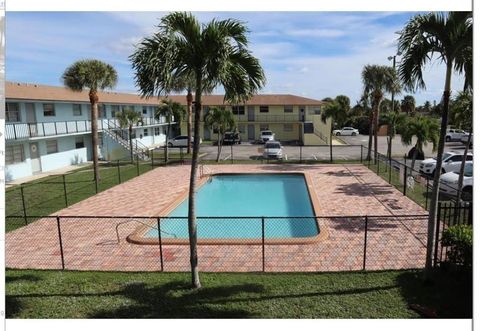
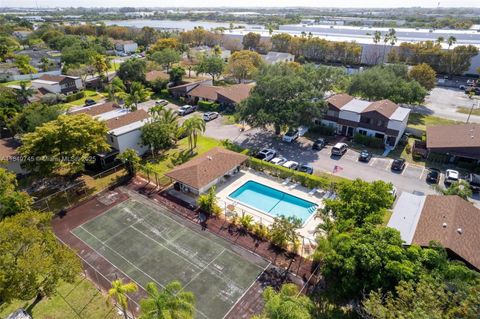
4042 Eastridge Cir, Deerfield Beach, FL 33064
$-552
Cash flow
-6.1%
Cash-on-Cash Return
4.8%
Cap rate
0.7%
Rent to Value Ratio
Active
$1,250,000
4
bds
|
3
ba
|
2,658
sqft
|
built
1955
2616 NE 26th Ave, Lighthouse Point, FL 33064
$-2,934
Cash flow
-12.2%
Cash-on-Cash Return
3.3%
Cap rate
0.5%
Rent to Value Ratio
Active
$395,000
3
bds
|
2
ba
|
0
sqft
|
built
1963
2600 NE 8th Ave, Pompano Beach, FL 33064
$-381
Cash flow
-5.0%
Cash-on-Cash Return
5.0%
Cap rate
0.8%
Rent to Value Ratio
Active
$549,000
7
bds
|
3
ba
|
1,675
sqft
|
built
1955
1885 NE 53rd St, Pompano Beach, FL 33064
$-1,749
Cash flow
-16.6%
Cash-on-Cash Return
2.3%
Cap rate
0.6%
Rent to Value Ratio
Active
$1,995,000
3
bds
|
2
ba
|
2,073
sqft
|
built
1962
2670 NE 47th St, Lighthouse Point, FL 33064
$-6,780
Cash flow
-17.7%
Cash-on-Cash Return
2.1%
Cap rate
0.3%
Rent to Value Ratio
Active
$1,887,000
3
bds
|
3
ba
|
2,049
sqft
|
built
1972
3830 NE 28th Ave, Lighthouse Point, FL 33064
$-5,214
Cash flow
-14.4%
Cash-on-Cash Return
2.8%
Cap rate
0.5%
Rent to Value Ratio
Active
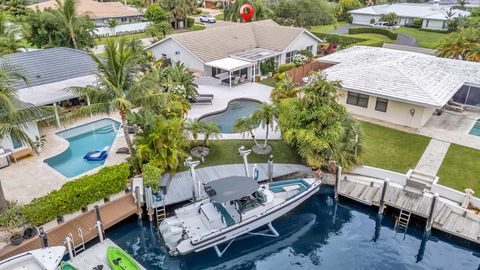
$619,900
3
bds
|
3
ba
|
1,830
sqft
|
built
2020
1041 Rio Ct, Deerfield Beach, FL 33064
$-1,343
Cash flow
-11.3%
Cash-on-Cash Return
3.5%
Cap rate
0.6%
Rent to Value Ratio
Active
$369,000
3
bds
|
2
ba
|
948
sqft
|
built
1956
5275 NE 16th Ave, Pompano Beach, FL 33064
$-570
Cash flow
-8.1%
Cash-on-Cash Return
4.3%
Cap rate
0.7%
Rent to Value Ratio
Active
$409,900
3
bds
|
2
ba
|
893
sqft
|
built
1960
1649 NE 30th Ct, Pompano Beach, FL 33064
$-327
Cash flow
-4.2%
Cash-on-Cash Return
5.2%
Cap rate
0.8%
Rent to Value Ratio
Active
$450,000
3
bds
|
2
ba
|
1,250
sqft
|
built
1961
5219 NE 20th Ter, Pompano Beach, FL 33064
$-777
Cash flow
-9.0%
Cash-on-Cash Return
4.1%
Cap rate
0.7%
Rent to Value Ratio
Active
$178,000
2
bds
|
2
ba
|
950
sqft
|
built
1974
4354 NW 9th Ave, Deerfield Beach, FL 33064
$-293
Cash flow
-8.6%
Cash-on-Cash Return
4.2%
Cap rate
1.1%
Rent to Value Ratio
Active
$314,500
2
bds
|
2
ba
|
812
sqft
|
built
1985
4710 NW 3rd Ter, Deerfield Beach, FL 33064
$-558
Cash flow
-9.3%
Cash-on-Cash Return
4.0%
Cap rate
0.7%
Rent to Value Ratio
Active
$450,000
3
bds
|
2
ba
|
1,000
sqft
|
built
1956
1321 NE 43rd St, Pompano Beach, FL 33064
$-869
Cash flow
-10.1%
Cash-on-Cash Return
3.8%
Cap rate
0.6%
Rent to Value Ratio
Active
$255,900
2
bds
|
2
ba
|
1,054
sqft
|
built
1976
3200 NW 5th Ter, Pompano Beach, FL 33064
$-792
Cash flow
-16.1%
Cash-on-Cash Return
2.4%
Cap rate
0.8%
Rent to Value Ratio
Active
$410,000
3
bds
|
2
ba
|
1,117
sqft
|
built
1955
1571 NE 28th Ct, Pompano Beach, FL 33064
$-704
Cash flow
-9.0%
Cash-on-Cash Return
4.1%
Cap rate
0.7%
Rent to Value Ratio
Active
$433,000
4
bds
|
2
ba
|
1,590
sqft
|
built
1965
4021 NW 7th Ave, Deerfield Beach, FL 33064
$-600
Cash flow
-7.2%
Cash-on-Cash Return
4.5%
Cap rate
0.7%
Rent to Value Ratio