33071 Investment Properties for Sale
Browse homes for sale and investment properties in 33071. Refine your search by price, property type, or more.
Best cash flowing properties in 33071
Active
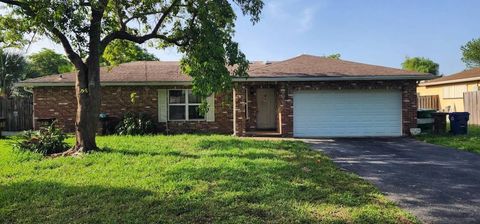
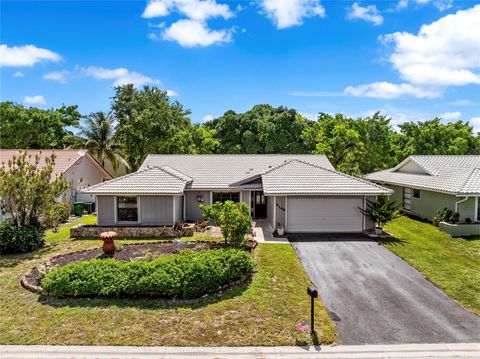
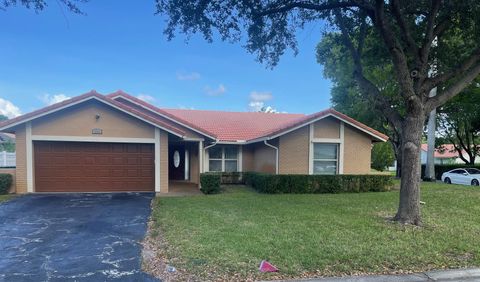
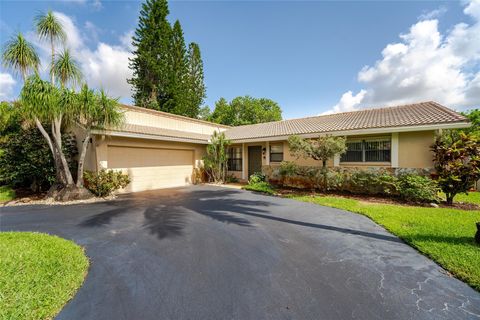
$499,900
4
bds
|
2
ba
|
2,246
sqft
|
built
1982
10925 NW 21st Pl, Coral Springs, FL 33071
$-260
Cash flow
-2.7%
Cash-on-Cash Return
5.5%
Cap rate
0.8%
Rent to Value Ratio
Active
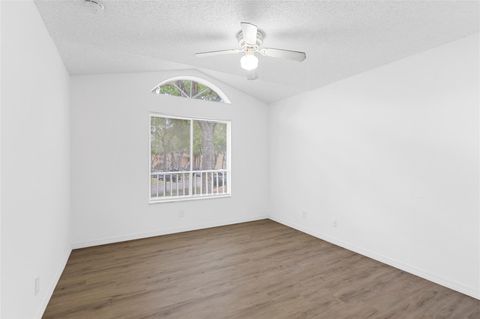
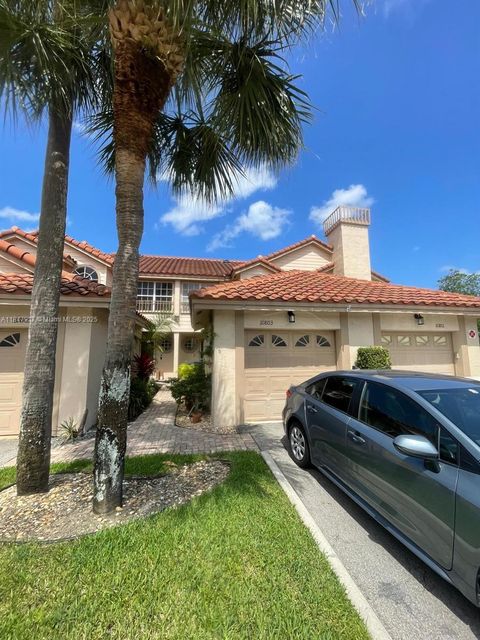
$187,000
1
bds
|
1
ba
|
816
sqft
|
built
1988
1084 Coral Club Dr, Coral Springs, FL 33071
$-430
Cash flow
-12.0%
Cash-on-Cash Return
3.4%
Cap rate
1.0%
Rent to Value Ratio
208 out of 235 properties for sale in 33071
Limited Results Shown
Create a free account, or log in to reveal all property listings and enjoy the complete experience.
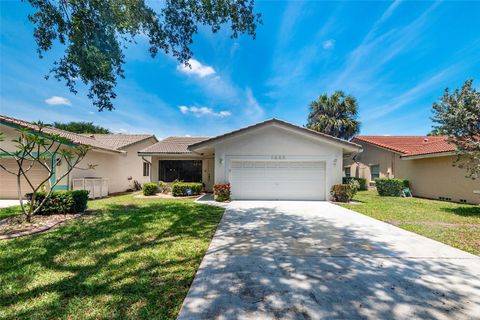
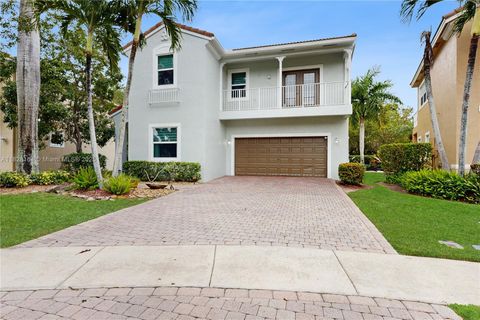
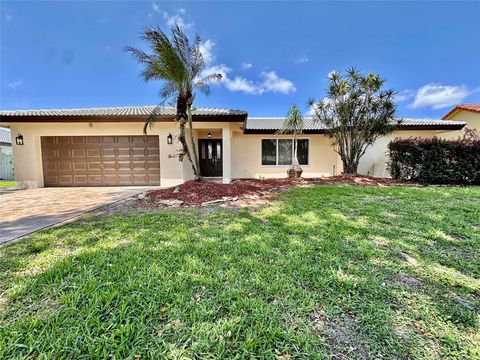
Active
$599,995
4
bds
|
2
ba
|
1,992
sqft
|
built
1989
1422 NW 97th Ave, Coral Springs, FL 33071
$-1,462
Cash flow
-12.7%
Cash-on-Cash Return
3.3%
Cap rate
0.5%
Rent to Value Ratio
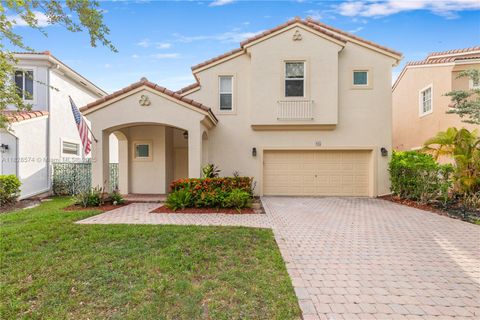
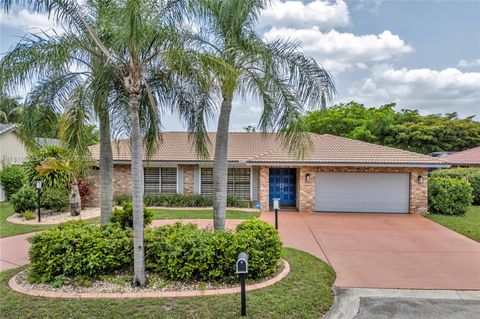
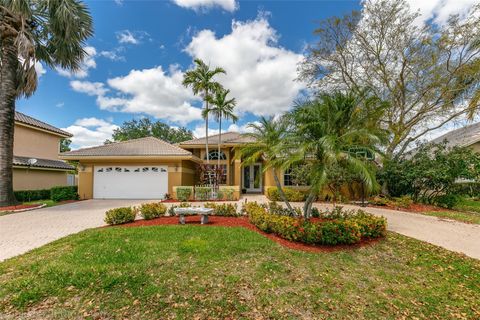
Active
$579,900
3
bds
|
3
ba
|
1,846
sqft
|
built
2001
934 NW 126th Ave, Coral Springs, FL 33071
$-1,546
Cash flow
-13.9%
Cash-on-Cash Return
2.9%
Cap rate
0.6%
Rent to Value Ratio
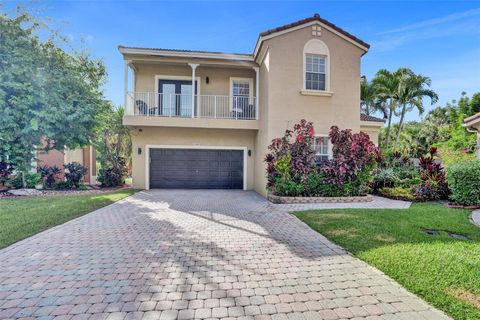
Active
$499,900
3
bds
|
2
ba
|
1,819
sqft
|
built
1978
2149 NW 85th Ln, Coral Springs, FL 33071
$-447
Cash flow
-4.7%
Cash-on-Cash Return
5.1%
Cap rate
0.7%
Rent to Value Ratio
Active
$690,000
4
bds
|
3
ba
|
2,512
sqft
|
built
2001
705 NW 126th Ave, Coral Springs, FL 33071
$-921
Cash flow
-7.0%
Cash-on-Cash Return
4.5%
Cap rate
0.7%
Rent to Value Ratio
Active
$865,000
6
bds
|
3
ba
|
2,984
sqft
|
built
1983
10753 NW 9th Ct, Coral Springs, FL 33071
$-1,935
Cash flow
-11.7%
Cash-on-Cash Return
3.5%
Cap rate
0.6%
Rent to Value Ratio
Active
$685,000
4
bds
|
3
ba
|
2,512
sqft
|
built
2001
12604 NW 6th St, Coral Springs, FL 33071
$-1,572
Cash flow
-12.0%
Cash-on-Cash Return
3.4%
Cap rate
0.6%
Rent to Value Ratio
Active
$764,000
4
bds
|
2
ba
|
2,268
sqft
|
built
1978
611 NW 99th Ter, Coral Springs, FL 33071
$-1,393
Cash flow
-9.5%
Cash-on-Cash Return
4.0%
Cap rate
0.7%
Rent to Value Ratio
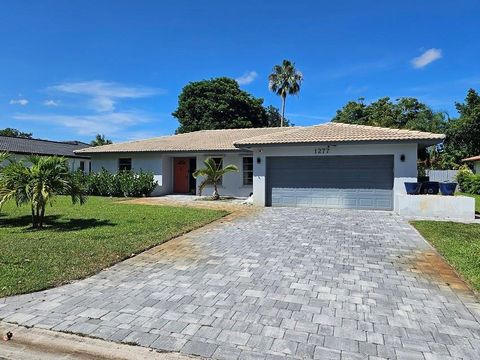
Active
$649,999
3
bds
|
2
ba
|
2,028
sqft
|
built
1977
1277 NW 85th Ter, Coral Springs, FL 33071
$-943
Cash flow
-7.6%
Cash-on-Cash Return
4.4%
Cap rate
0.6%
Rent to Value Ratio
Active
$479,000
4
bds
|
3
ba
|
2,334
sqft
|
built
1993
11373 Lakeview Dr, Coral Springs, FL 33071
$-1,566
Cash flow
-17.1%
Cash-on-Cash Return
2.2%
Cap rate
0.6%
Rent to Value Ratio
Active
$625,000
4
bds
|
2
ba
|
2,071
sqft
|
built
1975
8802 NW 20th Mnr, Coral Springs, FL 33071
$-1,142
Cash flow
-9.5%
Cash-on-Cash Return
4.0%
Cap rate
0.6%
Rent to Value Ratio
Active
$925,000
5
bds
|
4
ba
|
3,064
sqft
|
built
1999
900 NW 123rd Dr, Coral Springs, FL 33071
$-2,955
Cash flow
-16.7%
Cash-on-Cash Return
2.3%
Cap rate
0.5%
Rent to Value Ratio
Active
$899,000
5
bds
|
4
ba
|
2,687
sqft
|
built
1996
1574 NW 121st Dr, Coral Springs, FL 33071
$-747
Cash flow
-4.3%
Cash-on-Cash Return
5.1%
Cap rate
0.9%
Rent to Value Ratio
Active
$769,000
4
bds
|
2
ba
|
2,312
sqft
|
built
1982
10967 NW 12th Dr, Coral Springs, FL 33071
$-1,388
Cash flow
-9.4%
Cash-on-Cash Return
4.0%
Cap rate
0.7%
Rent to Value Ratio
Active
$449,800
3
bds
|
3
ba
|
1,690
sqft
|
built
1990
11664 NW 19th Dr, Coral Springs, FL 33071
$-1,721
Cash flow
-20.0%
Cash-on-Cash Return
1.6%
Cap rate
0.6%
Rent to Value Ratio

Active
$924,999
5
bds
|
4
ba
|
2,869
sqft
|
built
1997
467 NW 120th Dr, Coral Springs, FL 33071
$-2,250
Cash flow
-12.7%
Cash-on-Cash Return
3.2%
Cap rate
0.5%
Rent to Value Ratio
Active
$679,000
3
bds
|
2
ba
|
2,172
sqft
|
built
1975
1844 NW 83rd Dr, Coral Springs, FL 33071
$-1,070
Cash flow
-8.2%
Cash-on-Cash Return
4.3%
Cap rate
0.7%
Rent to Value Ratio

Active
$671,000
4
bds
|
2
ba
|
2,092
sqft
|
built
1974
1708 NW 84th Dr, Coral Springs, FL 33071
$-1,755
Cash flow
-13.6%
Cash-on-Cash Return
3.0%
Cap rate
0.5%
Rent to Value Ratio
Active
$774,999
5
bds
|
3
ba
|
2,726
sqft
|
built
1984
11008 NW 3rd St, Coral Springs, FL 33071
$-1,447
Cash flow
-9.7%
Cash-on-Cash Return
3.9%
Cap rate
0.6%
Rent to Value Ratio
Active
$340,000
3
bds
|
2
ba
|
1,407
sqft
|
built
2001
11765 W Atlantic Blvd, Coral Springs, FL 33071
$-809
Cash flow
-12.4%
Cash-on-Cash Return
3.3%
Cap rate
0.8%
Rent to Value Ratio

Active
$569,000
3
bds
|
3
ba
|
1,772
sqft
|
built
1994
457 NW 87th Ln, Coral Springs, FL 33071
$-1,066
Cash flow
-9.8%
Cash-on-Cash Return
3.9%
Cap rate
0.6%
Rent to Value Ratio

Active
$215,000
2
bds
|
2
ba
|
933
sqft
|
built
1984
10001 W Atlantic Blvd, Coral Springs, FL 33071
$-601
Cash flow
-14.6%
Cash-on-Cash Return
2.8%
Cap rate
0.8%
Rent to Value Ratio
Active
$499,900
4
bds
|
2
ba
|
2,246
sqft
|
built
1982
10925 NW 21st Pl, Coral Springs, FL 33071
$-260
Cash flow
-2.7%
Cash-on-Cash Return
5.5%
Cap rate
0.8%
Rent to Value Ratio
Active
$445,000
3
bds
|
3
ba
|
1,876
sqft
|
built
1988
10856 Cypress Glen Dr, Coral Springs, FL 33071
$-1,728
Cash flow
-20.3%
Cash-on-Cash Return
1.5%
Cap rate
0.7%
Rent to Value Ratio

Active
$799,900
4
bds
|
2
ba
|
2,293
sqft
|
built
1981
11044 NW 19th Mnr, Coral Springs, FL 33071
$-1,004
Cash flow
-6.5%
Cash-on-Cash Return
4.6%
Cap rate
0.7%
Rent to Value Ratio

Active
$580,000
3
bds
|
2
ba
|
1,518
sqft
|
built
1976
8888 NW 21st Ct, Coral Springs, FL 33071
$-1,187
Cash flow
-10.7%
Cash-on-Cash Return
3.7%
Cap rate
0.6%
Rent to Value Ratio
Active
$684,950
6
bds
|
3
ba
|
2,945
sqft
|
built
1983
1288 NW 112th Way, Coral Springs, FL 33071
$-1,462
Cash flow
-11.1%
Cash-on-Cash Return
3.6%
Cap rate
0.6%
Rent to Value Ratio

Active
$874,900
4
bds
|
3
ba
|
0
sqft
|
built
1983
2019 NW 108th Ln, Coral Springs, FL 33071
$-1,858
Cash flow
-11.1%
Cash-on-Cash Return
3.6%
Cap rate
0.5%
Rent to Value Ratio

Active
$265,000
2
bds
|
2
ba
|
1,044
sqft
|
built
1988
953 Coral Club Dr, Coral Springs, FL 33071
$-717
Cash flow
-14.1%
Cash-on-Cash Return
2.9%
Cap rate
0.8%
Rent to Value Ratio
Active
$729,995
4
bds
|
2
ba
|
2,106
sqft
|
built
1984
680 NW 111th Way, Coral Springs, FL 33071
$-1,153
Cash flow
-8.2%
Cash-on-Cash Return
4.3%
Cap rate
0.7%
Rent to Value Ratio
Active
$690,000
4
bds
|
2
ba
|
2,172
sqft
|
built
1996
12123 NW 15th Ct, Coral Springs, FL 33071
$-1,996
Cash flow
-15.1%
Cash-on-Cash Return
2.7%
Cap rate
0.6%
Rent to Value Ratio

Active
$685,000
4
bds
|
2
ba
|
1,954
sqft
|
built
1981
11061 NW 21st St, Coral Springs, FL 33071
$-1,490
Cash flow
-11.3%
Cash-on-Cash Return
3.5%
Cap rate
0.6%
Rent to Value Ratio

Active
$680,000
3
bds
|
2
ba
|
2,002
sqft
|
built
1978
639 NW 101st Ter, Coral Springs, FL 33071
$-1,004
Cash flow
-7.7%
Cash-on-Cash Return
4.4%
Cap rate
0.6%
Rent to Value Ratio
Active
$187,000
1
bds
|
1
ba
|
816
sqft
|
built
1988
1084 Coral Club Dr, Coral Springs, FL 33071
$-430
Cash flow
-12.0%
Cash-on-Cash Return
3.4%
Cap rate
1.0%
Rent to Value Ratio
Active
$564,999
3
bds
|
2
ba
|
1,403
sqft
|
built
1978
9039 NW 21st Ct, Coral Springs, FL 33071
$-1,182
Cash flow
-10.9%
Cash-on-Cash Return
3.6%
Cap rate
0.6%
Rent to Value Ratio
Active
$649,900
3
bds
|
2
ba
|
2,200
sqft
|
built
1979
10073 NW 7th Ct, Coral Springs, FL 33071
$-1,318
Cash flow
-10.6%
Cash-on-Cash Return
3.7%
Cap rate
0.5%
Rent to Value Ratio
Active
$309,900
2
bds
|
3
ba
|
1,190
sqft
|
built
1988
10803 Cypress Glen Dr, Coral Springs, FL 33071
$-1,249
Cash flow
-21.0%
Cash-on-Cash Return
1.3%
Cap rate
0.7%
Rent to Value Ratio
Active
$699,000
4
bds
|
3
ba
|
2,195
sqft
|
built
1979
8735 NW 1st St, Coral Springs, FL 33071
$-1,494
Cash flow
-11.2%
Cash-on-Cash Return
3.6%
Cap rate
0.5%
Rent to Value Ratio

Active
$195,000
2
bds
|
2
ba
|
768
sqft
|
built
1981
10052 Twin Lakes Dr, Coral Springs, FL 33071
$-499
Cash flow
-13.4%
Cash-on-Cash Return
3.1%
Cap rate
0.9%
Rent to Value Ratio
Active
$925,000
5
bds
|
4
ba
|
2,838
sqft
|
built
1991
12655 NW 17th Pl, Coral Springs, FL 33071
$-2,560
Cash flow
-14.4%
Cash-on-Cash Return
2.8%
Cap rate
0.6%
Rent to Value Ratio
Active
$1,495,000
4
bds
|
3
ba
|
3,320
sqft
|
built
1997
11904 NW 9th St, Coral Springs, FL 33071
$-5,268
Cash flow
-18.4%
Cash-on-Cash Return
1.9%
Cap rate
0.4%
Rent to Value Ratio