33071 Investment Properties for Sale
Browse homes for sale and investment properties in 33071. Refine your search by price, property type, or more.
Best cash flowing properties in 33071
Active
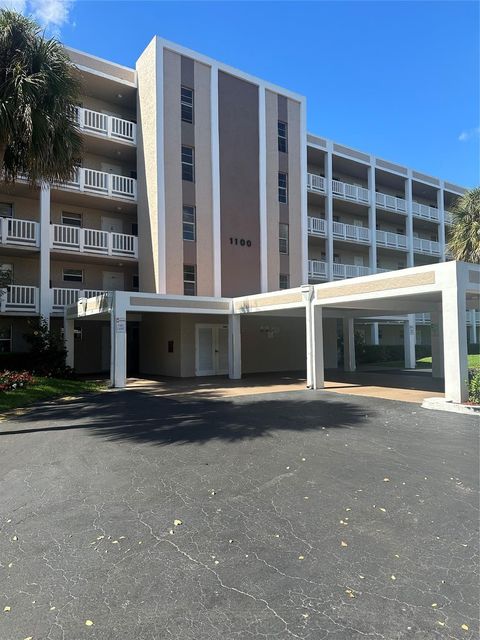
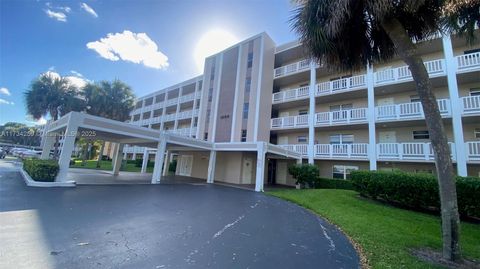
$128,000
1
bds
|
2
ba
|
1,000
sqft
|
built
1980
1100 NW 87th Ave, Coral Springs, FL 33071
$-32
Cash flow
-1.3%
Cash-on-Cash Return
5.9%
Cap rate
1.3%
Rent to Value Ratio
Active
$200,000
2
bds
|
2
ba
|
990
sqft
|
built
1980
1200 NW 87th Ave, Coral Springs, FL 33071
$-445
Cash flow
-11.6%
Cash-on-Cash Return
3.5%
Cap rate
1.0%
Rent to Value Ratio
208 out of 235 properties for sale in 33071
Limited Results Shown
Create a free account, or log in to reveal all property listings and enjoy the complete experience.

Active
$700,000
4
bds
|
4
ba
|
2,626
sqft
|
built
1983
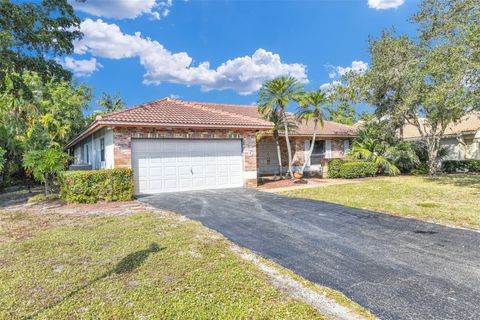
653 NW 110th Ave, Coral Springs, FL 33071
$-1,797
Cash flow
-13.4%
Cash-on-Cash Return
3.1%
Cap rate
0.6%
Rent to Value Ratio

Active
$849,000
4
bds
|
3
ba
|
2,563
sqft
|
built
1986
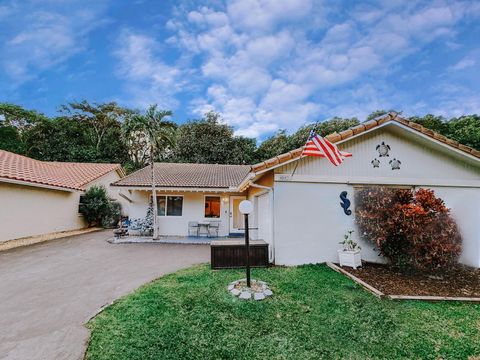
11266 NW 20th Dr, Coral Springs, FL 33071
$-1,744
Cash flow
-10.7%
Cash-on-Cash Return
3.7%
Cap rate
0.6%
Rent to Value Ratio
Active
$269,900
3
bds
|
2
ba
|
1,375
sqft
|
built
1983
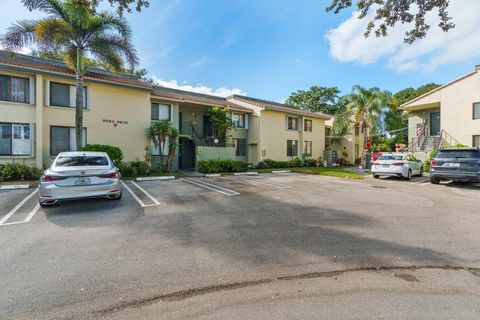
2083 Coral Ridge Dr, Coral Springs, FL 33071
$-797
Cash flow
-15.4%
Cash-on-Cash Return
2.6%
Cap rate
0.9%
Rent to Value Ratio
Active
$379,900
2
bds
|
2
ba
|
1,430
sqft
|
built
1993
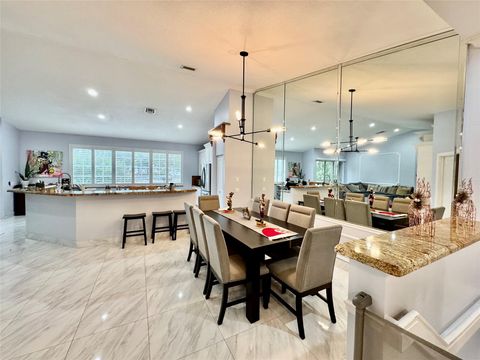
12441 NW 10th Ct, Coral Springs, FL 33071
$-1,312
Cash flow
-18.0%
Cash-on-Cash Return
2.0%
Cap rate
0.7%
Rent to Value Ratio
Active
$639,999
3
bds
|
2
ba
|
2,094
sqft
|
built
1974
1579 NW 84th Dr, Coral Springs, FL 33071
$-832
Cash flow
-6.8%
Cash-on-Cash Return
4.6%
Cap rate
0.7%
Rent to Value Ratio
Active
$128,000
1
bds
|
2
ba
|
1,000
sqft
|
built
1980
1100 NW 87th Ave, Coral Springs, FL 33071
$-32
Cash flow
-1.3%
Cash-on-Cash Return
5.9%
Cap rate
1.3%
Rent to Value Ratio
Active
$619,900
4
bds
|
3
ba
|
2,450
sqft
|
built
1984
564 NW 113th Ter, Coral Springs, FL 33071
$-832
Cash flow
-7.0%
Cash-on-Cash Return
4.5%
Cap rate
0.7%
Rent to Value Ratio
Active
$230,000
2
bds
|
2
ba
|
990
sqft
|
built
1980
8735 Ramblewood Dr, Coral Springs, FL 33071
$-634
Cash flow
-14.4%
Cash-on-Cash Return
2.8%
Cap rate
0.9%
Rent to Value Ratio
Active
$209,000
2
bds
|
1
ba
|
980
sqft
|
built
1987
833 Riverside Dr, Coral Springs, FL 33071
$-650
Cash flow
-16.2%
Cash-on-Cash Return
2.4%
Cap rate
1.0%
Rent to Value Ratio

Active
$549,650
3
bds
|
2
ba
|
1,542
sqft
|
built
1985
1666 NW 106th Ter, Coral Springs, FL 33071
$-1,296
Cash flow
-12.3%
Cash-on-Cash Return
3.3%
Cap rate
0.7%
Rent to Value Ratio
Active
$299,900
3
bds
|
2
ba
|
1,186
sqft
|
built
1987
9633 Riverside Dr, Coral Springs, FL 33071
$-955
Cash flow
-16.6%
Cash-on-Cash Return
2.3%
Cap rate
0.8%
Rent to Value Ratio
Active
$925,000
5
bds
|
3
ba
|
3,035
sqft
|
built
1999
865 NW 124th Ave, Coral Springs, FL 33071
$-1,885
Cash flow
-10.6%
Cash-on-Cash Return
3.7%
Cap rate
0.7%
Rent to Value Ratio

Active
$219,000
2
bds
|
2
ba
|
768
sqft
|
built
1982
10194 Twin Lakes Dr, Coral Springs, FL 33071
$-753
Cash flow
-17.9%
Cash-on-Cash Return
2.0%
Cap rate
0.9%
Rent to Value Ratio

Active
$290,000
2
bds
|
3
ba
|
1,190
sqft
|
built
1988
10836 Cypress Glen Dr, Coral Springs, FL 33071
$-1,100
Cash flow
-19.8%
Cash-on-Cash Return
1.6%
Cap rate
0.8%
Rent to Value Ratio
Active
$200,000
2
bds
|
2
ba
|
990
sqft
|
built
1980
1200 NW 87th Ave, Coral Springs, FL 33071
$-445
Cash flow
-11.6%
Cash-on-Cash Return
3.5%
Cap rate
1.0%
Rent to Value Ratio
Active
$699,000
3
bds
|
2
ba
|
2,105
sqft
|
built
1981
10960 NW 17th Pl, Coral Springs, FL 33071
$-1,536
Cash flow
-11.5%
Cash-on-Cash Return
3.5%
Cap rate
0.6%
Rent to Value Ratio

Active
$799,000
4
bds
|
3
ba
|
2,446
sqft
|
built
1990
12043 SW 1st St, Coral Springs, FL 33071
$-1,636
Cash flow
-10.7%
Cash-on-Cash Return
3.7%
Cap rate
0.6%
Rent to Value Ratio

Active
$294,000
2
bds
|
2
ba
|
1,200
sqft
|
built
1987
995 Riverside Dr, Coral Springs, FL 33071
$-1,038
Cash flow
-18.4%
Cash-on-Cash Return
1.9%
Cap rate
0.9%
Rent to Value Ratio

Active
$265,000
3
bds
|
2
ba
|
1,340
sqft
|
built
2002
10151 W Atlantic Blvd, Coral Springs, FL 33071
$-540
Cash flow
-10.6%
Cash-on-Cash Return
3.7%
Cap rate
0.9%
Rent to Value Ratio
Active
$225,000
2
bds
|
2
ba
|
768
sqft
|
built
1981
918 Twin Lakes Dr, Coral Springs, FL 33071
$-857
Cash flow
-19.9%
Cash-on-Cash Return
1.6%
Cap rate
0.8%
Rent to Value Ratio
Active
$200,000
2
bds
|
2
ba
|
990
sqft
|
built
1980
1200 NW 87th Ave, Coral Springs, FL 33071
$-457
Cash flow
-11.9%
Cash-on-Cash Return
3.4%
Cap rate
1.0%
Rent to Value Ratio
Active
$338,900
3
bds
|
2
ba
|
1,390
sqft
|
built
1982
9520 SW 1st Ct, Coral Springs, FL 33071
$-866
Cash flow
-13.3%
Cash-on-Cash Return
3.1%
Cap rate
0.8%
Rent to Value Ratio

Active
$285,000
3
bds
|
2
ba
|
1,270
sqft
|
built
1983
2059 Coral Ridge Dr, Coral Springs, FL 33071
$-897
Cash flow
-16.4%
Cash-on-Cash Return
2.4%
Cap rate
0.8%
Rent to Value Ratio
Active
$448,500
3
bds
|
2
ba
|
1,850
sqft
|
built
1994
12442 NW 10th Ct, Coral Springs, FL 33071
$-999
Cash flow
-11.6%
Cash-on-Cash Return
3.5%
Cap rate
0.8%
Rent to Value Ratio
Active
$209,000
1
bds
|
1
ba
|
950
sqft
|
built
1987
777 Riverside Dr, Coral Springs, FL 33071
$-689
Cash flow
-17.2%
Cash-on-Cash Return
2.2%
Cap rate
0.9%
Rent to Value Ratio
Active
$699,900
4
bds
|
2
ba
|
2,194
sqft
|
built
1982
1230 NW 110th Ter, Coral Springs, FL 33071
$-656
Cash flow
-4.9%
Cash-on-Cash Return
5.0%
Cap rate
0.7%
Rent to Value Ratio
Active
$515,000
3
bds
|
2
ba
|
1,365
sqft
|
built
1983
402 Shadow Wood Ln, Coral Springs, FL 33071
$-850
Cash flow
-8.6%
Cash-on-Cash Return
4.2%
Cap rate
0.7%
Rent to Value Ratio
Active
$349,900
3
bds
|
2
ba
|
1,390
sqft
|
built
1981
9592 SW 1st Ct, Coral Springs, FL 33071
$-683
Cash flow
-10.2%
Cash-on-Cash Return
3.8%
Cap rate
0.8%
Rent to Value Ratio
Active
$445,000
3
bds
|
2
ba
|
1,845
sqft
|
built
1994
12337 NW 10th Dr, Coral Springs, FL 33071
$-1,242
Cash flow
-14.6%
Cash-on-Cash Return
2.8%
Cap rate
0.7%
Rent to Value Ratio
Active
$924,000
4
bds
|
3
ba
|
3,066
sqft
|
built
1990
11834 Highland Pl, Coral Springs, FL 33071
$-2,028
Cash flow
-11.5%
Cash-on-Cash Return
3.5%
Cap rate
0.7%
Rent to Value Ratio
Active
$210,000
2
bds
|
2
ba
|
768
sqft
|
built
1981
10036 Twin Lakes Dr, Coral Springs, FL 33071
$-585
Cash flow
-14.5%
Cash-on-Cash Return
2.8%
Cap rate
1.0%
Rent to Value Ratio
Active
$224,000
2
bds
|
2
ba
|
933
sqft
|
built
1984
10001 W Atlantic Blvd, Coral Springs, FL 33071
$-586
Cash flow
-13.6%
Cash-on-Cash Return
3.0%
Cap rate
0.8%
Rent to Value Ratio
Active
$2,175,000
6
bds
|
7
ba
|
6,684
sqft
|
built
1990
12040 Eagle Trace Blvd N, Coral Springs, FL 33071
$-6,344
Cash flow
-15.2%
Cash-on-Cash Return
2.6%
Cap rate
0.5%
Rent to Value Ratio
Active
$260,000
2
bds
|
2
ba
|
1,074
sqft
|
built
1987
1156 Coral Club Dr, Coral Springs, FL 33071
$-767
Cash flow
-15.4%
Cash-on-Cash Return
2.6%
Cap rate
0.8%
Rent to Value Ratio
Active
$649,000
3
bds
|
2
ba
|
2,087
sqft
|
built
1978
892 NW 83rd Dr, Coral Springs, FL 33071
$-987
Cash flow
-7.9%
Cash-on-Cash Return
4.3%
Cap rate
0.8%
Rent to Value Ratio
Active
$679,999
4
bds
|
2
ba
|
1,984
sqft
|
built
1983
10820 NW 10th Pl, Coral Springs, FL 33071
$-1,450
Cash flow
-11.1%
Cash-on-Cash Return
3.6%
Cap rate
0.6%
Rent to Value Ratio
Active
$989,999
4
bds
|
5
ba
|
3,208
sqft
|
built
1991
1775 Eagle Trace Blvd W, Coral Springs, FL 33071
$-2,247
Cash flow
-11.8%
Cash-on-Cash Return
3.4%
Cap rate
0.7%
Rent to Value Ratio
Active
$265,000
2
bds
|
2
ba
|
986
sqft
|
built
1990
9200 W Atlantic Blvd, Coral Springs, FL 33071
$-827
Cash flow
-16.3%
Cash-on-Cash Return
2.4%
Cap rate
0.8%
Rent to Value Ratio
Active
$215,000
2
bds
|
1
ba
|
980
sqft
|
built
1987
833 Riverside Dr, Coral Springs, FL 33071
$-698
Cash flow
-16.9%
Cash-on-Cash Return
2.2%
Cap rate
0.8%
Rent to Value Ratio
Active
$265,000
2
bds
|
2
ba
|
1,040
sqft
|
built
1982
9549 NW 2nd Pl, Coral Springs, FL 33071
$-882
Cash flow
-17.4%
Cash-on-Cash Return
2.2%
Cap rate
0.8%
Rent to Value Ratio