33071 Investment Properties for Sale
Browse homes for sale and investment properties in 33071. Refine your search by price, property type, or more.
Best cash flowing properties in 33071

Active
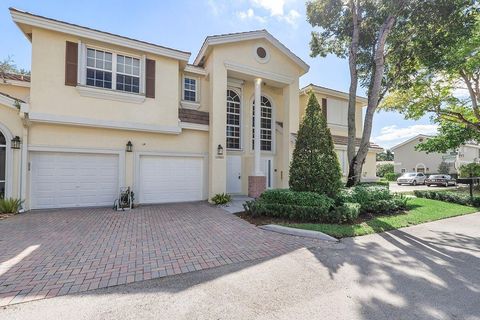
$325,000
2
bds
|
3
ba
|
1,190
sqft
|
built
1988
10821 Cypress Glen Dr, Coral Springs, FL 33071
$0
Cash flow
n/a
Cash-on-Cash Return
n/a
Cap rate
n/a
Rent to Value Ratio

Active
$165,000
2
bds
|
2
ba
|
768
sqft
|
built
1981
10060 Twin Lakes Dr, Coral Springs, FL 33071
$-15
Cash flow
-0.5%
Cash-on-Cash Return
6.0%
Cap rate
1.1%
Rent to Value Ratio
208 out of 235 properties for sale in 33071
Limited Results Shown
Create a free account, or log in to reveal all property listings and enjoy the complete experience.
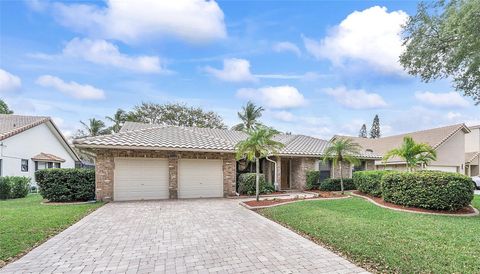
Active
$425,000
3
bds
|
2
ba
|
1,845
sqft
|
built
1994
12342 NW 10th Dr, Coral Springs, FL 33071
$-1,517
Cash flow
-18.6%
Cash-on-Cash Return
1.9%
Cap rate
0.7%
Rent to Value Ratio

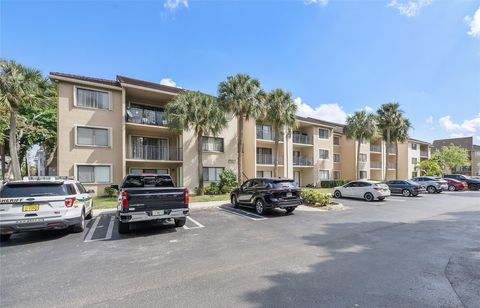
Active
$730,000
5
bds
|
3
ba
|
2,472
sqft
|
built
1974
1980 NW 81st Ave, Coral Springs, FL 33071
$-1,758
Cash flow
-12.6%
Cash-on-Cash Return
3.3%
Cap rate
0.5%
Rent to Value Ratio
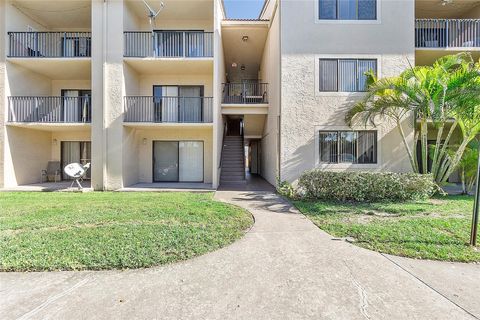
Active
$759,000
4
bds
|
3
ba
|
2,389
sqft
|
built
1984
10866 NW 14th St, Coral Springs, FL 33071
$-1,393
Cash flow
-9.6%
Cash-on-Cash Return
3.9%
Cap rate
0.6%
Rent to Value Ratio

Active
$799,900
4
bds
|
3
ba
|
2,640
sqft
|
built
1992
12737 NW 18th Pl, Coral Springs, FL 33071
$-1,357
Cash flow
-8.9%
Cash-on-Cash Return
4.1%
Cap rate
0.7%
Rent to Value Ratio

Active
$225,000
2
bds
|
2
ba
|
1,060
sqft
|
built
1987
915 Riverside Dr, Coral Springs, FL 33071
$-949
Cash flow
-22.0%
Cash-on-Cash Return
1.1%
Cap rate
0.8%
Rent to Value Ratio

Active
$899,000
4
bds
|
3
ba
|
2,797
sqft
|
built
1984
10877 NW 6th St, Coral Springs, FL 33071
$-1,176
Cash flow
-6.8%
Cash-on-Cash Return
4.6%
Cap rate
0.8%
Rent to Value Ratio
Active
$265,000
3
bds
|
2
ba
|
1,263
sqft
|
built
1990
9188 W Atlantic Blvd, Coral Springs, FL 33071
$-802
Cash flow
-15.8%
Cash-on-Cash Return
2.5%
Cap rate
0.9%
Rent to Value Ratio
Active
$265,000
3
bds
|
2
ba
|
1,273
sqft
|
built
1991
9188 W Atlantic Blvd, Coral Springs, FL 33071
$-806
Cash flow
-15.9%
Cash-on-Cash Return
2.5%
Cap rate
0.9%
Rent to Value Ratio

Active
$445,000
3
bds
|
3
ba
|
1,737
sqft
|
built
1992
11405 Lakeview Dr, Coral Springs, FL 33071
$-1,433
Cash flow
-16.8%
Cash-on-Cash Return
2.3%
Cap rate
0.7%
Rent to Value Ratio
Active
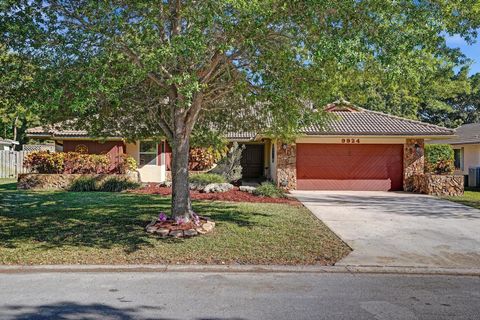
$779,000
4
bds
|
3
ba
|
2,575
sqft
|
built
1979
9924 NW 3rd Pl, Coral Springs, FL 33071
$-1,136
Cash flow
-7.6%
Cash-on-Cash Return
4.4%
Cap rate
0.7%
Rent to Value Ratio

Active
$243,000
2
bds
|
2
ba
|
986
sqft
|
built
1990
9244 W Atlantic Blvd, Coral Springs, FL 33071
$-746
Cash flow
-16.0%
Cash-on-Cash Return
2.5%
Cap rate
0.8%
Rent to Value Ratio
Active
$325,000
2
bds
|
3
ba
|
1,190
sqft
|
built
1988
10821 Cypress Glen Dr, Coral Springs, FL 33071
$0
Cash flow
n/a
Cash-on-Cash Return
n/a
Cap rate
n/a
Rent to Value Ratio
Active
$330,000
3
bds
|
2
ba
|
1,260
sqft
|
built
1982
9545 NW 2nd Pl, Coral Springs, FL 33071
$-1,133
Cash flow
-17.9%
Cash-on-Cash Return
2.0%
Cap rate
0.7%
Rent to Value Ratio
Active
$170,000
2
bds
|
2
ba
|
768
sqft
|
built
1982
836 Twin Lakes Dr, Coral Springs, FL 33071
$-526
Cash flow
-16.1%
Cash-on-Cash Return
2.4%
Cap rate
1.1%
Rent to Value Ratio
Active
$749,000
4
bds
|
3
ba
|
2,221
sqft
|
built
1983
11408 NW 20th Dr, Coral Springs, FL 33071
$-1,431
Cash flow
-10.0%
Cash-on-Cash Return
3.9%
Cap rate
0.6%
Rent to Value Ratio
Active
$246,000
2
bds
|
2
ba
|
1,210
sqft
|
built
1999
10111 W Atlantic Blvd, Coral Springs, FL 33071
$-737
Cash flow
-15.6%
Cash-on-Cash Return
2.6%
Cap rate
0.8%
Rent to Value Ratio
Active
$594,900
3
bds
|
2
ba
|
1,944
sqft
|
built
1978
286 NW 83rd Ln, Coral Springs, FL 33071
$-1,308
Cash flow
-11.5%
Cash-on-Cash Return
3.5%
Cap rate
0.5%
Rent to Value Ratio
Active
$339,999
3
bds
|
2
ba
|
1,396
sqft
|
built
1982
9502 SW 1st Ct, Coral Springs, FL 33071
$-1,091
Cash flow
-16.7%
Cash-on-Cash Return
2.3%
Cap rate
0.7%
Rent to Value Ratio
Active
$899,000
4
bds
|
8
ba
|
2,611
sqft
|
built
1991
12736 NW 18th Pl, Coral Springs, FL 33071
$-1,703
Cash flow
-9.9%
Cash-on-Cash Return
3.9%
Cap rate
0.6%
Rent to Value Ratio
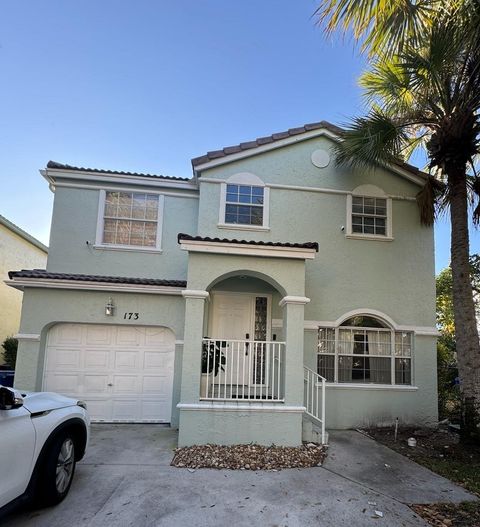
Active
$550,000
3
bds
|
3
ba
|
1,653
sqft
|
built
1993
173 NW 118th Dr, Coral Springs, FL 33071
$-1,197
Cash flow
-11.4%
Cash-on-Cash Return
3.5%
Cap rate
0.6%
Rent to Value Ratio
Active
$165,000
2
bds
|
2
ba
|
768
sqft
|
built
1981
10060 Twin Lakes Dr, Coral Springs, FL 33071
$-15
Cash flow
-0.5%
Cash-on-Cash Return
6.0%
Cap rate
1.1%
Rent to Value Ratio
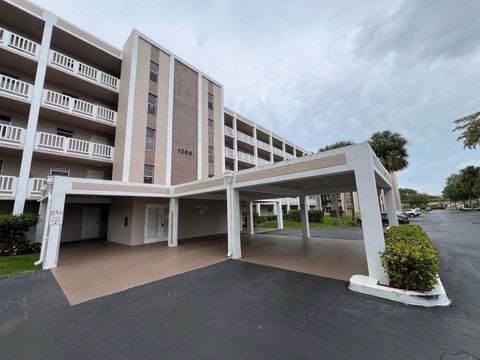
Active
$160,000
2
bds
|
2
ba
|
1,100
sqft
|
built
1980
1200 NW 87th Ave, Coral Springs, FL 33071
$-220
Cash flow
-7.2%
Cash-on-Cash Return
4.5%
Cap rate
1.3%
Rent to Value Ratio
Active
$875,000
3
bds
|
2
ba
|
2,192
sqft
|
built
1976
906 NW 83rd Dr, Coral Springs, FL 33071
$-2,522
Cash flow
-15.0%
Cash-on-Cash Return
2.7%
Cap rate
0.4%
Rent to Value Ratio
Active
$920,000
4
bds
|
4
ba
|
2,924
sqft
|
built
1990
2150 Warwick Hills Way, Coral Springs, FL 33071
$-1,521
Cash flow
-8.6%
Cash-on-Cash Return
4.2%
Cap rate
0.8%
Rent to Value Ratio
Active
$259,000
2
bds
|
2
ba
|
1,200
sqft
|
built
1987
995 Riverside Dr, Coral Springs, FL 33071
$-1,029
Cash flow
-20.7%
Cash-on-Cash Return
1.4%
Cap rate
0.8%
Rent to Value Ratio
Active
$285,000
3
bds
|
2
ba
|
1,100
sqft
|
built
1983
8751 Shadow Wood Blvd, Coral Springs, FL 33071
$-995
Cash flow
-18.2%
Cash-on-Cash Return
2.0%
Cap rate
0.8%
Rent to Value Ratio
Active
$215,000
2
bds
|
2
ba
|
768
sqft
|
built
1982
835 Twin Lakes Dr, Coral Springs, FL 33071
$-740
Cash flow
-18.0%
Cash-on-Cash Return
2.0%
Cap rate
0.8%
Rent to Value Ratio
Active
$215,000
2
bds
|
2
ba
|
768
sqft
|
built
1983
10102 Twin Lakes Dr, Coral Springs, FL 33071
$-771
Cash flow
-18.7%
Cash-on-Cash Return
1.8%
Cap rate
0.8%
Rent to Value Ratio
Active
$235,000
2
bds
|
2
ba
|
933
sqft
|
built
1984
10001 W Atlantic Blvd, Coral Springs, FL 33071
$-570
Cash flow
-12.7%
Cash-on-Cash Return
3.2%
Cap rate
0.9%
Rent to Value Ratio
Active
$779,900
4
bds
|
2
ba
|
1,840
sqft
|
built
1983
11085 NW 15th St, Coral Springs, FL 33071
$-1,670
Cash flow
-11.2%
Cash-on-Cash Return
3.6%
Cap rate
0.6%
Rent to Value Ratio

Active
$735,000
4
bds
|
3
ba
|
2,335
sqft
|
built
1981
1266 NW 111th Way, Coral Springs, FL 33071
$-1,424
Cash flow
-10.1%
Cash-on-Cash Return
3.8%
Cap rate
0.6%
Rent to Value Ratio
Active
$1,425,000
4
bds
|
4
ba
|
3,314
sqft
|
built
1994
1254 NW 102nd Way, Coral Springs, FL 33071
$-1,378
Cash flow
-5.0%
Cash-on-Cash Return
5.0%
Cap rate
0.7%
Rent to Value Ratio
Active
$894,900
5
bds
|
3
ba
|
3,035
sqft
|
built
1999
12351 NW 7th Ct, Coral Springs, FL 33071
$-2,640
Cash flow
-15.4%
Cash-on-Cash Return
2.6%
Cap rate
0.5%
Rent to Value Ratio
Active
$654,900
4
bds
|
3
ba
|
2,476
sqft
|
built
1999
754 NW 126th Ave, Coral Springs, FL 33071
$-1,538
Cash flow
-12.3%
Cash-on-Cash Return
3.3%
Cap rate
0.7%
Rent to Value Ratio
Active
$254,000
2
bds
|
2
ba
|
986
sqft
|
built
1990
9200 W Atlantic Blvd, Coral Springs, FL 33071
$-745
Cash flow
-15.3%
Cash-on-Cash Return
2.6%
Cap rate
0.8%
Rent to Value Ratio

Active
$200,000
2
bds
|
2
ba
|
768
sqft
|
built
1981
10004 Twin Lakes Dr, Coral Springs, FL 33071
$-679
Cash flow
-17.7%
Cash-on-Cash Return
2.1%
Cap rate
0.9%
Rent to Value Ratio
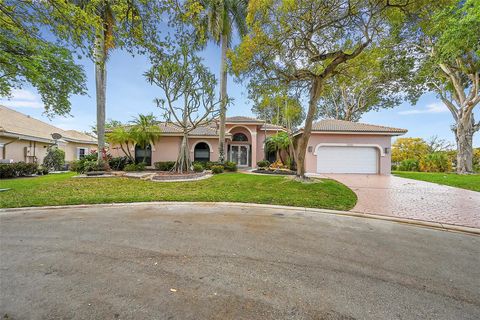
Active
$925,000
4
bds
|
4
ba
|
3,032
sqft
|
built
1984
1137 NW 111th Way, Coral Springs, FL 33071
$-1,155
Cash flow
-6.5%
Cash-on-Cash Return
4.6%
Cap rate
0.8%
Rent to Value Ratio
Active
$500,000
3
bds
|
2
ba
|
1,548
sqft
|
built
2001
12625 NW 7th Ct, Coral Springs, FL 33071
$-1,045
Cash flow
-10.9%
Cash-on-Cash Return
3.6%
Cap rate
0.6%
Rent to Value Ratio
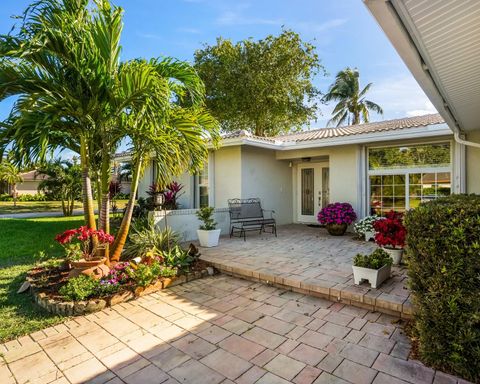
Active
$739,900
4
bds
|
3
ba
|
2,137
sqft
|
built
1984
1348 NW 113th Ter, Coral Springs, FL 33071
$-679
Cash flow
-4.8%
Cash-on-Cash Return
5.0%
Cap rate
0.7%
Rent to Value Ratio
Active
$179,900
1
bds
|
2
ba
|
835
sqft
|
built
1980
1200 NW 87th Ave, Coral Springs, FL 33071
$-277
Cash flow
-8.0%
Cash-on-Cash Return
4.3%
Cap rate
0.9%
Rent to Value Ratio