33127 Investment Properties for Sale
Browse homes for sale and investment properties in 33127. Refine your search by price, property type, or more.
Best cash flowing properties in 33127
Active
$319,000
2
bds
|
1
ba
|
956
sqft
|
built
1940
2025 NW 6th Pl, Miami, FL 33127
$436
Cash flow
7.1%
Cash-on-Cash Return
7.8%
Cap rate
1.0%
Rent to Value Ratio

Active
$970,000
5
bds
|
3
ba
|
1,426
sqft
|
built
1938
231 NW 44th St, Miami, FL 33127
$-711
Cash flow
-3.8%
Cash-on-Cash Return
5.3%
Cap rate
0.8%
Rent to Value Ratio
127 out of 138 properties for sale in 33127
Limited Results Shown
Create a free account, or log in to reveal all property listings and enjoy the complete experience.
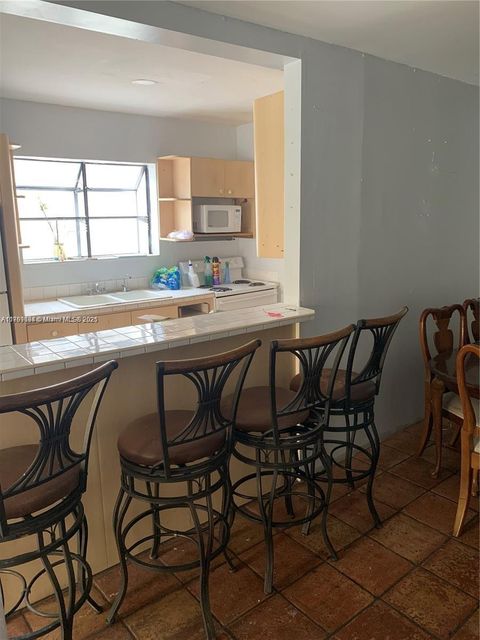
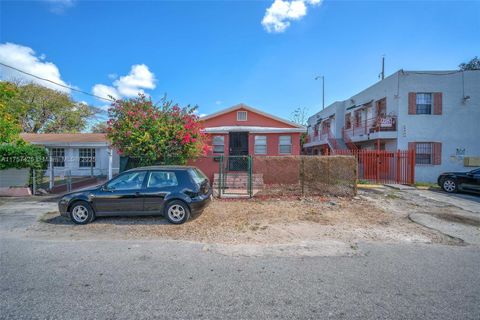
Active
$420,000
3
bds
|
3
ba
|
2,094
sqft
|
built
1924
1037 NW 30th St, Miami, FL 33127
$-1,330
Cash flow
-16.5%
Cash-on-Cash Return
2.3%
Cap rate
0.5%
Rent to Value Ratio
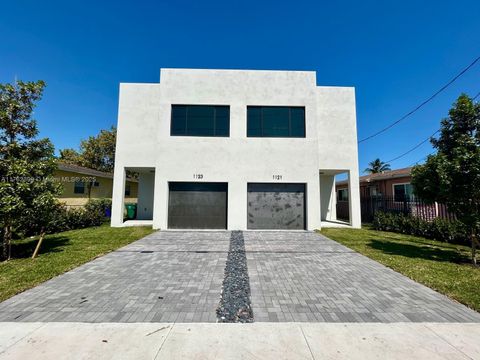
Active
$1,295,000
4
bds
|
0
ba
|
4,000
sqft
|
built
2025
1121 NW 25th St, Miami, FL 33127
$-4,216
Cash flow
-17.0%
Cash-on-Cash Return
2.2%
Cap rate
0.3%
Rent to Value Ratio
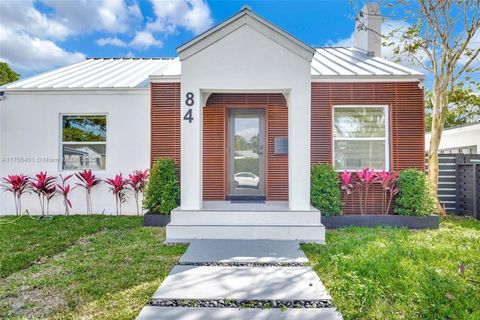
Active
$1,250,000
4
bds
|
3
ba
|
1,606
sqft
|
built
2024
84 NW 48th St, Miami, FL 33127
$-2,437
Cash flow
-10.2%
Cash-on-Cash Return
3.8%
Cap rate
0.6%
Rent to Value Ratio
Active
$795,000
3
bds
|
2
ba
|
1,385
sqft
|
built
1925
109 NW 48th St, Miami, FL 33127
$-1,141
Cash flow
-7.5%
Cash-on-Cash Return
4.4%
Cap rate
0.6%
Rent to Value Ratio
Active
$1,050,000
3
bds
|
2
ba
|
1,096
sqft
|
built
1939
4520 NW 3rd Ave, Miami, FL 33127
$-3,554
Cash flow
-17.7%
Cash-on-Cash Return
2.1%
Cap rate
0.4%
Rent to Value Ratio
Active
$875,000
4
bds
|
0
ba
|
1,378
sqft
|
built
1955
5505 NW 5th Ct, Miami, FL 33127
$-2,769
Cash flow
-16.5%
Cash-on-Cash Return
2.3%
Cap rate
0.4%
Rent to Value Ratio
Active
$1,600,000
bds
|
0
ba
|
1,176
sqft
|
built
1949
70 NW 33rd St, Miami, FL 33127
$-4,361
Cash flow
-14.2%
Cash-on-Cash Return
2.9%
Cap rate
0.4%
Rent to Value Ratio
Active
$1,500,000
4
bds
|
0
ba
|
2,890
sqft
|
built
1947
5501 NW Miami Ct, Miami, FL 33127
$-7,048
Cash flow
-24.5%
Cash-on-Cash Return
0.5%
Cap rate
0.1%
Rent to Value Ratio

Active
$860,000
5
bds
|
3
ba
|
1,445
sqft
|
built
1937
93 NW 44th St, Miami, FL 33127
$-2,266
Cash flow
-13.7%
Cash-on-Cash Return
3.0%
Cap rate
0.4%
Rent to Value Ratio
Active
$1,490,000
3
bds
|
3
ba
|
1,740
sqft
|
built
2023
416 NW 52nd St, Miami, FL 33127
$-3,298
Cash flow
-11.5%
Cash-on-Cash Return
3.5%
Cap rate
0.6%
Rent to Value Ratio
Active
$1,499,900
3
bds
|
3
ba
|
1,740
sqft
|
built
2023
408 NW 52nd St, Miami, FL 33127
$-3,279
Cash flow
-11.4%
Cash-on-Cash Return
3.5%
Cap rate
0.6%
Rent to Value Ratio

Active
$1,499,900
3
bds
|
3
ba
|
1,740
sqft
|
built
2023
410 NW 52nd St, Miami, FL 33127
$-3,279
Cash flow
-11.4%
Cash-on-Cash Return
3.5%
Cap rate
0.6%
Rent to Value Ratio
Active
$1,490,900
3
bds
|
3
ba
|
1,740
sqft
|
built
2023
414 NW 52nd St, Miami, FL 33127
$-3,302
Cash flow
-11.6%
Cash-on-Cash Return
3.5%
Cap rate
0.6%
Rent to Value Ratio
Active
$690,000
4
bds
|
0
ba
|
1,560
sqft
|
built
1948
5155 NW 12th Ave, Miami, FL 33127
$-2,182
Cash flow
-16.5%
Cash-on-Cash Return
2.4%
Cap rate
0.4%
Rent to Value Ratio

Active
$745,000
2
bds
|
2
ba
|
1,086
sqft
|
built
1939
299 NW 43rd St, Miami, FL 33127
$-3,136
Cash flow
-22.0%
Cash-on-Cash Return
1.1%
Cap rate
0.3%
Rent to Value Ratio
Active
$1,700,000
3
bds
|
0
ba
|
1,987
sqft
|
built
1928
675 NW 34th St, Miami, FL 33127
$-7,708
Cash flow
-23.7%
Cash-on-Cash Return
0.7%
Cap rate
0.1%
Rent to Value Ratio
Active
$649,900
8
bds
|
0
ba
|
2,320
sqft
|
built
1957
412 NW 59th St, Miami, FL 33127
$-2,144
Cash flow
-17.2%
Cash-on-Cash Return
2.2%
Cap rate
0.4%
Rent to Value Ratio
Active
$625,000
4
bds
|
0
ba
|
1,378
sqft
|
built
1970
5752 NW 1st Ave, Miami, FL 33127
$-2,302
Cash flow
-19.2%
Cash-on-Cash Return
1.7%
Cap rate
0.4%
Rent to Value Ratio
Active
$600,000
4
bds
|
0
ba
|
1,560
sqft
|
built
1952
5241 NW 11th Ave, Miami, FL 33127
$-1,726
Cash flow
-15.0%
Cash-on-Cash Return
2.7%
Cap rate
0.4%
Rent to Value Ratio
Active
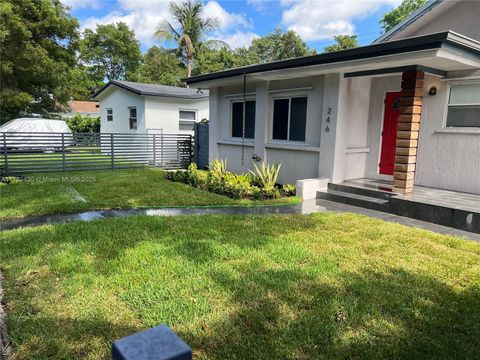
$980,000
3
bds
|
2
ba
|
1,324
sqft
|
built
1937
246 NW 41st St, Miami, FL 33127
$-2,686
Cash flow
-14.3%
Cash-on-Cash Return
2.9%
Cap rate
0.4%
Rent to Value Ratio
Active
$650,000
3
bds
|
2
ba
|
1,172
sqft
|
built
1939
575 NW 49th St, Miami, FL 33127
$-1,963
Cash flow
-15.8%
Cash-on-Cash Return
2.5%
Cap rate
0.4%
Rent to Value Ratio
Active
$899,000
4
bds
|
3
ba
|
1,984
sqft
|
built
1937
781 NW 30th St, Miami, FL 33127
$-2,033
Cash flow
-11.8%
Cash-on-Cash Return
3.4%
Cap rate
0.4%
Rent to Value Ratio
Active
$1,298,000
4
bds
|
0
ba
|
0
sqft
|
built
1968
3240 NW 3rd Ave, Miami, FL 33127
$-5,790
Cash flow
-23.3%
Cash-on-Cash Return
0.8%
Cap rate
0.2%
Rent to Value Ratio
Active
$545,000
4
bds
|
2
ba
|
1,500
sqft
|
built
2021
1125 NW 58th St, Miami, FL 33127
$-1,103
Cash flow
-10.6%
Cash-on-Cash Return
3.7%
Cap rate
0.7%
Rent to Value Ratio
Active
$1,395,000
4
bds
|
0
ba
|
3,640
sqft
|
built
1946
2900 NW 10th Ave, Miami, FL 33127
$-6,731
Cash flow
-25.2%
Cash-on-Cash Return
0.4%
Cap rate
0.2%
Rent to Value Ratio
Active
$670,000
2
bds
|
2
ba
|
834
sqft
|
built
1940
585 NW 51st St, Miami, FL 33127
$-2,338
Cash flow
-18.2%
Cash-on-Cash Return
2.0%
Cap rate
0.4%
Rent to Value Ratio
Active
$3,900,000
3
bds
|
0
ba
|
2,105
sqft
|
built
1946
280 NW 33rd St, Miami, FL 33127
$-19,127
Cash flow
-25.6%
Cash-on-Cash Return
0.3%
Cap rate
0.1%
Rent to Value Ratio
Active
$1,375,000
3
bds
|
3
ba
|
1,981
sqft
|
built
1947
354 NW 43rd St, Miami, FL 33127
$-1,377
Cash flow
-5.2%
Cash-on-Cash Return
4.9%
Cap rate
0.6%
Rent to Value Ratio
Active
$1,800,000
3
bds
|
4
ba
|
1,451
sqft
|
built
1925
161 NW 35th St, Miami, FL 33127
$-7,760
Cash flow
-22.5%
Cash-on-Cash Return
1.0%
Cap rate
0.3%
Rent to Value Ratio
Active
$617,500
3
bds
|
2
ba
|
1,280
sqft
|
built
1950
810 NW 43rd St, Miami, FL 33127
$-1,326
Cash flow
-11.2%
Cash-on-Cash Return
3.6%
Cap rate
0.6%
Rent to Value Ratio
Active
$765,000
2
bds
|
1
ba
|
984
sqft
|
built
1937
260 NW 34th St, Miami, FL 33127
$-953
Cash flow
-6.5%
Cash-on-Cash Return
4.7%
Cap rate
0.6%
Rent to Value Ratio
Active
$1,725,000
5
bds
|
3
ba
|
2,017
sqft
|
built
2022
520 NW 41st St, Miami, FL 33127
$-3,448
Cash flow
-10.4%
Cash-on-Cash Return
3.7%
Cap rate
0.6%
Rent to Value Ratio

Active
$939,000
4
bds
|
3
ba
|
1,344
sqft
|
built
1951
510 NW 43rd St, Miami, FL 33127
$-1,740
Cash flow
-9.7%
Cash-on-Cash Return
3.9%
Cap rate
0.6%
Rent to Value Ratio
Active
$659,000
2
bds
|
1
ba
|
2,128
sqft
|
built
1937
1143 NW 27th St, Miami, FL 33127
$-1,812
Cash flow
-14.3%
Cash-on-Cash Return
2.8%
Cap rate
0.5%
Rent to Value Ratio

Active
$765,000
4
bds
|
2
ba
|
1,057
sqft
|
built
1951
280 NW 51st St, Miami, FL 33127
$-1,904
Cash flow
-13.0%
Cash-on-Cash Return
3.2%
Cap rate
0.5%
Rent to Value Ratio
Active
$875,000
5
bds
|
3
ba
|
1,572
sqft
|
built
1949
530 NW 53rd St, Miami, FL 33127
$-2,713
Cash flow
-16.2%
Cash-on-Cash Return
2.4%
Cap rate
0.4%
Rent to Value Ratio
Active
$1,150,000
6
bds
|
0
ba
|
2,723
sqft
|
built
2008
415 NW 52nd St, Miami, FL 33127
$-4,598
Cash flow
-20.9%
Cash-on-Cash Return
1.3%
Cap rate
0.3%
Rent to Value Ratio
Active
$2,000,000
3
bds
|
0
ba
|
1,378
sqft
|
built
1957
3181 NW 5th Ave, Miami, FL 33127
$-9,340
Cash flow
-24.4%
Cash-on-Cash Return
0.5%
Cap rate
0.1%
Rent to Value Ratio