33133 Investment Properties for Sale
Browse homes for sale and investment properties in 33133. Refine your search by price, property type, or more.
Best cash flowing properties in 33133
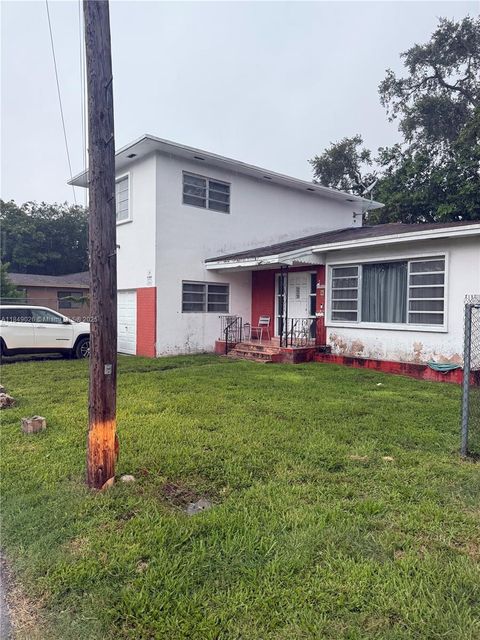
Active
$315,000
1
bds
|
1
ba
|
756
sqft
|
built
2002
2665 SW 37th Ave, Miami, FL 33133
$-959
Cash flow
-15.9%
Cash-on-Cash Return
2.5%
Cap rate
0.7%
Rent to Value Ratio
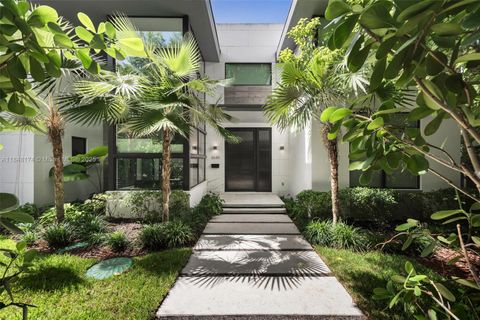
Active
$1,418,000
4
bds
|
5
ba
|
5,226
sqft
|
built
2023
3617 SW 27th St, Miami, FL 33133
$-982
Cash flow
-3.6%
Cash-on-Cash Return
5.3%
Cap rate
0.8%
Rent to Value Ratio
175 out of 240 properties for sale in 33133
Limited Results Shown
Create a free account, or log in to reveal all property listings and enjoy the complete experience.
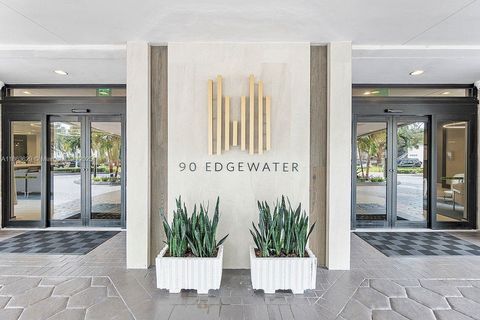
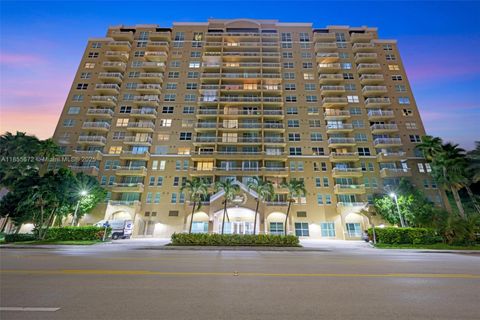
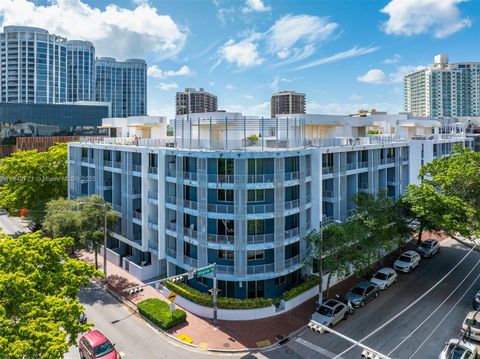
Active
$499,000
1
bds
|
2
ba
|
910
sqft
|
built
1969
90 Edgewater Dr, Coral Gables, FL 33133
$-2,067
Cash flow
-21.6%
Cash-on-Cash Return
1.2%
Cap rate
0.6%
Rent to Value Ratio
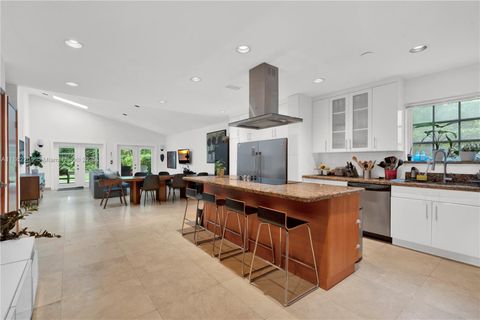
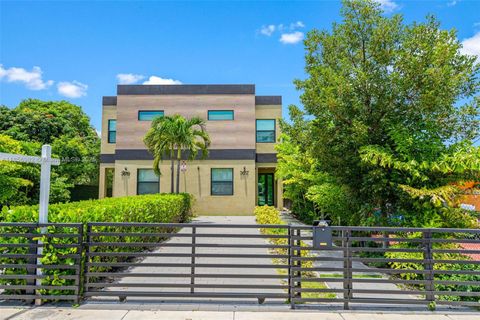
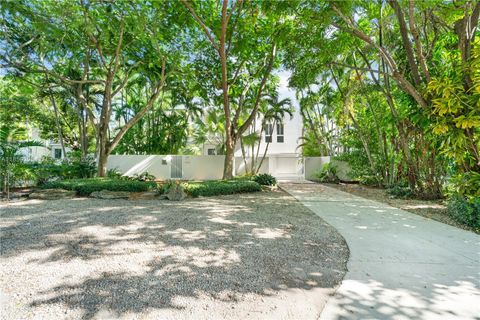
Active
$2,200,000
4
bds
|
4
ba
|
0
sqft
|
built
1960
3730 Kumquat Ave, Miami, FL 33133
$-8,018
Cash flow
-19.0%
Cash-on-Cash Return
1.8%
Cap rate
0.3%
Rent to Value Ratio
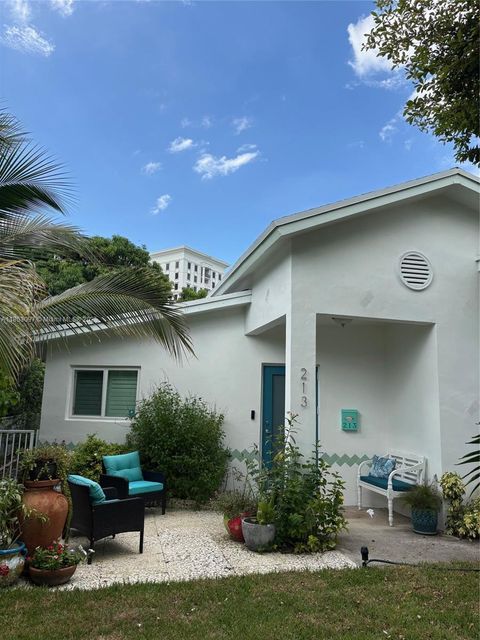
Active
$1,050,000
3
bds
|
2
ba
|
1,338
sqft
|
built
1990
213 Florida Ave, Coral Gables, FL 33133
$-1,947
Cash flow
-9.7%
Cash-on-Cash Return
3.9%
Cap rate
0.5%
Rent to Value Ratio
Active
$2,580,000
2
bds
|
3
ba
|
2,570
sqft
|
built
1996
10 Edgewater Dr, Coral Gables, FL 33133
$-14,674
Cash flow
-29.7%
Cash-on-Cash Return
-0.7%
Cap rate
0.3%
Rent to Value Ratio
Active
$2,450,000
3
bds
|
4
ba
|
2,240
sqft
|
built
1996
2645 S Bayshore Dr, Miami, FL 33133
$-11,063
Cash flow
-23.6%
Cash-on-Cash Return
0.7%
Cap rate
0.4%
Rent to Value Ratio
Active
$5,390,000
5
bds
|
6
ba
|
5,212
sqft
|
built
1971
144 N Prospect Dr, Coral Gables, FL 33133
$-25,337
Cash flow
-24.5%
Cash-on-Cash Return
0.5%
Cap rate
0.2%
Rent to Value Ratio
Active
$380,000
1
bds
|
1
ba
|
613
sqft
|
built
2006
2740 SW 28th Ter, Miami, FL 33133
$-1,287
Cash flow
-17.7%
Cash-on-Cash Return
2.1%
Cap rate
0.6%
Rent to Value Ratio
Active
$2,625,000
3
bds
|
4
ba
|
2,960
sqft
|
built
2003
60 Edgewater Dr, Coral Gables, FL 33133
$-13,273
Cash flow
-26.4%
Cash-on-Cash Return
0.1%
Cap rate
0.3%
Rent to Value Ratio
Active
$975,000
2
bds
|
4
ba
|
1,425
sqft
|
built
2006
3204 Bird Ave, Miami, FL 33133
$-3,416
Cash flow
-18.3%
Cash-on-Cash Return
1.9%
Cap rate
0.5%
Rent to Value Ratio
Active
$405,000
1
bds
|
1
ba
|
616
sqft
|
built
1970
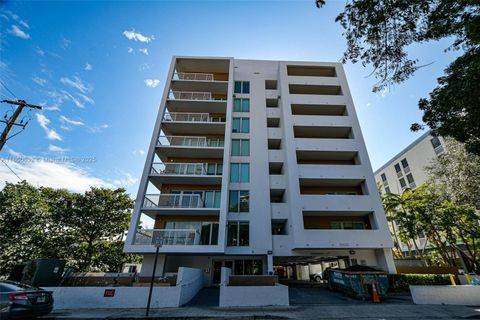
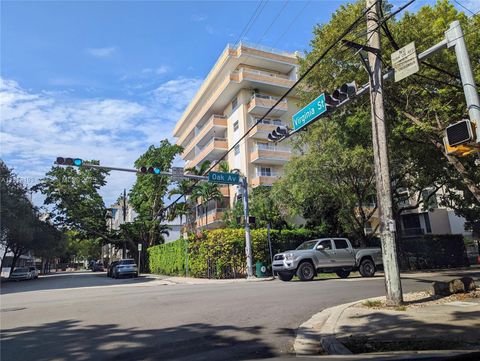
3304 Virginia St, Miami, FL 33133
$-1,438
Cash flow
-18.5%
Cash-on-Cash Return
1.9%
Cap rate
0.6%
Rent to Value Ratio
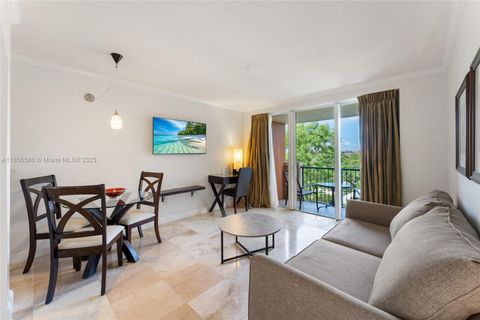
Active
$589,000
1
bds
|
1
ba
|
710
sqft
|
built
1998
2951 S Bayshore Dr, Miami, FL 33133
$-2,765
Cash flow
-24.5%
Cash-on-Cash Return
0.5%
Cap rate
0.5%
Rent to Value Ratio
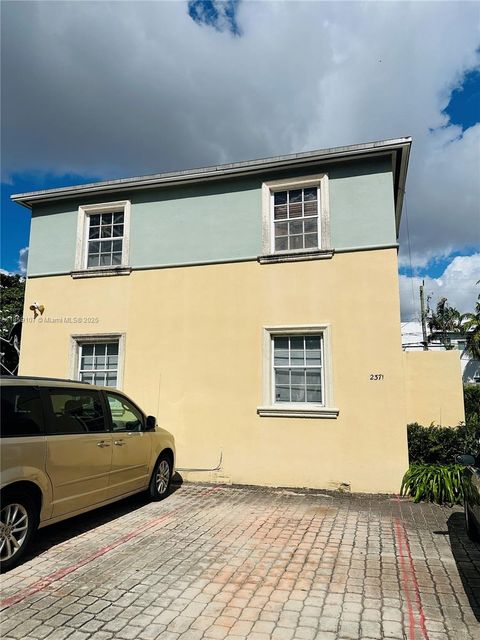
Active
$1,750,000
8
bds
|
0
ba
|
3,066
sqft
|
built
1946
2371 SW 27th St, Miami, FL 33133
$-7,757
Cash flow
-23.1%
Cash-on-Cash Return
0.8%
Cap rate
0.2%
Rent to Value Ratio

Active
$420,000
2
bds
|
1
ba
|
843
sqft
|
built
2006
2740 SW 28th Ter, Miami, FL 33133
$-1,779
Cash flow
-22.1%
Cash-on-Cash Return
1.1%
Cap rate
0.6%
Rent to Value Ratio
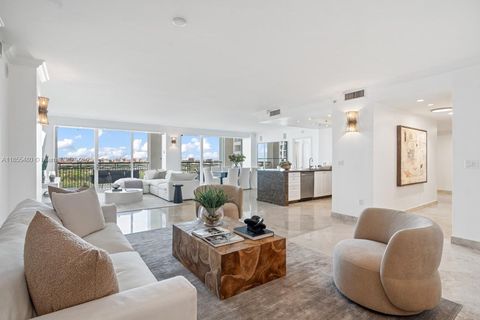
Active
$2,999,000
2
bds
|
3
ba
|
2,114
sqft
|
built
2001
3400 SW 27th Ave, Miami, FL 33133
$-14,288
Cash flow
-24.9%
Cash-on-Cash Return
0.4%
Cap rate
0.3%
Rent to Value Ratio
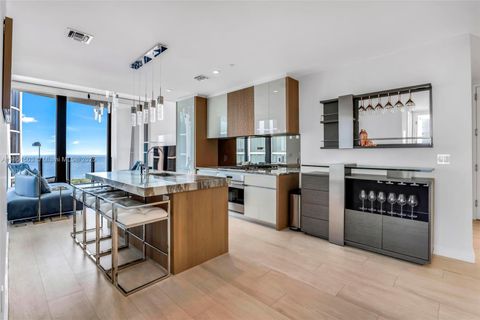
Active
$1,725,000
2
bds
|
2
ba
|
978
sqft
|
built
2018
2831 S Bayshore Dr, Miami, FL 33133
$-8,739
Cash flow
-26.4%
Cash-on-Cash Return
0.1%
Cap rate
0.4%
Rent to Value Ratio
Active
$1,200,000
6
bds
|
0
ba
|
3,630
sqft
|
built
1952
3411 SW 27th St, Miami, FL 33133
$-5,132
Cash flow
-22.3%
Cash-on-Cash Return
1.0%
Cap rate
0.3%
Rent to Value Ratio
Active
$2,699,000
1
bds
|
0
ba
|
2,819
sqft
|
built
1938
3586 Main Hwy, Miami, FL 33133
$-12,022
Cash flow
-23.2%
Cash-on-Cash Return
0.8%
Cap rate
0.2%
Rent to Value Ratio
Active
$680,000
2
bds
|
3
ba
|
876
sqft
|
built
1981
3218 W Trade Ave, Miami, FL 33133
$-2,005
Cash flow
-15.4%
Cash-on-Cash Return
2.6%
Cap rate
0.5%
Rent to Value Ratio
Active
$500,000
2
bds
|
1
ba
|
862
sqft
|
built
1937
3748 Washington Ave, Miami, FL 33133
$-1,321
Cash flow
-13.8%
Cash-on-Cash Return
3.0%
Cap rate
0.5%
Rent to Value Ratio
Active
$3,400,000
3
bds
|
3
ba
|
2,656
sqft
|
built
2008
4050 Hardie Ave, Miami, FL 33133
$-14,069
Cash flow
-21.6%
Cash-on-Cash Return
1.2%
Cap rate
0.3%
Rent to Value Ratio
Active
$575,000
1
bds
|
2
ba
|
851
sqft
|
built
2007
3339 Virginia St, Miami, FL 33133
$-1,335
Cash flow
-12.1%
Cash-on-Cash Return
3.4%
Cap rate
0.5%
Rent to Value Ratio
Active
$3,300,000
4
bds
|
5
ba
|
2,934
sqft
|
built
2019
3648 Loquat Ave, Miami, FL 33133
$-12,753
Cash flow
-20.2%
Cash-on-Cash Return
1.5%
Cap rate
0.3%
Rent to Value Ratio
Active
$1,300,000
3
bds
|
2
ba
|
1,681
sqft
|
built
1960
3753 Washington Ave, Miami, FL 33133
$-4,674
Cash flow
-18.8%
Cash-on-Cash Return
1.8%
Cap rate
0.3%
Rent to Value Ratio
Active
$4,200,000
3
bds
|
3
ba
|
2,469
sqft
|
built
2016
3175 Washington St, Miami, FL 33133
$-17,409
Cash flow
-21.6%
Cash-on-Cash Return
1.2%
Cap rate
0.2%
Rent to Value Ratio
Active
$1,490,000
5
bds
|
5
ba
|
2,900
sqft
|
built
1978
2710 SW 31st Ave, Miami, FL 33133
$-3,297
Cash flow
-11.5%
Cash-on-Cash Return
3.5%
Cap rate
0.5%
Rent to Value Ratio
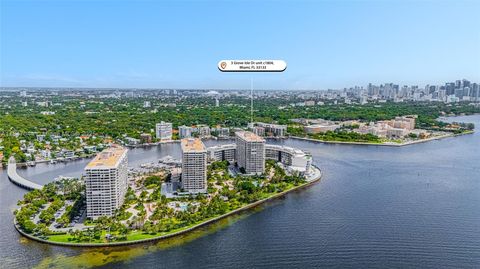
Active
$1,799,000
2
bds
|
2
ba
|
1,882
sqft
|
built
1981
3 Grove Isle Dr, Miami, FL 33133
$-7,734
Cash flow
-22.4%
Cash-on-Cash Return
1.0%
Cap rate
0.4%
Rent to Value Ratio
Active
$365,000
1
bds
|
1
ba
|
694
sqft
|
built
2002
2665 SW 37th Ave, Miami, FL 33133
$-1,199
Cash flow
-17.1%
Cash-on-Cash Return
2.2%
Cap rate
0.7%
Rent to Value Ratio
Active
$3,995,000
4
bds
|
4
ba
|
3,751
sqft
|
built
2015
4048 Malaga Ave, Miami, FL 33133
$-15,845
Cash flow
-20.7%
Cash-on-Cash Return
1.4%
Cap rate
0.2%
Rent to Value Ratio
Active
$5,100,000
4
bds
|
5
ba
|
4,000
sqft
|
built
2016
4061 Matheson Ave, Miami, FL 33133
$-22,692
Cash flow
-23.2%
Cash-on-Cash Return
0.8%
Cap rate
0.2%
Rent to Value Ratio
Active
$2,495,000
4
bds
|
0
ba
|
5,000
sqft
|
built
2020
2887 SW 33rd Ave, Miami, FL 33133
$-9,952
Cash flow
-20.8%
Cash-on-Cash Return
1.4%
Cap rate
0.3%
Rent to Value Ratio
Active
$699,000
2
bds
|
2
ba
|
1,080
sqft
|
built
1998
2850 Coconut Ave, Miami, FL 33133
$-2,458
Cash flow
-18.3%
Cash-on-Cash Return
1.9%
Cap rate
0.5%
Rent to Value Ratio
Active
$1,100,000
3
bds
|
2
ba
|
1,380
sqft
|
built
1992
3651 William Ave, Miami, FL 33133
$-4,058
Cash flow
-19.2%
Cash-on-Cash Return
1.7%
Cap rate
0.3%
Rent to Value Ratio
Active
$3,399,000
5
bds
|
6
ba
|
4,035
sqft
|
built
1984
2000 S Bayshore Dr, Miami, FL 33133
$-16,855
Cash flow
-25.9%
Cash-on-Cash Return
0.2%
Cap rate
0.2%
Rent to Value Ratio
Active
$1,750,000
3
bds
|
5
ba
|
2,574
sqft
|
built
2023
3162 Plaza St, Miami, FL 33133
$-4,930
Cash flow
-14.7%
Cash-on-Cash Return
2.8%
Cap rate
0.5%
Rent to Value Ratio
Active
$1,750,000
3
bds
|
5
ba
|
2,574
sqft
|
built
2023
3164 Plaza St, Miami, FL 33133
$-4,487
Cash flow
-13.4%
Cash-on-Cash Return
3.1%
Cap rate
0.5%
Rent to Value Ratio
Active
$699,000
1
bds
|
2
ba
|
767
sqft
|
built
2001
2889 Mc Farlane Rd, Miami, FL 33133
$-2,682
Cash flow
-20.0%
Cash-on-Cash Return
1.5%
Cap rate
0.7%
Rent to Value Ratio
Active
$1,200,000
3
bds
|
2
ba
|
1,560
sqft
|
built
1974
3165 Jackson Ave, Miami, FL 33133
$-3,523
Cash flow
-15.3%
Cash-on-Cash Return
2.6%
Cap rate
0.4%
Rent to Value Ratio
Active
$1,299,000
2
bds
|
2
ba
|
1,098
sqft
|
built
2001
2889 Mc Farlane Rd, Miami, FL 33133
$-5,853
Cash flow
-23.5%
Cash-on-Cash Return
0.7%
Cap rate
0.5%
Rent to Value Ratio