33133 Investment Properties for Sale
Browse homes for sale and investment properties in 33133. Refine your search by price, property type, or more.
Best cash flowing properties in 33133
Active
$225,000
1
bds
|
1
ba
|
467
sqft
|
built
1953
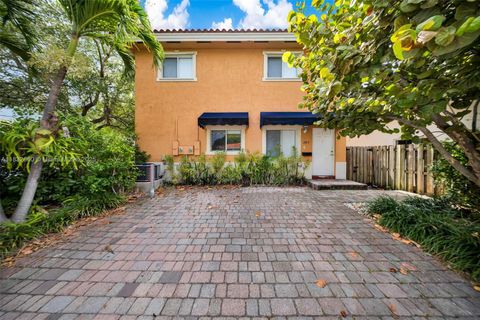
3615 Thomas Ave, Miami, FL 33133
$-414
Cash flow
-9.6%
Cash-on-Cash Return
3.9%
Cap rate
0.7%
Rent to Value Ratio
Active
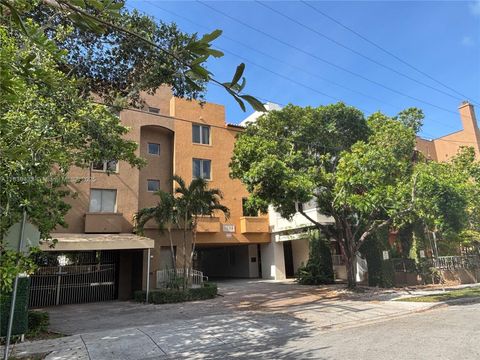
$269,000
1
bds
|
1
ba
|
362
sqft
|
built
1997
3051 SW 27th Ave, Miami, FL 33133
$-635
Cash flow
-12.3%
Cash-on-Cash Return
3.3%
Cap rate
0.7%
Rent to Value Ratio
175 out of 240 properties for sale in 33133
Limited Results Shown
Create a free account, or log in to reveal all property listings and enjoy the complete experience.
Active
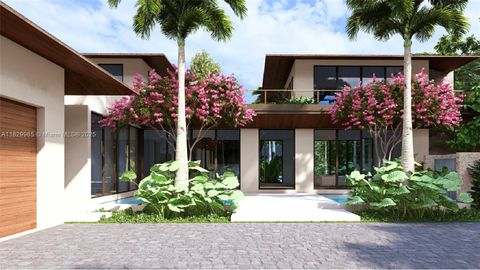
$282,000
1
bds
|
1
ba
|
574
sqft
|
built
1966
2924 Day Ave, Miami, FL 33133
$-1,163
Cash flow
-21.5%
Cash-on-Cash Return
1.2%
Cap rate
0.7%
Rent to Value Ratio
Active
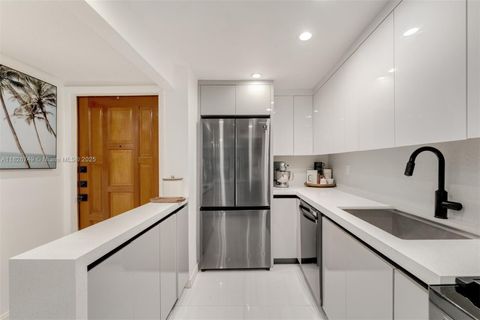
$2,495,000
3
bds
|
3
ba
|
2,121
sqft
|
built
1956
160 W Sunrise Ave, Coral Gables, FL 33133
$-8,233
Cash flow
-17.2%
Cash-on-Cash Return
2.2%
Cap rate
0.4%
Rent to Value Ratio
Active
$395,000
2
bds
|
1
ba
|
702
sqft
|
built
1972
2920 SW 28th Ter, Miami, FL 33133
$-1,013
Cash flow
-13.4%
Cash-on-Cash Return
3.1%
Cap rate
0.7%
Rent to Value Ratio
Active
$899,000
2
bds
|
3
ba
|
1,050
sqft
|
built
2004
2919 Coconut Ave, Miami, FL 33133
$-2,649
Cash flow
-15.4%
Cash-on-Cash Return
2.6%
Cap rate
0.5%
Rent to Value Ratio
Active
$1,579,000
2
bds
|
2
ba
|
1,281
sqft
|
built
1950
2665 SW 17th Ave, Miami, FL 33133
$-4,183
Cash flow
-13.8%
Cash-on-Cash Return
3.0%
Cap rate
0.4%
Rent to Value Ratio
Active
$1,990,000
4
bds
|
0
ba
|
1,492
sqft
|
built
1948
3210 Elizabeth St, Miami, FL 33133
$-8,678
Cash flow
-22.8%
Cash-on-Cash Return
0.9%
Cap rate
0.2%
Rent to Value Ratio
Active
$3,775,000
3
bds
|
3
ba
|
2,385
sqft
|
built
1951
3570 Avocado Ave, Miami, FL 33133
$-13,945
Cash flow
-19.3%
Cash-on-Cash Return
1.7%
Cap rate
0.2%
Rent to Value Ratio
Active
$985,000
5
bds
|
5
ba
|
2,056
sqft
|
built
1953
2761 SW 33rd Ct, Miami, FL 33133
$-2,618
Cash flow
-13.9%
Cash-on-Cash Return
3.0%
Cap rate
0.4%
Rent to Value Ratio
Active
$1,800,000
2
bds
|
2
ba
|
1,395
sqft
|
built
1946
4050 Loquat Ave, Miami, FL 33133
$-7,115
Cash flow
-20.6%
Cash-on-Cash Return
1.4%
Cap rate
0.3%
Rent to Value Ratio
Active
$1,100,000
2
bds
|
2
ba
|
1,310
sqft
|
built
1970
1600 S Bayshore Ln, Miami, FL 33133
$-4,524
Cash flow
-21.5%
Cash-on-Cash Return
1.2%
Cap rate
0.4%
Rent to Value Ratio
Active
$12,900,000
4
bds
|
5
ba
|
2,945
sqft
|
built
1951
3540 N Moorings Way, Miami, FL 33133
$-63,239
Cash flow
-25.6%
Cash-on-Cash Return
0.3%
Cap rate
0.1%
Rent to Value Ratio
Active
$4,995,000
2
bds
|
3
ba
|
2,936
sqft
|
built
2020
3910 Battersea Rd, Miami, FL 33133
$-22,668
Cash flow
-23.7%
Cash-on-Cash Return
0.7%
Cap rate
0.1%
Rent to Value Ratio
Active
$270,000
1
bds
|
1
ba
|
467
sqft
|
built
1953
3615 Thomas Ave, Miami, FL 33133
$-803
Cash flow
-15.5%
Cash-on-Cash Return
2.6%
Cap rate
0.6%
Rent to Value Ratio
Active
$290,000
1
bds
|
1
ba
|
595
sqft
|
built
1966
2930 Day Ave, Miami, FL 33133
$-856
Cash flow
-15.4%
Cash-on-Cash Return
2.6%
Cap rate
0.8%
Rent to Value Ratio
Active
$2,650,000
3
bds
|
3
ba
|
2,424
sqft
|
built
1980
2 Grove Isle Dr, Miami, FL 33133
$-8,042
Cash flow
-15.8%
Cash-on-Cash Return
2.5%
Cap rate
0.4%
Rent to Value Ratio
Active
$949,000
2
bds
|
1
ba
|
1,648
sqft
|
built
1951
2145 SW 26th St, Miami, FL 33133
$-2,465
Cash flow
-13.6%
Cash-on-Cash Return
3.0%
Cap rate
0.4%
Rent to Value Ratio
Active
$5,775,000
4
bds
|
5
ba
|
4,546
sqft
|
built
1987
3520 Rockerman Rd, Miami, FL 33133
$-29,036
Cash flow
-26.2%
Cash-on-Cash Return
0.1%
Cap rate
0.1%
Rent to Value Ratio
Active
$1,149,000
4
bds
|
0
ba
|
2,492
sqft
|
built
1966
2815 SW 36th Ave, Miami, FL 33133
$-4,080
Cash flow
-18.5%
Cash-on-Cash Return
1.9%
Cap rate
0.3%
Rent to Value Ratio
Active
$649,900
3
bds
|
3
ba
|
1,346
sqft
|
built
2005
2814 SW 27th St, Miami, FL 33133
$-1,393
Cash flow
-11.2%
Cash-on-Cash Return
3.6%
Cap rate
0.6%
Rent to Value Ratio
Active
$328,000
1
bds
|
1
ba
|
689
sqft
|
built
2004
2630 SW 28th St, Miami, FL 33133
$-1,015
Cash flow
-16.1%
Cash-on-Cash Return
2.4%
Cap rate
0.7%
Rent to Value Ratio
Active
$7,500,000
7
bds
|
10
ba
|
7,427
sqft
|
built
2025
3803 Little Ave, Miami, FL 33133
$-40,755
Cash flow
-28.4%
Cash-on-Cash Return
-0.4%
Cap rate
0.1%
Rent to Value Ratio
Active
$760,000
2
bds
|
3
ba
|
876
sqft
|
built
1981
3214 W Trade Ave, Miami, FL 33133
$-2,538
Cash flow
-17.4%
Cash-on-Cash Return
2.1%
Cap rate
0.4%
Rent to Value Ratio
Active
$1,095,000
3
bds
|
4
ba
|
1,425
sqft
|
built
2006
3204 Bird Ave, Miami, FL 33133
$-2,979
Cash flow
-14.2%
Cash-on-Cash Return
2.9%
Cap rate
0.5%
Rent to Value Ratio
Active
$4,300,000
7
bds
|
7
ba
|
6,017
sqft
|
built
2006
1606 S Bayshore Dr, Miami, FL 33133
$-21,099
Cash flow
-25.6%
Cash-on-Cash Return
0.3%
Cap rate
0.2%
Rent to Value Ratio
Active
$890,000
3
bds
|
3
ba
|
1,480
sqft
|
built
1994
3136 Virginia St, Miami, FL 33133
$-2,779
Cash flow
-16.3%
Cash-on-Cash Return
2.4%
Cap rate
0.6%
Rent to Value Ratio
Active
$1,185,000
2
bds
|
2
ba
|
1,642
sqft
|
built
1981
3 Grove Isle Dr, Miami, FL 33133
$-6,323
Cash flow
-27.8%
Cash-on-Cash Return
-0.3%
Cap rate
0.4%
Rent to Value Ratio
Active
$1,899,000
3
bds
|
2
ba
|
1,809
sqft
|
built
1959
3865 Poinciana Ave, Miami, FL 33133
$-6,475
Cash flow
-17.8%
Cash-on-Cash Return
2.1%
Cap rate
0.3%
Rent to Value Ratio
Active
$3,500,000
3
bds
|
4
ba
|
2,022
sqft
|
built
2016
2675 S Bayshore Dr, Miami, FL 33133
$-18,112
Cash flow
-27.0%
Cash-on-Cash Return
-0.1%
Cap rate
0.3%
Rent to Value Ratio
Active
$1,575,000
2
bds
|
2
ba
|
1,882
sqft
|
built
1981
3 Grove Isle Dr, Miami, FL 33133
$-5,406
Cash flow
-17.9%
Cash-on-Cash Return
2.0%
Cap rate
0.4%
Rent to Value Ratio
Active
$699,000
1
bds
|
2
ba
|
747
sqft
|
built
2001
2889 Mc Farlane Rd, Miami, FL 33133
$-3,374
Cash flow
-25.2%
Cash-on-Cash Return
0.4%
Cap rate
0.6%
Rent to Value Ratio
Active
$255,000
1
bds
|
1
ba
|
611
sqft
|
built
1971
1800 SW 25th St, Miami, FL 33133
$-738
Cash flow
-15.1%
Cash-on-Cash Return
2.7%
Cap rate
0.7%
Rent to Value Ratio
Active
$550,000
1
bds
|
1
ba
|
650
sqft
|
built
1998
2951 S Bayshore Dr, Miami, FL 33133
$-1,820
Cash flow
-17.3%
Cash-on-Cash Return
2.2%
Cap rate
0.6%
Rent to Value Ratio
Active
$725,000
2
bds
|
1
ba
|
896
sqft
|
built
1924
3422 SW 25th St, Miami, FL 33133
$-1,703
Cash flow
-12.3%
Cash-on-Cash Return
3.3%
Cap rate
0.5%
Rent to Value Ratio
Active
$3,295,000
5
bds
|
4
ba
|
3,725
sqft
|
built
1981
2000 S Bayshore Dr, Miami, FL 33133
$-15,843
Cash flow
-25.1%
Cash-on-Cash Return
0.4%
Cap rate
0.2%
Rent to Value Ratio
Active
$1,900,000
4
bds
|
3
ba
|
1,949
sqft
|
built
1955
4190 Pamona Ave, Miami, FL 33133
$-4,237
Cash flow
-11.6%
Cash-on-Cash Return
3.5%
Cap rate
0.5%
Rent to Value Ratio
Active
$1,799,000
3
bds
|
3
ba
|
2,577
sqft
|
built
2014
3318 Day Ave, Miami, FL 33133
$-5,519
Cash flow
-16.0%
Cash-on-Cash Return
2.5%
Cap rate
0.5%
Rent to Value Ratio
Active
$384,731
1
bds
|
2
ba
|
700
sqft
|
built
1973
3025 Mary St, Miami, FL 33133
$-810
Cash flow
-11.0%
Cash-on-Cash Return
3.6%
Cap rate
0.7%
Rent to Value Ratio
Active
$725,000
3
bds
|
2
ba
|
1,263
sqft
|
built
1940
3685 SW 26th St, Miami, FL 33133
$-1,186
Cash flow
-8.5%
Cash-on-Cash Return
4.2%
Cap rate
0.5%
Rent to Value Ratio