33137 Investment Properties for Sale
Browse homes for sale and investment properties in 33137. Refine your search by price, property type, or more.
Best cash flowing properties in 33137

Active
$355,000
1
bds
|
1
ba
|
560
sqft
|
built
2018
321 NE 26th St, Miami, FL 33137
$-57
Cash flow
-0.8%
Cash-on-Cash Return
6.0%
Cap rate
0.9%
Rent to Value Ratio
Active
$689,000
2
bds
|
3
ba
|
1,158
sqft
|
built
2005
601 NE 36th St, Miami, FL 33137
$-1,027
Cash flow
-7.8%
Cash-on-Cash Return
4.4%
Cap rate
0.6%
Rent to Value Ratio
445 out of 477 properties for sale in 33137
Limited Results Shown
Create a free account, or log in to reveal all property listings and enjoy the complete experience.
Active
$1,950,000
3
bds
|
4
ba
|
1,868
sqft
|
built
2017
2900 NE 7th Ave, Miami, FL 33137
$-9,380
Cash flow
-25.1%
Cash-on-Cash Return
0.4%
Cap rate
0.5%
Rent to Value Ratio
Active
$863,999
2
bds
|
3
ba
|
1,449
sqft
|
built
2005
601 NE 36th St, Miami, FL 33137
$-3,622
Cash flow
-21.9%
Cash-on-Cash Return
1.1%
Cap rate
0.7%
Rent to Value Ratio
Active
$2,250,000
4
bds
|
2
ba
|
2,298
sqft
|
built
1924
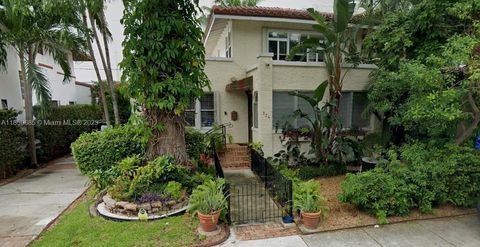
334 NE 26th Ter, Miami, FL 33137
$-5,309
Cash flow
-12.3%
Cash-on-Cash Return
3.3%
Cap rate
0.4%
Rent to Value Ratio
Active
$935,000
2
bds
|
2
ba
|
1,067
sqft
|
built
2018
650 NE 32nd St, Miami, FL 33137
$-2,938
Cash flow
-16.4%
Cash-on-Cash Return
2.4%
Cap rate
0.5%
Rent to Value Ratio
Active
$671,900
2
bds
|
2
ba
|
1,084
sqft
|
built
2018
501 NE 31st St, Miami, FL 33137
$-2,117
Cash flow
-16.4%
Cash-on-Cash Return
2.4%
Cap rate
0.7%
Rent to Value Ratio
Active
$550,000
2
bds
|
2
ba
|
848
sqft
|
built
2018
481 NE 29th St, Miami, FL 33137
$-1,865
Cash flow
-17.7%
Cash-on-Cash Return
2.1%
Cap rate
0.6%
Rent to Value Ratio

Active
$1,444,444
4
bds
|
4
ba
|
0
sqft
|
built
2025
5934 NE 4th Ct, Miami, FL 33137
$-7,462
Cash flow
-27.0%
Cash-on-Cash Return
-0.1%
Cap rate
0.1%
Rent to Value Ratio
Active
$600,000
2
bds
|
3
ba
|
1,174
sqft
|
built
2005
601 NE 36th St, Miami, FL 33137
$-1,851
Cash flow
-16.1%
Cash-on-Cash Return
2.4%
Cap rate
0.8%
Rent to Value Ratio

Active
$689,000
2
bds
|
2
ba
|
1,062
sqft
|
built
2015
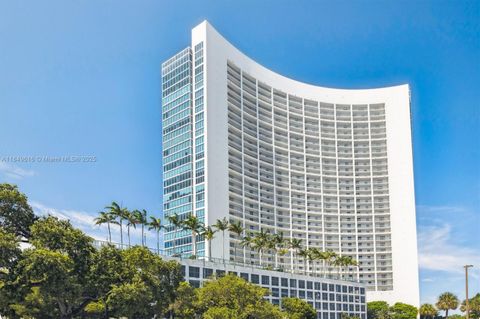
4250 Biscayne Blvd, Miami, FL 33137
$-2,878
Cash flow
-21.8%
Cash-on-Cash Return
1.1%
Cap rate
0.7%
Rent to Value Ratio

Active
$2,950,000
3
bds
|
5
ba
|
2,368
sqft
|
built
2023
700 NE 26th Ter, Miami, FL 33137
$-14,703
Cash flow
-26.0%
Cash-on-Cash Return
0.2%
Cap rate
0.3%
Rent to Value Ratio

Active
$495,000
1
bds
|
2
ba
|
890
sqft
|
built
2007
480 NE 30th St, Miami, FL 33137
$-1,654
Cash flow
-17.4%
Cash-on-Cash Return
2.1%
Cap rate
0.6%
Rent to Value Ratio

Active
$1,050,000
2
bds
|
3
ba
|
1,137
sqft
|
built
2017
2900 NE 7th Ave, Miami, FL 33137
$-3,556
Cash flow
-17.7%
Cash-on-Cash Return
2.1%
Cap rate
0.7%
Rent to Value Ratio
Active
$24,900,000
6
bds
|
7
ba
|
5,715
sqft
|
built
2024
4241 Palm Ln, Miami, FL 33137
$-134,073
Cash flow
-28.1%
Cash-on-Cash Return
-0.3%
Cap rate
0.0%
Rent to Value Ratio

Active
$580,000
1
bds
|
1
ba
|
681
sqft
|
built
2018
121 NE 34th St, Miami, FL 33137
$-2,097
Cash flow
-18.9%
Cash-on-Cash Return
1.8%
Cap rate
0.7%
Rent to Value Ratio

Active
$679,900
1
bds
|
2
ba
|
706
sqft
|
built
2018
650 NE 32nd St, Miami, FL 33137
$-2,025
Cash flow
-15.5%
Cash-on-Cash Return
2.6%
Cap rate
0.6%
Rent to Value Ratio

Active
$2,056,000
3
bds
|
3
ba
|
2,236
sqft
|
built
2018
455 NE 39th St, Miami, FL 33137
$-4,795
Cash flow
-12.2%
Cash-on-Cash Return
3.3%
Cap rate
0.5%
Rent to Value Ratio

Active
$1,249,000
2
bds
|
3
ba
|
1,870
sqft
|
built
2005
601 NE 36th St, Miami, FL 33137
$-5,394
Cash flow
-22.5%
Cash-on-Cash Return
1.0%
Cap rate
0.6%
Rent to Value Ratio

Active
$1,369,000
3
bds
|
2
ba
|
1,408
sqft
|
built
1946
5981 NE 6th Ave, Miami, FL 33137
$-4,868
Cash flow
-18.6%
Cash-on-Cash Return
1.9%
Cap rate
0.5%
Rent to Value Ratio

Active
$1,250,000
2
bds
|
3
ba
|
1,151
sqft
|
built
2018
650 NE 32nd St, Miami, FL 33137
$-1,451
Cash flow
-6.1%
Cash-on-Cash Return
4.8%
Cap rate
0.9%
Rent to Value Ratio

Active
$985,000
2
bds
|
2
ba
|
1,067
sqft
|
built
2018
650 NE 32nd St, Miami, FL 33137
$-3,302
Cash flow
-17.5%
Cash-on-Cash Return
2.1%
Cap rate
0.6%
Rent to Value Ratio

Active
$499,000
2
bds
|
2
ba
|
1,054
sqft
|
built
2004
2000 N Bayshore Dr, Miami, FL 33137
$-1,669
Cash flow
-17.5%
Cash-on-Cash Return
2.1%
Cap rate
0.7%
Rent to Value Ratio

Active
$998,000
2
bds
|
2
ba
|
1,067
sqft
|
built
2018
650 NE 32nd St, Miami, FL 33137
$-3,380
Cash flow
-17.7%
Cash-on-Cash Return
2.1%
Cap rate
0.6%
Rent to Value Ratio

Active
$625,000
2
bds
|
3
ba
|
1,158
sqft
|
built
2005
601 NE 36th St, Miami, FL 33137
$-2,139
Cash flow
-17.9%
Cash-on-Cash Return
2.0%
Cap rate
0.8%
Rent to Value Ratio

Active
$725,000
2
bds
|
2
ba
|
1,048
sqft
|
built
2019
3900 Biscayne Blvd, Miami, FL 33137
$-2,157
Cash flow
-15.5%
Cash-on-Cash Return
2.6%
Cap rate
0.8%
Rent to Value Ratio

Active
$620,000
1
bds
|
1
ba
|
1,164
sqft
|
built
2007
3250 NE 1st Ave, Miami, FL 33137
$-2,969
Cash flow
-25.0%
Cash-on-Cash Return
0.4%
Cap rate
0.6%
Rent to Value Ratio

Active
$4,575,000
5
bds
|
5
ba
|
3,146
sqft
|
built
1925
484 NE 57th St, Miami, FL 33137
$-18,095
Cash flow
-20.6%
Cash-on-Cash Return
1.4%
Cap rate
0.2%
Rent to Value Ratio

Active
$4,350,000
3
bds
|
4
ba
|
2,720
sqft
|
built
2021
788 NE 23rd St, Miami, FL 33137
$-24,257
Cash flow
-29.1%
Cash-on-Cash Return
-0.5%
Cap rate
0.2%
Rent to Value Ratio

Active
$480,000
1
bds
|
2
ba
|
761
sqft
|
built
2008
3301 NE 1st Ave, Miami, FL 33137
$-1,779
Cash flow
-19.3%
Cash-on-Cash Return
1.7%
Cap rate
0.7%
Rent to Value Ratio

Active
$750,000
1
bds
|
2
ba
|
1,014
sqft
|
built
2017
2900 NE 7th Ave, Miami, FL 33137
$-1,437
Cash flow
-10.0%
Cash-on-Cash Return
3.8%
Cap rate
0.7%
Rent to Value Ratio

Active
$459,900
2
bds
|
2
ba
|
948
sqft
|
built
2008
350 NE 24th St, Miami, FL 33137
$-1,900
Cash flow
-21.6%
Cash-on-Cash Return
1.2%
Cap rate
0.7%
Rent to Value Ratio
Active
$3,150,000
4
bds
|
4
ba
|
3,077
sqft
|
built
1924
671 NE 57th St, Miami, FL 33137
$-12,144
Cash flow
-20.1%
Cash-on-Cash Return
1.5%
Cap rate
0.3%
Rent to Value Ratio

Active
$700,000
2
bds
|
2
ba
|
1,143
sqft
|
built
2015
460 NE 28th St, Miami, FL 33137
$-2,862
Cash flow
-21.3%
Cash-on-Cash Return
1.2%
Cap rate
0.7%
Rent to Value Ratio

Active
$535,000
1
bds
|
2
ba
|
746
sqft
|
built
2018
501 NE 31st St, Miami, FL 33137
$-2,190
Cash flow
-21.4%
Cash-on-Cash Return
1.2%
Cap rate
0.6%
Rent to Value Ratio

Active
$1,975,000
3
bds
|
4
ba
|
1,634
sqft
|
built
2018
3131 NE 7th Ave, Miami, FL 33137
$-7,965
Cash flow
-21.0%
Cash-on-Cash Return
1.3%
Cap rate
0.5%
Rent to Value Ratio

Active
$550,000
1
bds
|
2
ba
|
618
sqft
|
built
2018
501 NE 31st St, Miami, FL 33137
$-1,903
Cash flow
-18.1%
Cash-on-Cash Return
2.0%
Cap rate
0.6%
Rent to Value Ratio

Active
$1,895,000
2
bds
|
3
ba
|
1,910
sqft
|
built
2023
700 NE 26th Ter, Miami, FL 33137
$-7,835
Cash flow
-21.6%
Cash-on-Cash Return
1.2%
Cap rate
0.5%
Rent to Value Ratio

Active
$485,000
1
bds
|
1
ba
|
622
sqft
|
built
2018
501 NE 31st St, Miami, FL 33137
$-1,770
Cash flow
-19.0%
Cash-on-Cash Return
1.8%
Cap rate
0.7%
Rent to Value Ratio

Active
$745,000
2
bds
|
2
ba
|
1,143
sqft
|
built
2015
460 NE 28th St, Miami, FL 33137
$-3,158
Cash flow
-22.1%
Cash-on-Cash Return
1.1%
Cap rate
0.7%
Rent to Value Ratio