33139 Investment Properties for Sale
Browse homes for sale and investment properties in 33139. Refine your search by price, property type, or more.
Best cash flowing properties in 33139

Active
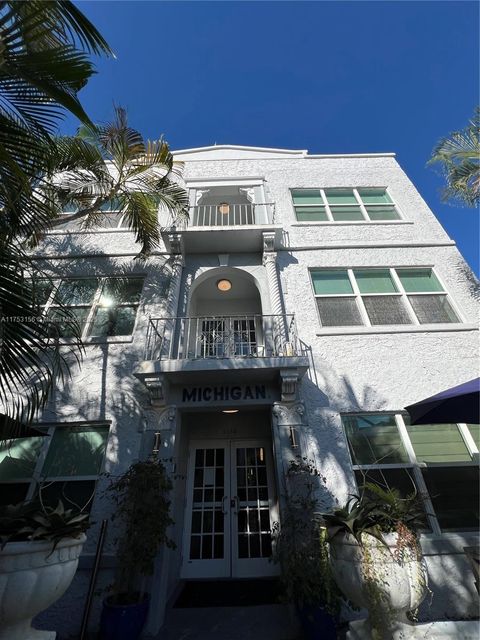
$130,000
bds
|
1
ba
|
285
sqft
|
built
1925
642 Michigan Ave, Miami Beach, FL 33139
$-210
Cash flow
-8.4%
Cash-on-Cash Return
4.2%
Cap rate
1.4%
Rent to Value Ratio

Active
$285,000
1
bds
|
1
ba
|
519
sqft
|
built
1945
1560 Meridian Ave, Miami Beach, FL 33139
$-341
Cash flow
-6.2%
Cash-on-Cash Return
4.7%
Cap rate
1.0%
Rent to Value Ratio
842 out of 926 properties for sale in 33139
Limited Results Shown
Create a free account, or log in to reveal all property listings and enjoy the complete experience.

Active
$430,000
1
bds
|
1
ba
|
852
sqft
|
built
1968
1000 West Ave, Miami Beach, FL 33139
$-1,875
Cash flow
-22.8%
Cash-on-Cash Return
0.9%
Cap rate
0.7%
Rent to Value Ratio

Active
$9,995,000
3
bds
|
5
ba
|
2,508
sqft
|
built
2002
100 S Pointe Dr, Miami Beach, FL 33139
$-57,668
Cash flow
-30.1%
Cash-on-Cash Return
-0.8%
Cap rate
0.1%
Rent to Value Ratio

Active
$290,000
1
bds
|
1
ba
|
528
sqft
|
built
1936
1600 Euclid Ave, Miami Beach, FL 33139
$-957
Cash flow
-17.2%
Cash-on-Cash Return
2.2%
Cap rate
0.7%
Rent to Value Ratio

Active
$1,850,000
2
bds
|
2
ba
|
1,131
sqft
|
built
2018
300 Collins Ave, Miami Beach, FL 33139
$-8,165
Cash flow
-23.0%
Cash-on-Cash Return
0.9%
Cap rate
0.5%
Rent to Value Ratio

Active
$1,349,000
2
bds
|
2
ba
|
1,110
sqft
|
built
2000
200 Ocean Dr, Miami Beach, FL 33139
$-4,290
Cash flow
-16.6%
Cash-on-Cash Return
2.3%
Cap rate
0.5%
Rent to Value Ratio

Active
$225,000
1
bds
|
1
ba
|
337
sqft
|
built
1952
1840 James Ave, Miami Beach, FL 33139
$-360
Cash flow
-8.3%
Cash-on-Cash Return
4.2%
Cap rate
0.9%
Rent to Value Ratio
Active
$259,900
1
bds
|
1
ba
|
450
sqft
|
built
1925
1618 Michigan Ave, Miami Beach, FL 33139
$-682
Cash flow
-13.7%
Cash-on-Cash Return
3.0%
Cap rate
0.8%
Rent to Value Ratio

Active
$785,000
1
bds
|
1
ba
|
1,234
sqft
|
built
1997
650 West Ave, Miami Beach, FL 33139
$-2,689
Cash flow
-17.9%
Cash-on-Cash Return
2.0%
Cap rate
0.5%
Rent to Value Ratio

Active
$4,195,000
4
bds
|
4
ba
|
2,517
sqft
|
built
1941
118 E 3rd Ct, Miami Beach, FL 33139
$-19,183
Cash flow
-23.9%
Cash-on-Cash Return
0.7%
Cap rate
0.2%
Rent to Value Ratio
Active
$1,140,000
3
bds
|
2
ba
|
1,328
sqft
|
built
1975
201 Jefferson Ave, Miami Beach, FL 33139
$-4,646
Cash flow
-21.3%
Cash-on-Cash Return
1.3%
Cap rate
0.4%
Rent to Value Ratio
Active
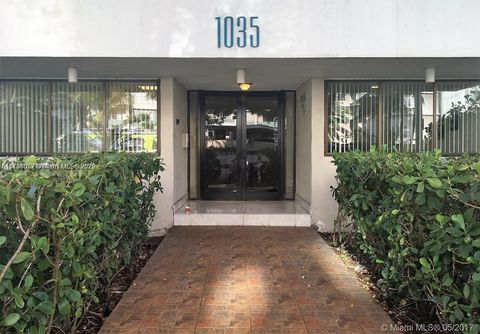
$449,000
1
bds
|
2
ba
|
723
sqft
|
built
1979
1035 West Ave, Miami Beach, FL 33139
$-1,284
Cash flow
-14.9%
Cash-on-Cash Return
2.7%
Cap rate
0.7%
Rent to Value Ratio

Active
$294,900
1
bds
|
1
ba
|
585
sqft
|
built
1965
926 Michigan Ave, Miami Beach, FL 33139
$-833
Cash flow
-14.7%
Cash-on-Cash Return
2.8%
Cap rate
0.7%
Rent to Value Ratio
Active
$235,000
1
bds
|
1
ba
|
565
sqft
|
built
1935
1535 Meridian Ave, Miami Beach, FL 33139
$-855
Cash flow
-19.0%
Cash-on-Cash Return
1.8%
Cap rate
0.9%
Rent to Value Ratio

Active
$1,649,000
1
bds
|
1
ba
|
880
sqft
|
built
1926
2301 Collins Ave, Miami Beach, FL 33139
$-8,166
Cash flow
-25.8%
Cash-on-Cash Return
0.2%
Cap rate
0.3%
Rent to Value Ratio

Active
$825,000
2
bds
|
2
ba
|
1,088
sqft
|
built
2008
1100 West Ave, Miami Beach, FL 33139
$-3,731
Cash flow
-23.6%
Cash-on-Cash Return
0.7%
Cap rate
0.8%
Rent to Value Ratio

Active
$2,150,000
2
bds
|
2
ba
|
1,230
sqft
|
built
1926
2301 Collins Ave, Miami Beach, FL 33139
$-9,439
Cash flow
-22.9%
Cash-on-Cash Return
0.9%
Cap rate
0.5%
Rent to Value Ratio

Active
$245,000
bds
|
1
ba
|
663
sqft
|
built
1968
1000 West Ave, Miami Beach, FL 33139
$-1,138
Cash flow
-24.2%
Cash-on-Cash Return
0.6%
Cap rate
0.8%
Rent to Value Ratio

Active
$330,000
1
bds
|
1
ba
|
609
sqft
|
built
2015
600 15th St, Miami Beach, FL 33139
$-1,191
Cash flow
-18.8%
Cash-on-Cash Return
1.8%
Cap rate
0.7%
Rent to Value Ratio
Active
$299,000
1
bds
|
1
ba
|
450
sqft
|
built
1937
1460 Ocean Dr, Miami Beach, FL 33139
$-724
Cash flow
-12.6%
Cash-on-Cash Return
3.2%
Cap rate
0.9%
Rent to Value Ratio

Active
$4,600,000
4
bds
|
4
ba
|
3,539
sqft
|
built
2010
114 4th Rivo Alto Ter, Miami Beach, FL 33139
$-21,745
Cash flow
-24.7%
Cash-on-Cash Return
0.5%
Cap rate
0.2%
Rent to Value Ratio

Active
$299,000
1
bds
|
1
ba
|
790
sqft
|
built
1966
1662 Lincoln Ct, Miami Beach, FL 33139
$-713
Cash flow
-12.4%
Cash-on-Cash Return
3.3%
Cap rate
0.9%
Rent to Value Ratio

Active
$320,000
1
bds
|
1
ba
|
556
sqft
|
built
1936
435 21st St, Miami Beach, FL 33139
$-1,211
Cash flow
-19.7%
Cash-on-Cash Return
1.6%
Cap rate
0.8%
Rent to Value Ratio

Active
$235,000
1
bds
|
1
ba
|
453
sqft
|
built
2015
801 8th St, Miami Beach, FL 33139
$-835
Cash flow
-18.5%
Cash-on-Cash Return
1.9%
Cap rate
0.9%
Rent to Value Ratio

Active
$483,000
1
bds
|
2
ba
|
890
sqft
|
built
1965
100 Lincoln Rd, Miami Beach, FL 33139
$-2,157
Cash flow
-23.3%
Cash-on-Cash Return
0.8%
Cap rate
0.7%
Rent to Value Ratio

Active
$355,000
2
bds
|
2
ba
|
700
sqft
|
built
1931
750 Pennsylvania Ave, Miami Beach, FL 33139
$-905
Cash flow
-13.3%
Cash-on-Cash Return
3.1%
Cap rate
0.8%
Rent to Value Ratio

Active
$345,000
1
bds
|
2
ba
|
770
sqft
|
built
1969
1340 Lincoln Rd, Miami Beach, FL 33139
$-801
Cash flow
-12.1%
Cash-on-Cash Return
3.4%
Cap rate
0.8%
Rent to Value Ratio

Active
$1,390,000
bds
|
1
ba
|
491
sqft
|
built
2009
2201 Collins Ave, Miami Beach, FL 33139
$-7,225
Cash flow
-27.1%
Cash-on-Cash Return
-0.1%
Cap rate
0.4%
Rent to Value Ratio

Active
$4,350,000
3
bds
|
4
ba
|
2,570
sqft
|
built
2016
1 Collins Ave, Miami Beach, FL 33139
$-28,263
Cash flow
-33.9%
Cash-on-Cash Return
-1.6%
Cap rate
0.2%
Rent to Value Ratio

Active
$2,999,000
5
bds
|
6
ba
|
0
sqft
|
built
2026
315 W San Marino Dr, Miami Beach, FL 33139
$-13,942
Cash flow
-24.3%
Cash-on-Cash Return
0.6%
Cap rate
0.2%
Rent to Value Ratio
Active
$359,500
1
bds
|
2
ba
|
750
sqft
|
built
1971
1228 West Ave, Miami Beach, FL 33139
$-997
Cash flow
-14.5%
Cash-on-Cash Return
2.8%
Cap rate
0.8%
Rent to Value Ratio

Active
$2,650,000
2
bds
|
3
ba
|
1,287
sqft
|
built
2009
2201 Collins Ave, Miami Beach, FL 33139
$-14,965
Cash flow
-29.5%
Cash-on-Cash Return
-0.6%
Cap rate
0.3%
Rent to Value Ratio

Active
$499,900
1
bds
|
1
ba
|
820
sqft
|
built
1965
100 Lincoln Rd, Miami Beach, FL 33139
$-2,115
Cash flow
-22.1%
Cash-on-Cash Return
1.1%
Cap rate
0.6%
Rent to Value Ratio

Active
$265,000
1
bds
|
1
ba
|
714
sqft
|
built
1949
1045 Lenox Ave, Miami Beach, FL 33139
$-783
Cash flow
-15.4%
Cash-on-Cash Return
2.6%
Cap rate
0.9%
Rent to Value Ratio
Active
$1,195,000
1
bds
|
1
ba
|
723
sqft
|
built
2004
225 Collins Ave, Miami Beach, FL 33139
$-4,129
Cash flow
-18.0%
Cash-on-Cash Return
2.0%
Cap rate
0.5%
Rent to Value Ratio

Active
$820,000
1
bds
|
2
ba
|
701
sqft
|
built
2016
1201 20th St, Miami Beach, FL 33139
$-1,604
Cash flow
-10.2%
Cash-on-Cash Return
3.8%
Cap rate
0.8%
Rent to Value Ratio
Active
$17,500,000
5
bds
|
6
ba
|
4,703
sqft
|
built
2010
610 W Dilido Dr, Miami Beach, FL 33139
$-98,791
Cash flow
-29.5%
Cash-on-Cash Return
-0.6%
Cap rate
0.1%
Rent to Value Ratio

Active
$525,000
1
bds
|
1
ba
|
655
sqft
|
built
1970
401 Ocean Dr, Miami Beach, FL 33139
$-2,147
Cash flow
-21.3%
Cash-on-Cash Return
1.2%
Cap rate
0.6%
Rent to Value Ratio

Active
$235,000
1
bds
|
1
ba
|
470
sqft
|
built
1935
439 15th St, Miami Beach, FL 33139
$-788
Cash flow
-17.5%
Cash-on-Cash Return
2.1%
Cap rate
0.8%
Rent to Value Ratio