33156 Investment Properties for Sale
Browse homes for sale and investment properties in 33156. Refine your search by price, property type, or more.
Best cash flowing properties in 33156
Active
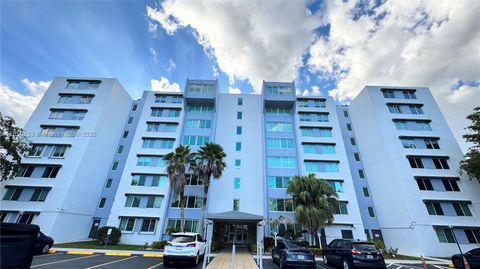
$349,900
2
bds
|
2
ba
|
1,110
sqft
|
built
1970
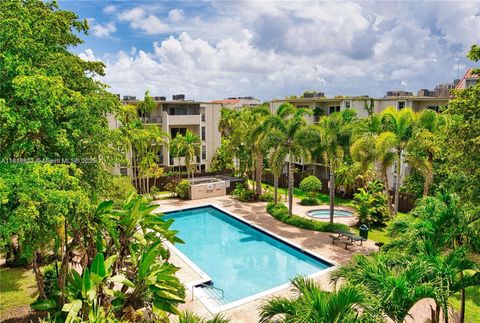
6890 N Kendall Dr, Pinecrest, FL 33156
$-462
Cash flow
-6.9%
Cash-on-Cash Return
4.6%
Cap rate
0.7%
Rent to Value Ratio
Active
$390,000
2
bds
|
2
ba
|
1,178
sqft
|
built
1967
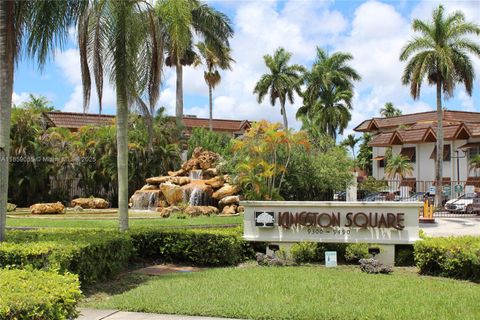
9350 SW 77th Ave, Miami, FL 33156
$-607
Cash flow
-8.1%
Cash-on-Cash Return
4.3%
Cap rate
0.8%
Rent to Value Ratio
184 out of 202 properties for sale in 33156
Limited Results Shown
Create a free account, or log in to reveal all property listings and enjoy the complete experience.
Active
$7,900,000
8
bds
|
10
ba
|
8,105
sqft
|
built
2022
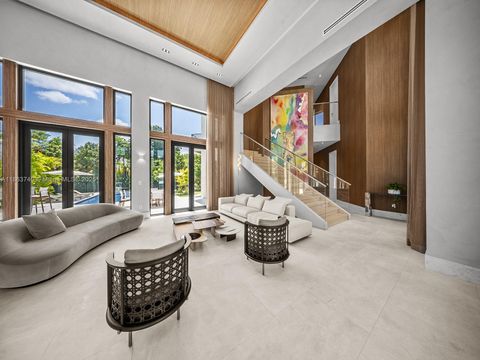
5700 SW 91st St, Pinecrest, FL 33156
$-41,580
Cash flow
-27.5%
Cash-on-Cash Return
-0.2%
Cap rate
0.1%
Rent to Value Ratio
Active
$6,995,000
6
bds
|
8
ba
|
5,961
sqft
|
built
2021
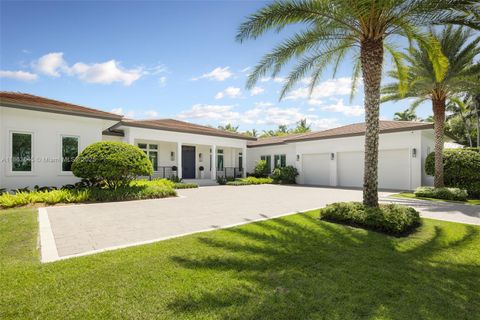
6460 SW 122nd St, Pinecrest, FL 33156
$-35,610
Cash flow
-26.6%
Cash-on-Cash Return
0.0%
Cap rate
0.1%
Rent to Value Ratio
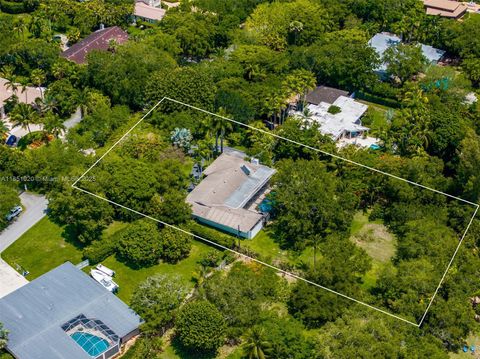
Active
$3,950,000
4
bds
|
3
ba
|
4,944
sqft
|
built
1950
6285 SW 98th St, Pinecrest, FL 33156
$-17,770
Cash flow
-23.5%
Cash-on-Cash Return
0.7%
Cap rate
0.2%
Rent to Value Ratio
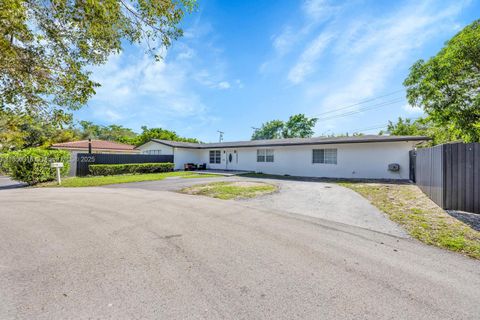
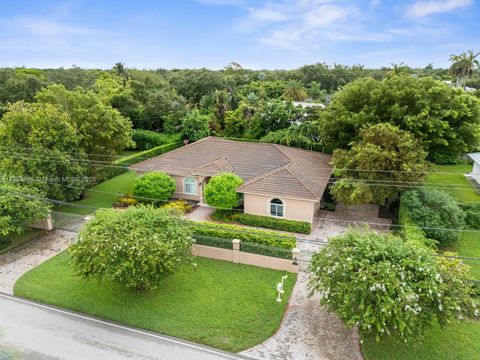
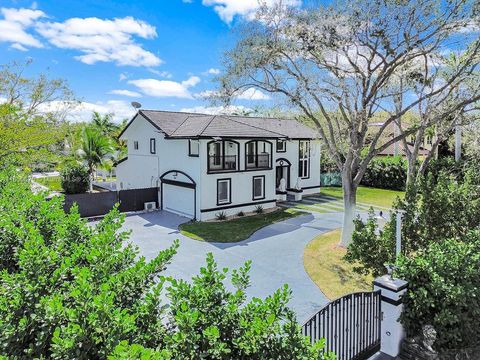
Active
$1,650,000
4
bds
|
3
ba
|
2,662
sqft
|
built
1964
8355 SW 89th St, Miami, FL 33156
$-2,717
Cash flow
-8.6%
Cash-on-Cash Return
4.2%
Cap rate
0.5%
Rent to Value Ratio
Active
$7,595,000
6
bds
|
6
ba
|
6,530
sqft
|
built
2020
6175 SW 128th St, Pinecrest, FL 33156
$-40,624
Cash flow
-27.9%
Cash-on-Cash Return
-0.3%
Cap rate
0.1%
Rent to Value Ratio
Active
$5,500,000
6
bds
|
7
ba
|
0
sqft
|
built
2025
7400 SW 127th St, Pinecrest, FL 33156
$-26,119
Cash flow
-24.8%
Cash-on-Cash Return
0.4%
Cap rate
0.1%
Rent to Value Ratio
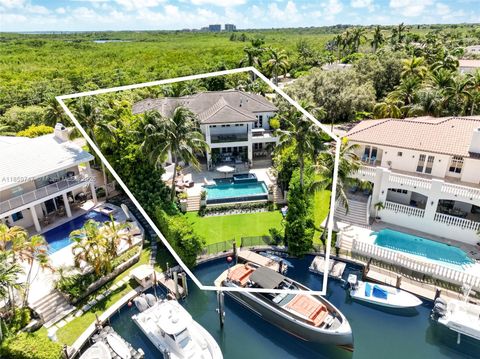
Active
$10,750,000
6
bds
|
7
ba
|
4,980
sqft
|
built
2011
701 Bella Vista Ave, Coral Gables, FL 33156
$-56,333
Cash flow
-27.3%
Cash-on-Cash Return
-0.1%
Cap rate
0.1%
Rent to Value Ratio
Active
$1,400,000
5
bds
|
0
ba
|
2,488
sqft
|
built
1956
10504 SW 77th Ct, Pinecrest, FL 33156
$-6,161
Cash flow
-23.0%
Cash-on-Cash Return
0.9%
Cap rate
0.2%
Rent to Value Ratio
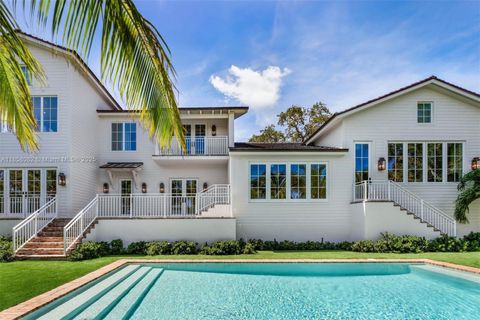
Active
$7,950,000
5
bds
|
5
ba
|
4,809
sqft
|
built
1979
1051 San Pedro Ave, Coral Gables, FL 33156
$-40,876
Cash flow
-26.8%
Cash-on-Cash Return
0.0%
Cap rate
0.1%
Rent to Value Ratio
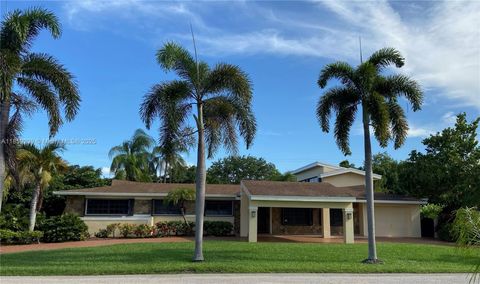
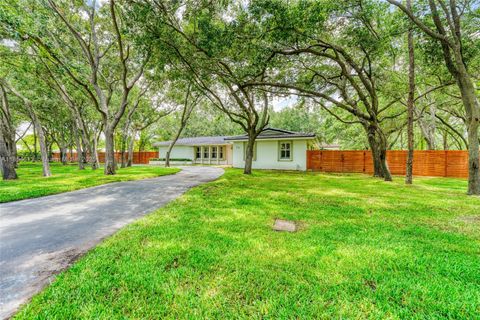
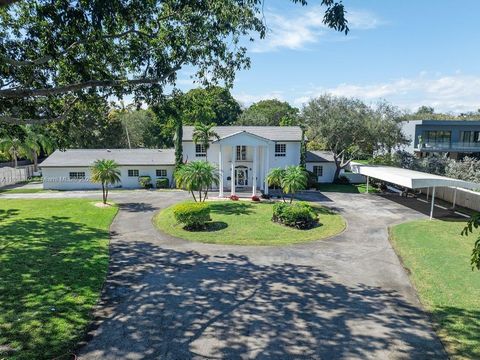
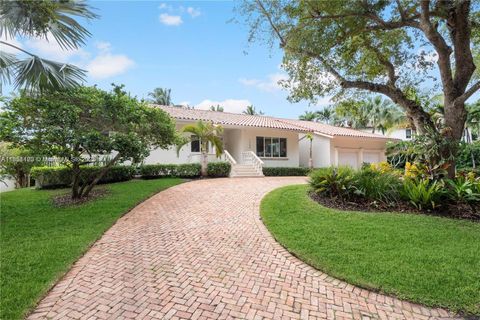
Active
$1,649,999
4
bds
|
3
ba
|
2,912
sqft
|
built
1960
8370 SW 89th St, Miami, FL 33156
$-4,000
Cash flow
-12.6%
Cash-on-Cash Return
3.2%
Cap rate
0.4%
Rent to Value Ratio
Active
$1,775,000
4
bds
|
5
ba
|
3,202
sqft
|
built
2007
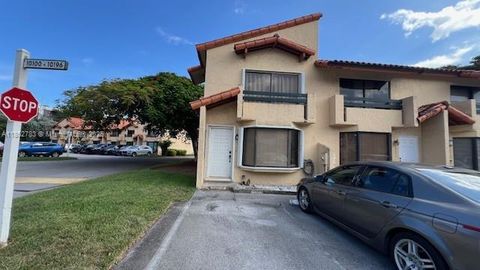
10170 SW 75th Pl, Pinecrest, FL 33156
$-5,326
Cash flow
-15.7%
Cash-on-Cash Return
2.5%
Cap rate
0.5%
Rent to Value Ratio
Active
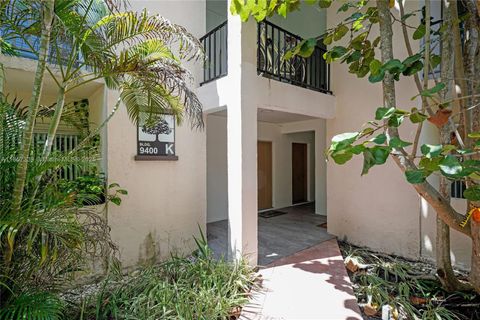
$334,900
2
bds
|
2
ba
|
1,178
sqft
|
built
1967
9400 SW 77th Ave, Miami, FL 33156
$-797
Cash flow
-12.4%
Cash-on-Cash Return
3.3%
Cap rate
0.8%
Rent to Value Ratio
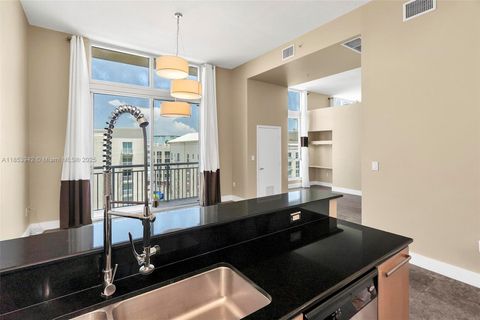
Active
$379,990
2
bds
|
2
ba
|
1,049
sqft
|
built
2008
7275 SW 90th Way, Miami, FL 33156
$-1,507
Cash flow
-20.7%
Cash-on-Cash Return
1.4%
Cap rate
0.8%
Rent to Value Ratio
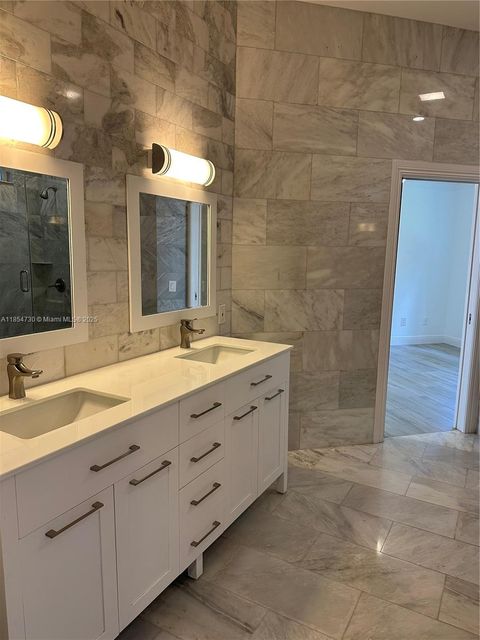
Active
$1,399,000
4
bds
|
3
ba
|
2,022
sqft
|
built
2022
7771 SW 99th St, Miami, FL 33156
$-2,399
Cash flow
-8.9%
Cash-on-Cash Return
4.1%
Cap rate
0.6%
Rent to Value Ratio
Active
$2,050,000
4
bds
|
4
ba
|
2,709
sqft
|
built
1999
10621 SW 77th Ave, Pinecrest, FL 33156
$-5,830
Cash flow
-14.8%
Cash-on-Cash Return
2.7%
Cap rate
0.4%
Rent to Value Ratio
Active
$2,500,000
5
bds
|
3
ba
|
2,670
sqft
|
built
1969
7715 SW 122nd St, Pinecrest, FL 33156
$-8,515
Cash flow
-17.8%
Cash-on-Cash Return
2.1%
Cap rate
0.4%
Rent to Value Ratio
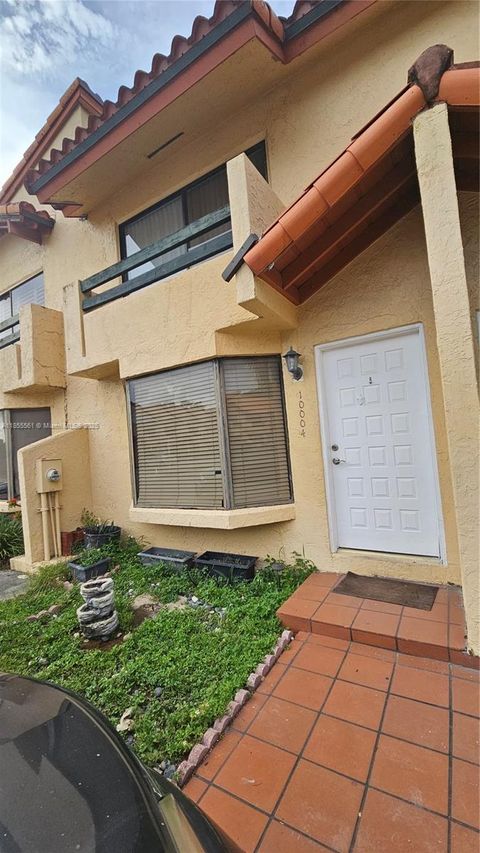
Active
$469,000
2
bds
|
3
ba
|
1,152
sqft
|
built
1987
10004 SW 77th Ct, Miami, FL 33156
$-1,449
Cash flow
-16.1%
Cash-on-Cash Return
2.4%
Cap rate
0.7%
Rent to Value Ratio
Active
$370,000
1
bds
|
1
ba
|
845
sqft
|
built
2006
9055 SW 73rd Ct, Pinecrest, FL 33156
$-1,516
Cash flow
-21.4%
Cash-on-Cash Return
1.2%
Cap rate
0.7%
Rent to Value Ratio
Active
$449,900
2
bds
|
2
ba
|
1,152
sqft
|
built
1988
10170 SW 77th Ct, Miami, FL 33156
$-1,346
Cash flow
-15.6%
Cash-on-Cash Return
2.6%
Cap rate
0.7%
Rent to Value Ratio
Active
$3,500,000
7
bds
|
7
ba
|
5,102
sqft
|
built
1961
13000 Old Cutler Rd, Pinecrest, FL 33156
$-14,600
Cash flow
-21.8%
Cash-on-Cash Return
1.1%
Cap rate
0.3%
Rent to Value Ratio
Active
$389,000
2
bds
|
1
ba
|
957
sqft
|
built
2006
9055 SW 73rd Ct, Pinecrest, FL 33156
$-1,541
Cash flow
-20.7%
Cash-on-Cash Return
1.4%
Cap rate
0.6%
Rent to Value Ratio
Active
$5,195,000
6
bds
|
5
ba
|
5,849
sqft
|
built
1992
10600 SW 69th Ave, Pinecrest, FL 33156
$-23,377
Cash flow
-23.5%
Cash-on-Cash Return
0.7%
Cap rate
0.2%
Rent to Value Ratio
Active
$350,000
1
bds
|
1
ba
|
825
sqft
|
built
2007
7266 SW 88th St, Miami, FL 33156
$-1,127
Cash flow
-16.8%
Cash-on-Cash Return
2.3%
Cap rate
0.7%
Rent to Value Ratio
Active
$385,000
2
bds
|
2
ba
|
982
sqft
|
built
1970
6900 N Kendall Dr, Pinecrest, FL 33156
$-1,322
Cash flow
-17.9%
Cash-on-Cash Return
2.0%
Cap rate
0.6%
Rent to Value Ratio
Active
$3,499,000
6
bds
|
7
ba
|
5,019
sqft
|
built
1958
6220 SW 123rd Ter, Pinecrest, FL 33156
$-15,148
Cash flow
-22.6%
Cash-on-Cash Return
1.0%
Cap rate
0.3%
Rent to Value Ratio
Active
$390,000
2
bds
|
1
ba
|
805
sqft
|
built
1968
8607 SW 68th Ct, Pinecrest, FL 33156
$-1,122
Cash flow
-15.0%
Cash-on-Cash Return
2.7%
Cap rate
0.6%
Rent to Value Ratio
Active
$350,000
3
bds
|
2
ba
|
1,190
sqft
|
built
1971
9125 SW 77th Ave, Miami, FL 33156
$-670
Cash flow
-10.0%
Cash-on-Cash Return
3.9%
Cap rate
0.8%
Rent to Value Ratio
Active
$3,250,000
4
bds
|
3
ba
|
2,747
sqft
|
built
1969
12365 SW 60th Ct, Pinecrest, FL 33156
$-13,553
Cash flow
-21.8%
Cash-on-Cash Return
1.1%
Cap rate
0.2%
Rent to Value Ratio
Active
$3,700,000
5
bds
|
4
ba
|
4,119
sqft
|
built
1988
7830 SW 120th St, Pinecrest, FL 33156
$-14,869
Cash flow
-21.0%
Cash-on-Cash Return
1.3%
Cap rate
0.3%
Rent to Value Ratio
Active
$2,899,000
4
bds
|
3
ba
|
2,323
sqft
|
built
1980
1540 Tagus Ave, Coral Gables, FL 33156
$-10,100
Cash flow
-18.2%
Cash-on-Cash Return
2.0%
Cap rate
0.4%
Rent to Value Ratio
Active
$2,350,000
4
bds
|
3
ba
|
3,444
sqft
|
built
1984
10651 SW 76th Ave, Pinecrest, FL 33156
$-6,869
Cash flow
-15.3%
Cash-on-Cash Return
2.6%
Cap rate
0.4%
Rent to Value Ratio
Active
$269,999
2
bds
|
2
ba
|
1,141
sqft
|
built
1971
9001 SW 77th Ave, Miami, FL 33156
$-707
Cash flow
-13.7%
Cash-on-Cash Return
3.0%
Cap rate
0.9%
Rent to Value Ratio
Active
$234,999
1
bds
|
1
ba
|
699
sqft
|
built
1971
9001 SW 77th Ave, Miami, FL 33156
$-771
Cash flow
-17.1%
Cash-on-Cash Return
2.2%
Cap rate
0.9%
Rent to Value Ratio
Active
$949,000
4
bds
|
3
ba
|
1,994
sqft
|
built
1978
8626 SW 94th St, Miami, FL 33156
$-3,077
Cash flow
-16.9%
Cash-on-Cash Return
2.3%
Cap rate
0.5%
Rent to Value Ratio
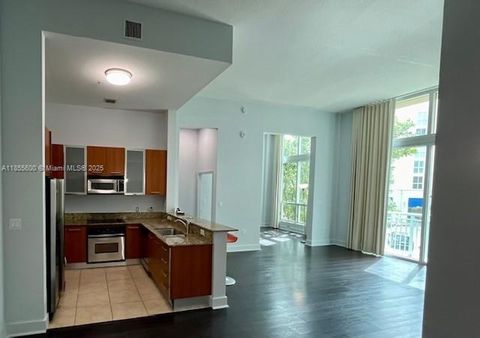
Active
$479,999
2
bds
|
3
ba
|
1,187
sqft
|
built
2006
9055 SW 73rd Ct, Pinecrest, FL 33156
$-1,104
Cash flow
-12.0%
Cash-on-Cash Return
3.4%
Cap rate
0.9%
Rent to Value Ratio
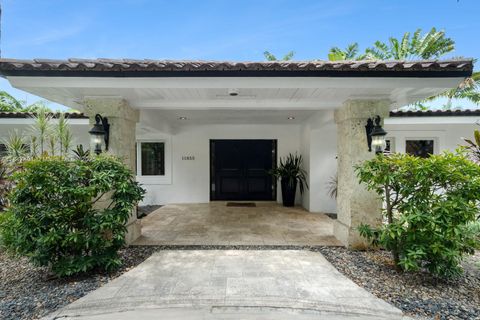
Active
$4,200,000
6
bds
|
5
ba
|
2,965
sqft
|
built
1954
11855 SW 68th Ct, Pinecrest, FL 33156
$-18,305
Cash flow
-22.7%
Cash-on-Cash Return
0.9%
Cap rate
0.2%
Rent to Value Ratio
Active
$2,250,000
5
bds
|
4
ba
|
4,001
sqft
|
built
1967
13020 SW 70th Ave, Pinecrest, FL 33156
$-5,493
Cash flow
-12.7%
Cash-on-Cash Return
3.2%
Cap rate
0.4%
Rent to Value Ratio
Active
$389,888
2
bds
|
1
ba
|
997
sqft
|
built
2006
9055 SW 73rd Ct, Pinecrest, FL 33156
$-1,584
Cash flow
-21.2%
Cash-on-Cash Return
1.3%
Cap rate
0.7%
Rent to Value Ratio