33176 Investment Properties for Sale
Browse homes for sale and investment properties in 33176. Refine your search by price, property type, or more.
Best cash flowing properties in 33176
Active
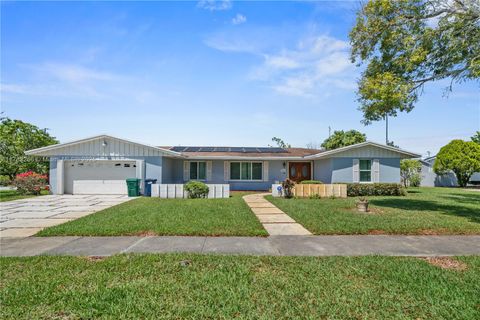
$465,000
3
bds
|
2
ba
|
1,474
sqft
|
built
1961
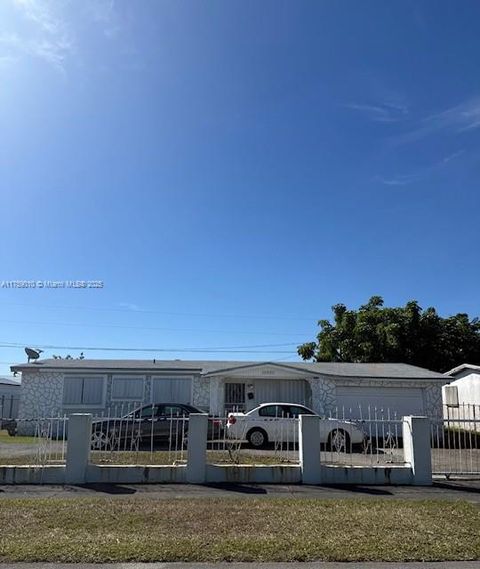
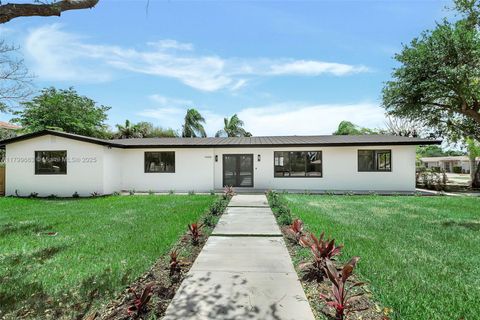
10460 SW 149th St, Miami, FL 33176
$-346
Cash flow
-3.9%
Cash-on-Cash Return
5.3%
Cap rate
0.7%
Rent to Value Ratio
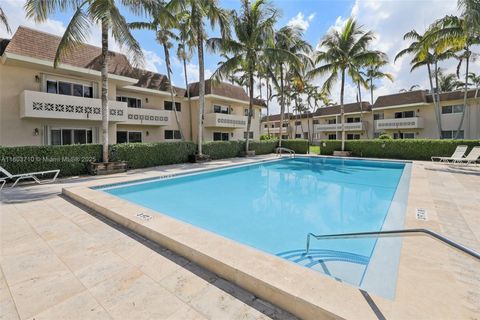
Active
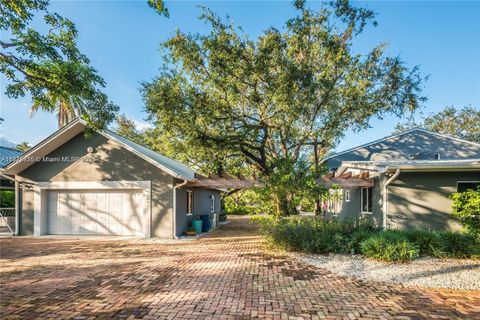
$510,000
3
bds
|
2
ba
|
1,234
sqft
|
built
1978
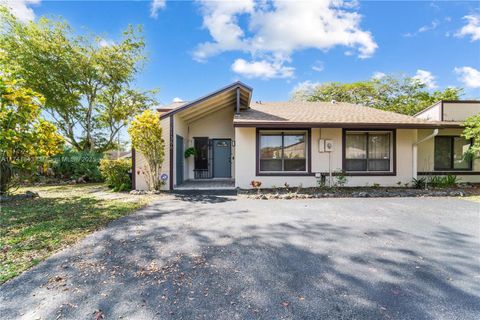
11356 SW 116th Terrace Rd, Miami, FL 33176
$-481
Cash flow
-4.9%
Cash-on-Cash Return
5.0%
Cap rate
0.7%
Rent to Value Ratio
128 out of 134 properties for sale in 33176
Limited Results Shown
Create a free account, or log in to reveal all property listings and enjoy the complete experience.
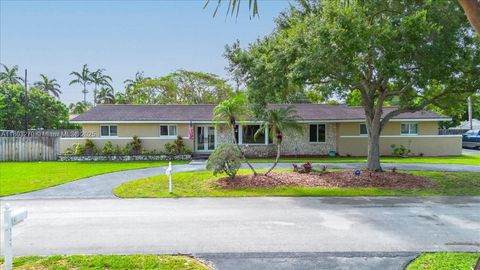
Active
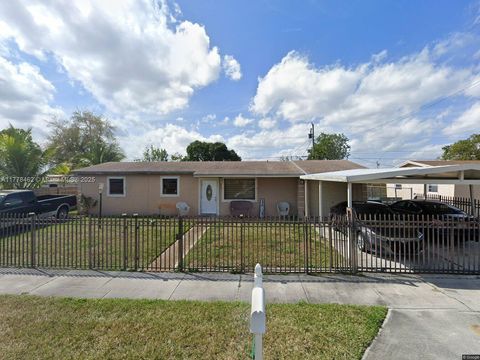
$450,000
2
bds
|
1
ba
|
768
sqft
|
built
1950
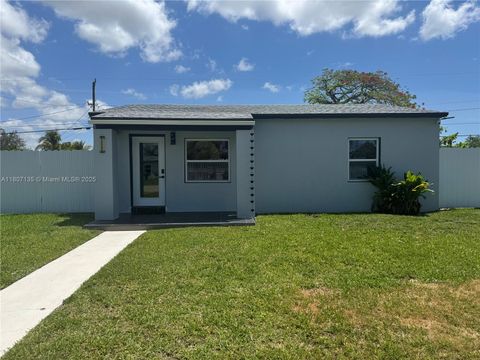
14581 Jackson St, Miami, FL 33176
$-1,034
Cash flow
-12.0%
Cash-on-Cash Return
3.4%
Cap rate
0.6%
Rent to Value Ratio
Active
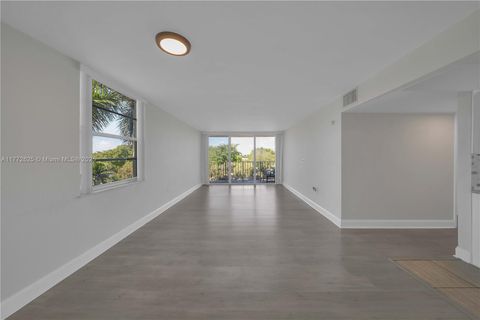
$269,000
2
bds
|
2
ba
|
936
sqft
|
built
1981
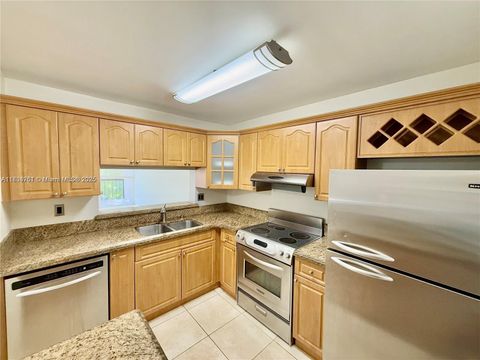
10825 SW 112th Ave, Miami, FL 33176
$-770
Cash flow
-14.9%
Cash-on-Cash Return
2.7%
Cap rate
0.7%
Rent to Value Ratio
Active
$289,999
2
bds
|
2
ba
|
805
sqft
|
built
1969
14500 SW 88th Ave, Palmetto Bay, FL 33176
$-864
Cash flow
-15.5%
Cash-on-Cash Return
2.6%
Cap rate
0.8%
Rent to Value Ratio
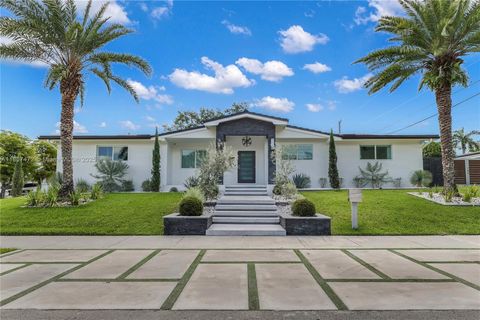
Active
$1,195,000
4
bds
|
3
ba
|
2,343
sqft
|
built
1975
9750 SW 143rd St, Miami, FL 33176
$-1,062
Cash flow
-4.6%
Cash-on-Cash Return
5.1%
Cap rate
0.7%
Rent to Value Ratio
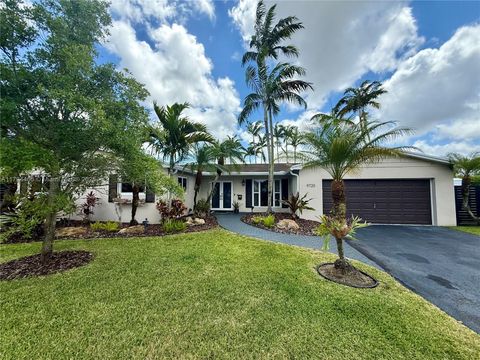
Active
$1,439,900
4
bds
|
2
ba
|
2,618
sqft
|
built
1967
8803 SW 93rd Ct, Miami, FL 33176
$-4,148
Cash flow
-15.0%
Cash-on-Cash Return
2.7%
Cap rate
0.4%
Rent to Value Ratio
Active
$979,000
3
bds
|
2
ba
|
1,701
sqft
|
built
1966
9720 SW 104th Ct, Miami, FL 33176
$-2,345
Cash flow
-12.5%
Cash-on-Cash Return
3.3%
Cap rate
0.4%
Rent to Value Ratio
Active
$1,390,000
4
bds
|
3
ba
|
2,650
sqft
|
built
1971
9494 SW 144th St, Miami, FL 33176
$-3,608
Cash flow
-13.5%
Cash-on-Cash Return
3.0%
Cap rate
0.4%
Rent to Value Ratio
Active
$449,000
2
bds
|
2
ba
|
1,400
sqft
|
built
1974
10945 SW 113th Pl, Miami, FL 33176
$-1,263
Cash flow
-14.7%
Cash-on-Cash Return
2.8%
Cap rate
0.6%
Rent to Value Ratio
Active
$890,000
3
bds
|
2
ba
|
2,075
sqft
|
built
1967
10610 SW 103rd St, Miami, FL 33176
$-2,106
Cash flow
-12.3%
Cash-on-Cash Return
3.3%
Cap rate
0.4%
Rent to Value Ratio
Active
$262,876
2
bds
|
2
ba
|
777
sqft
|
built
1968
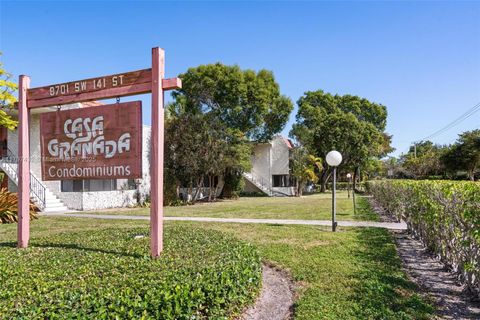
8701 SW 141st St, Palmetto Bay, FL 33176
$-696
Cash flow
-13.8%
Cash-on-Cash Return
3.0%
Cap rate
0.8%
Rent to Value Ratio
Active
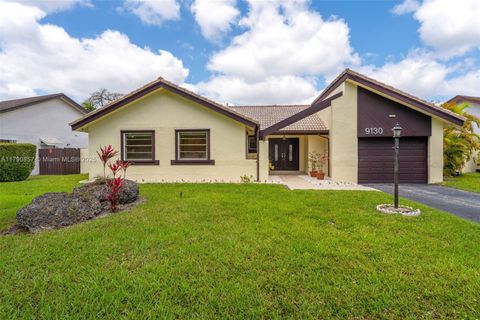
$1,875,000
4
bds
|
4
ba
|
2,981
sqft
|
built
1977
9130 SW 140th St, Miami, FL 33176
$-4,523
Cash flow
-12.6%
Cash-on-Cash Return
3.3%
Cap rate
0.5%
Rent to Value Ratio
Active
$824,900
3
bds
|
2
ba
|
1,663
sqft
|
built
1978
9130 SW 101st Ave, Miami, FL 33176
$-2,407
Cash flow
-15.2%
Cash-on-Cash Return
2.6%
Cap rate
0.5%
Rent to Value Ratio
Active
$2,850,000
7
bds
|
7
ba
|
6,000
sqft
|
built
1986
8820 SW 104th St, Miami, FL 33176
$-9,205
Cash flow
-16.9%
Cash-on-Cash Return
2.3%
Cap rate
0.4%
Rent to Value Ratio
Active
$4,499,000
6
bds
|
7
ba
|
6,124
sqft
|
built
2017
9150 SW 124th St, Miami, FL 33176
$-20,782
Cash flow
-24.1%
Cash-on-Cash Return
0.6%
Cap rate
0.2%
Rent to Value Ratio
Active
$975,000
3
bds
|
2
ba
|
1,935
sqft
|
built
1963
9041 N Kendall Dr, Miami, FL 33176
$-2,230
Cash flow
-11.9%
Cash-on-Cash Return
3.4%
Cap rate
0.5%
Rent to Value Ratio
Active
$2,600,567
4
bds
|
5
ba
|
4,062
sqft
|
built
1962
9737 SW 98th St, Miami, FL 33176
$-9,949
Cash flow
-20.0%
Cash-on-Cash Return
1.6%
Cap rate
0.2%
Rent to Value Ratio
Active
$580,000
3
bds
|
2
ba
|
1,463
sqft
|
built
1961
14810 SW 103rd Pl, Miami, FL 33176
$-977
Cash flow
-8.8%
Cash-on-Cash Return
4.1%
Cap rate
0.5%
Rent to Value Ratio
Active
$300,000
2
bds
|
1
ba
|
1,077
sqft
|
built
1974
13120 SW 92nd Ave, Miami, FL 33176
$-825
Cash flow
-14.3%
Cash-on-Cash Return
2.8%
Cap rate
0.8%
Rent to Value Ratio
Active
$1,795,000
4
bds
|
4
ba
|
2,667
sqft
|
built
1972
9781 SW 121st St, Miami, FL 33176
$-7,209
Cash flow
-21.0%
Cash-on-Cash Return
1.3%
Cap rate
0.3%
Rent to Value Ratio

Active
$1,100,000
3
bds
|
2
ba
|
1,752
sqft
|
built
1980
10900 SW 124th Rd, Miami, FL 33176
$-3,485
Cash flow
-16.5%
Cash-on-Cash Return
2.3%
Cap rate
0.4%
Rent to Value Ratio
Active
$440,000
3
bds
|
2
ba
|
1,170
sqft
|
built
1976
11514 SW 109th Rd, Miami, FL 33176
$-1,329
Cash flow
-15.8%
Cash-on-Cash Return
2.5%
Cap rate
0.7%
Rent to Value Ratio
Active
$225,000
1
bds
|
2
ba
|
787
sqft
|
built
1981
10835 SW 112th Ave, Miami, FL 33176
$-497
Cash flow
-11.5%
Cash-on-Cash Return
3.5%
Cap rate
0.9%
Rent to Value Ratio
Active
$2,599,000
5
bds
|
5
ba
|
4,071
sqft
|
built
2006
12600 SW 93rd Ave, Miami, FL 33176
$-9,739
Cash flow
-19.6%
Cash-on-Cash Return
1.7%
Cap rate
0.3%
Rent to Value Ratio
Active
$2,175,000
5
bds
|
4
ba
|
2,727
sqft
|
built
1953
8735 SW 118th St, Miami, FL 33176
$-6,872
Cash flow
-16.5%
Cash-on-Cash Return
2.4%
Cap rate
0.4%
Rent to Value Ratio
Active
$2,699,999
7
bds
|
5
ba
|
0
sqft
|
built
1990
9880 SW 148th Ter, Miami, FL 33176
$-9,358
Cash flow
-18.1%
Cash-on-Cash Return
2.0%
Cap rate
0.3%
Rent to Value Ratio
Active
$1,695,000
4
bds
|
3
ba
|
2,645
sqft
|
built
1996
10190 SW 114th Ter, Miami, FL 33176
$-5,553
Cash flow
-17.1%
Cash-on-Cash Return
2.2%
Cap rate
0.3%
Rent to Value Ratio
Active
$317,000
3
bds
|
2
ba
|
1,130
sqft
|
built
1968
10772 N Kendall Dr, Miami, FL 33176
$-859
Cash flow
-14.1%
Cash-on-Cash Return
2.9%
Cap rate
0.8%
Rent to Value Ratio
Active
$320,000
2
bds
|
2
ba
|
1,010
sqft
|
built
1972
9225 SW 87th Ave, Miami, FL 33176
$-1,298
Cash flow
-21.2%
Cash-on-Cash Return
1.3%
Cap rate
0.6%
Rent to Value Ratio
Active
$1,650,000
2
bds
|
1
ba
|
1,440
sqft
|
built
1952
11295 SW 93rd St, Miami, FL 33176
$-6,403
Cash flow
-20.2%
Cash-on-Cash Return
1.5%
Cap rate
0.2%
Rent to Value Ratio
Active
$1,394,000
6
bds
|
4
ba
|
3,267
sqft
|
built
1993
10360 SW 124th St, Miami, FL 33176
$-4,595
Cash flow
-17.2%
Cash-on-Cash Return
2.2%
Cap rate
0.4%
Rent to Value Ratio
Active
$550,000
4
bds
|
2
ba
|
1,156
sqft
|
built
1950
14801 Lincoln Blvd, Miami, FL 33176
$-1,139
Cash flow
-10.8%
Cash-on-Cash Return
3.7%
Cap rate
0.6%
Rent to Value Ratio
Active
$379,000
3
bds
|
2
ba
|
1,400
sqft
|
built
1978
10703 SW 113th Pl, Miami, FL 33176
$-593
Cash flow
-8.2%
Cash-on-Cash Return
4.3%
Cap rate
0.8%
Rent to Value Ratio
Active
$229,000
1
bds
|
1
ba
|
850
sqft
|
built
1973
10900 SW 104th St, Miami, FL 33176
$-591
Cash flow
-13.5%
Cash-on-Cash Return
3.0%
Cap rate
0.9%
Rent to Value Ratio

Active
$1,275,000
4
bds
|
2
ba
|
2,090
sqft
|
built
1950
11624 SW 93rd St, Miami, FL 33176
$-2,342
Cash flow
-9.6%
Cash-on-Cash Return
3.9%
Cap rate
0.5%
Rent to Value Ratio
Active
$240,000
1
bds
|
1
ba
|
850
sqft
|
built
1973
10900 SW 104th St, Miami, FL 33176
$-649
Cash flow
-14.1%
Cash-on-Cash Return
2.9%
Cap rate
0.8%
Rent to Value Ratio
Active
$309,000
3
bds
|
3
ba
|
1,190
sqft
|
built
1971
10801 SW 109th Ct, Miami, FL 33176
$-722
Cash flow
-12.2%
Cash-on-Cash Return
3.3%
Cap rate
0.8%
Rent to Value Ratio
Active
$2,500,000
6
bds
|
5
ba
|
5,116
sqft
|
built
1982
9260 SW 101st St, Miami, FL 33176
$-8,319
Cash flow
-17.4%
Cash-on-Cash Return
2.2%
Cap rate
0.4%
Rent to Value Ratio
Active
$295,000
3
bds
|
2
ba
|
1,130
sqft
|
built
1968
10772 N Kendall Dr, Miami, FL 33176
$-532
Cash flow
-9.4%
Cash-on-Cash Return
4.0%
Cap rate
0.9%
Rent to Value Ratio