33179 Investment Properties for Sale
Browse homes for sale and investment properties in 33179. Refine your search by price, property type, or more.
Best cash flowing properties in 33179

Active
$137,000
1
bds
|
1
ba
|
801
sqft
|
built
1968
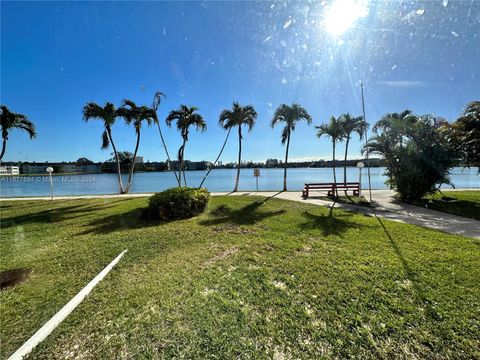
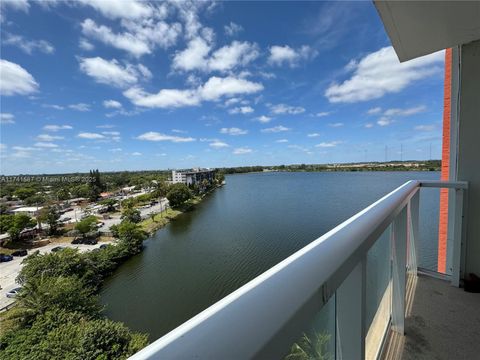
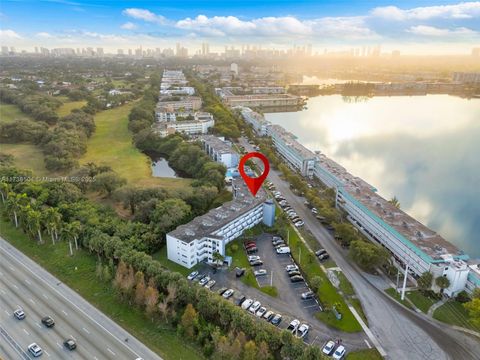
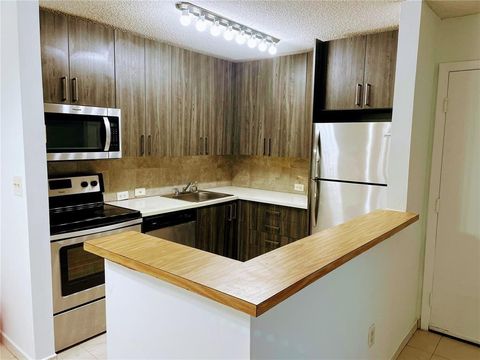
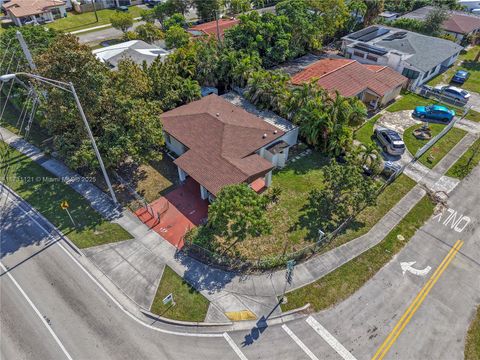
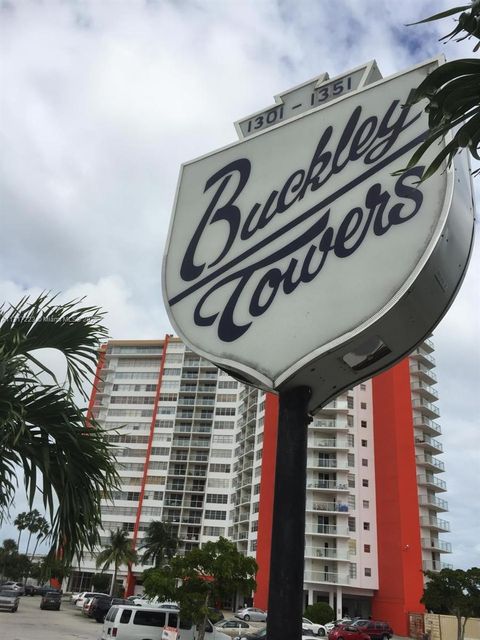
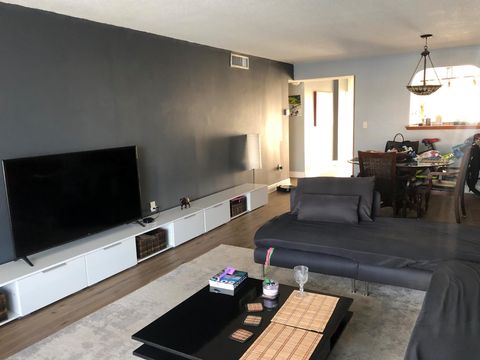
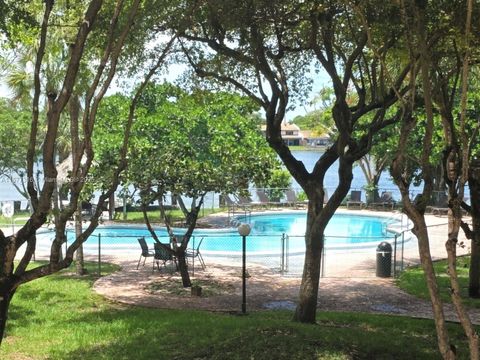
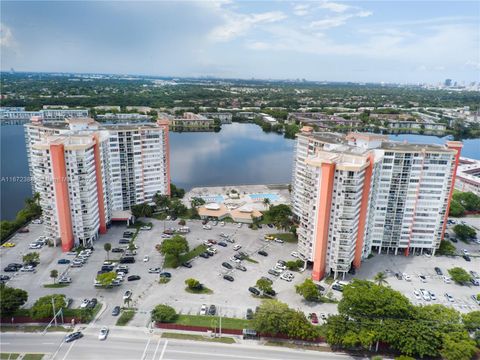
1301 NE Miami Gardens Dr, Miami, FL 33179
$260
Cash flow
9.9%
Cash-on-Cash Return
8.4%
Cap rate
1.2%
Rent to Value Ratio
Active
$160,000
1
bds
|
2
ba
|
846
sqft
|
built
1967
18707 NE 14th Ave, Miami, FL 33179
$205
Cash flow
6.7%
Cash-on-Cash Return
7.7%
Cap rate
1.3%
Rent to Value Ratio
193 out of 266 properties for sale in 33179
Limited Results Shown
Create a free account, or log in to reveal all property listings and enjoy the complete experience.
Active
$168,500
1
bds
|
2
ba
|
861
sqft
|
built
1968
1301 NE Miami Gardens Dr, Miami, FL 33179
$-293
Cash flow
-9.1%
Cash-on-Cash Return
4.1%
Cap rate
1.1%
Rent to Value Ratio
Active
$1,299,000
4
bds
|
2
ba
|
0
sqft
|
built
1976
2061 NE 207th St, Miami, FL 33179
$-1,116
Cash flow
-4.5%
Cash-on-Cash Return
5.1%
Cap rate
0.7%
Rent to Value Ratio
Active
$230,000
2
bds
|
2
ba
|
1,156
sqft
|
built
1970
1101 NE 191st St, Miami, FL 33179
$-298
Cash flow
-6.8%
Cash-on-Cash Return
4.6%
Cap rate
1.1%
Rent to Value Ratio
Active
$199,900
2
bds
|
1
ba
|
870
sqft
|
built
1983
771 NE 199th St, Miami, FL 33179
$128
Cash flow
3.3%
Cash-on-Cash Return
6.9%
Cap rate
1.0%
Rent to Value Ratio
Active
$2,900,000
5
bds
|
4
ba
|
3,250
sqft
|
built
1957
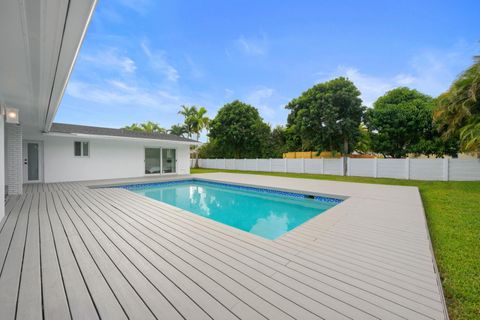
2091 NE 191st Dr, North Miami Beach, FL 33179
$-8,978
Cash flow
-16.2%
Cash-on-Cash Return
2.4%
Cap rate
0.4%
Rent to Value Ratio
Active
$280,000
2
bds
|
2
ba
|
916
sqft
|
built
1986
21340 NE 8th Ct, Miami, FL 33179
$-499
Cash flow
-9.3%
Cash-on-Cash Return
4.0%
Cap rate
0.8%
Rent to Value Ratio
Active
$170,900
1
bds
|
2
ba
|
830
sqft
|
built
1966
1000 NE 191st St, Miami, FL 33179
$-133
Cash flow
-4.1%
Cash-on-Cash Return
5.2%
Cap rate
1.1%
Rent to Value Ratio
Active
$509,999
3
bds
|
1
ba
|
1,006
sqft
|
built
1957
2100 NE Miami Gardens Dr, North Miami Beach, FL 33179
$-557
Cash flow
-5.7%
Cash-on-Cash Return
4.8%
Cap rate
0.6%
Rent to Value Ratio
Active
$315,000
2
bds
|
2
ba
|
1,586
sqft
|
built
1983
20840 San Simeon Way, Miami, FL 33179
$-759
Cash flow
-12.6%
Cash-on-Cash Return
3.3%
Cap rate
0.9%
Rent to Value Ratio
Active
$535,000
3
bds
|
3
ba
|
1,671
sqft
|
built
2014
360 NE 194th Ln, Miami, FL 33179
$-1,690
Cash flow
-16.5%
Cash-on-Cash Return
2.4%
Cap rate
0.7%
Rent to Value Ratio
Active
$169,000
1
bds
|
2
ba
|
861
sqft
|
built
1968
1301 NE Miami Gardens Dr, Miami, FL 33179
$-272
Cash flow
-8.4%
Cash-on-Cash Return
4.2%
Cap rate
1.1%
Rent to Value Ratio
Active
$310,000
2
bds
|
2
ba
|
1,135
sqft
|
built
1969
1175 NE Miami Gardens Dr, Miami, FL 33179
$-781
Cash flow
-13.1%
Cash-on-Cash Return
3.1%
Cap rate
0.8%
Rent to Value Ratio
Active
$1,349,000
4
bds
|
3
ba
|
2,300
sqft
|
built
1960
19930 NE 20th Ct, Miami, FL 33179
$-1,576
Cash flow
-6.1%
Cash-on-Cash Return
4.7%
Cap rate
0.7%
Rent to Value Ratio
Active
$839,900
3
bds
|
3
ba
|
2,002
sqft
|
built
1957
2155 NE Miami Gardens Dr, North Miami Beach, FL 33179
$-3,073
Cash flow
-19.1%
Cash-on-Cash Return
1.8%
Cap rate
0.4%
Rent to Value Ratio
Active
$159,999
1
bds
|
2
ba
|
861
sqft
|
built
1969
1351 NE Miami Gardens Dr, Miami, FL 33179
$194
Cash flow
6.3%
Cash-on-Cash Return
7.6%
Cap rate
1.1%
Rent to Value Ratio

Active
$189,900
1
bds
|
1
ba
|
825
sqft
|
built
1967
1350 NE 191st St, Miami, FL 33179
$-394
Cash flow
-10.8%
Cash-on-Cash Return
3.7%
Cap rate
0.9%
Rent to Value Ratio

Active
$279,000
2
bds
|
2
ba
|
1,400
sqft
|
built
1980
740 NE 199th St, Miami, FL 33179
$-709
Cash flow
-13.3%
Cash-on-Cash Return
3.1%
Cap rate
0.9%
Rent to Value Ratio
Active
$224,000
2
bds
|
2
ba
|
1,172
sqft
|
built
1973
661 NE 195th St, Miami, FL 33179
$-404
Cash flow
-9.4%
Cash-on-Cash Return
4.0%
Cap rate
1.0%
Rent to Value Ratio
Active
$294,200
2
bds
|
2
ba
|
1,140
sqft
|
built
1968
1301 NE Miami Gardens Dr, Miami, FL 33179
$-645
Cash flow
-11.4%
Cash-on-Cash Return
3.5%
Cap rate
0.8%
Rent to Value Ratio
Active
$157,500
1
bds
|
1
ba
|
830
sqft
|
built
1966
1150 NE 191st St, Miami, FL 33179
$-275
Cash flow
-9.1%
Cash-on-Cash Return
4.1%
Cap rate
1.1%
Rent to Value Ratio
Active
$289,900
2
bds
|
2
ba
|
1,140
sqft
|
built
1968
1301 NE Miami Gardens Dr, Miami, FL 33179
$-786
Cash flow
-14.1%
Cash-on-Cash Return
2.9%
Cap rate
0.8%
Rent to Value Ratio

Active
$179,000
1
bds
|
2
ba
|
861
sqft
|
built
1968
1301 NE Miami Gardens Dr, Miami, FL 33179
$-328
Cash flow
-9.6%
Cash-on-Cash Return
3.9%
Cap rate
1.0%
Rent to Value Ratio

Active
$239,000
2
bds
|
2
ba
|
829
sqft
|
built
1990
468 NE 206th Ln, Miami, FL 33179
$-301
Cash flow
-6.6%
Cash-on-Cash Return
4.6%
Cap rate
1.0%
Rent to Value Ratio

Active
$185,000
1
bds
|
2
ba
|
861
sqft
|
built
1969
1351 NE Miami Gardens Dr, Miami, FL 33179
$-198
Cash flow
-5.6%
Cash-on-Cash Return
4.9%
Cap rate
1.1%
Rent to Value Ratio
Active
$289,900
2
bds
|
2
ba
|
1,283
sqft
|
built
1975
1300 NE Miami Gardens Dr, Miami, FL 33179
$-540
Cash flow
-9.7%
Cash-on-Cash Return
3.9%
Cap rate
0.9%
Rent to Value Ratio

Active
$1,980,000
5
bds
|
3
ba
|
2,943
sqft
|
built
1971
2120 NE 204th St, Miami, FL 33179
$-3,282
Cash flow
-8.6%
Cash-on-Cash Return
4.2%
Cap rate
0.6%
Rent to Value Ratio

Active
$270,000
3
bds
|
2
ba
|
1,925
sqft
|
built
1969
800 NE 195th St, Miami, FL 33179
$-672
Cash flow
-13.0%
Cash-on-Cash Return
3.2%
Cap rate
1.1%
Rent to Value Ratio

Active
$1,125,000
5
bds
|
2
ba
|
2,014
sqft
|
built
1957
19321 NE 18th Pl, Miami, FL 33179
$-1,241
Cash flow
-5.8%
Cash-on-Cash Return
4.8%
Cap rate
0.6%
Rent to Value Ratio
Active
$215,000
1
bds
|
1
ba
|
801
sqft
|
built
1969
1351 NE Miami Gardens Dr, Miami, FL 33179
$-367
Cash flow
-8.9%
Cash-on-Cash Return
4.1%
Cap rate
0.8%
Rent to Value Ratio
Active
$199,000
1
bds
|
1
ba
|
801
sqft
|
built
1968
1301 NE Miami Gardens Dr, Miami, FL 33179
$-235
Cash flow
-6.2%
Cash-on-Cash Return
4.7%
Cap rate
1.0%
Rent to Value Ratio
Active
$210,000
1
bds
|
2
ba
|
898
sqft
|
built
1969
1501 NE 191st St, Miami, FL 33179
$-256
Cash flow
-6.4%
Cash-on-Cash Return
4.7%
Cap rate
0.9%
Rent to Value Ratio