33301 Investment Properties for Sale
Browse homes for sale and investment properties in 33301. Refine your search by price, property type, or more.
Best cash flowing properties in 33301
Active
$375,000
1
bds
|
1
ba
|
550
sqft
|
built
1963
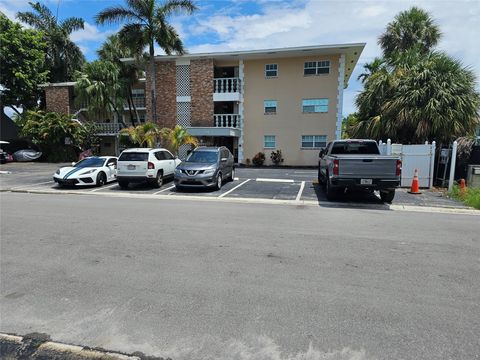
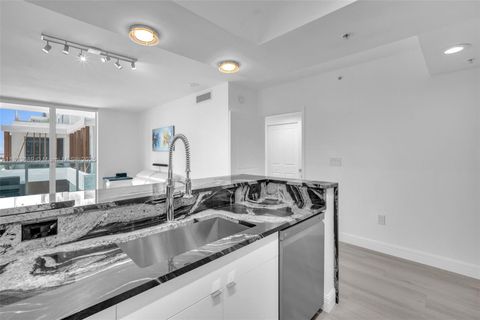
54 Isle Of Venice Dr, Fort Lauderdale, FL 33301
$-880
Cash flow
-12.2%
Cash-on-Cash Return
3.3%
Cap rate
0.5%
Rent to Value Ratio
Active
$279,999
1
bds
|
1
ba
|
816
sqft
|
built
2001
520 SE 5th Ave, Fort Lauderdale, FL 33301
$-930
Cash flow
-17.3%
Cash-on-Cash Return
2.2%
Cap rate
0.9%
Rent to Value Ratio
192 out of 215 properties for sale in 33301
Limited Results Shown
Create a free account, or log in to reveal all property listings and enjoy the complete experience.
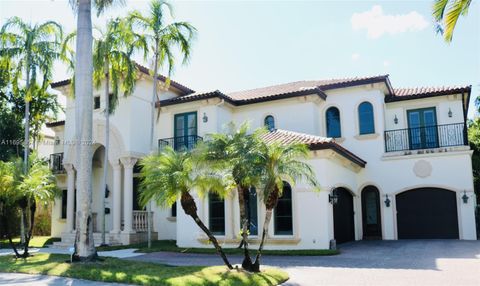
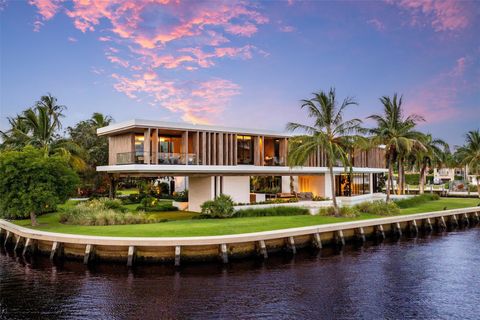
Active
$3,795,000
4
bds
|
4
ba
|
3,308
sqft
|
built
2017
21 Isle Of Venice Dr, Fort Lauderdale, FL 33301
$-14,775
Cash flow
-20.3%
Cash-on-Cash Return
1.5%
Cap rate
0.3%
Rent to Value Ratio
Active
$1,299,900
2
bds
|
3
ba
|
2,141
sqft
|
built
2005
333 Las Olas Way, Fort Lauderdale, FL 33301
$-5,372
Cash flow
-21.6%
Cash-on-Cash Return
1.2%
Cap rate
0.5%
Rent to Value Ratio
Active
$1,899,000
4
bds
|
3
ba
|
2,258
sqft
|
built
1940
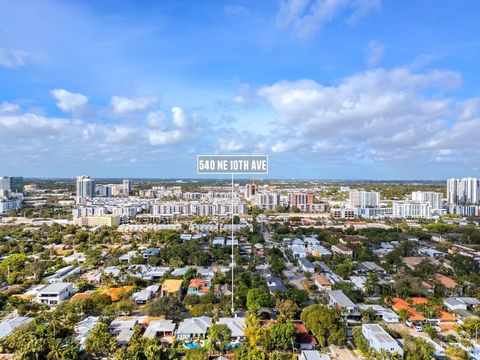
540 NE 10th Ave, Fort Lauderdale, FL 33301
$-2,869
Cash flow
-7.9%
Cash-on-Cash Return
4.3%
Cap rate
0.6%
Rent to Value Ratio
Active
$4,995,000
5
bds
|
6
ba
|
4,685
sqft
|
built
1956
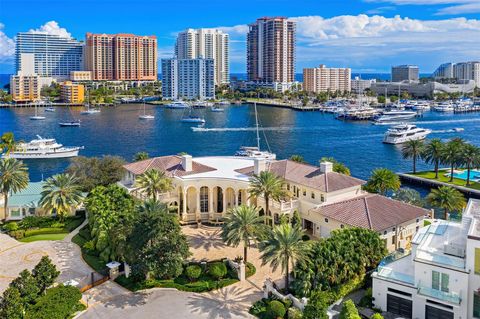
2625 Castilla Isle, Fort Lauderdale, FL 33301
$-23,339
Cash flow
-24.4%
Cash-on-Cash Return
0.5%
Cap rate
0.2%
Rent to Value Ratio

Active
$999,000
3
bds
|
2
ba
|
1,469
sqft
|
built
2004
347 N New River Dr E, Fort Lauderdale, FL 33301
$-2,119
Cash flow
-11.1%
Cash-on-Cash Return
3.6%
Cap rate
0.8%
Rent to Value Ratio
Active
$1,050,000
4
bds
|
4
ba
|
2,400
sqft
|
built
1997
1307 SE 2nd St, Fort Lauderdale, FL 33301
$-3,189
Cash flow
-15.8%
Cash-on-Cash Return
2.5%
Cap rate
0.5%
Rent to Value Ratio
Active
$599,900
2
bds
|
1
ba
|
1,052
sqft
|
built
2007
411 NW 1st Ave, Fort Lauderdale, FL 33301
$-1,981
Cash flow
-17.2%
Cash-on-Cash Return
2.2%
Cap rate
0.7%
Rent to Value Ratio
Active
$7,999,999
5
bds
|
8
ba
|
7,130
sqft
|
built
2004
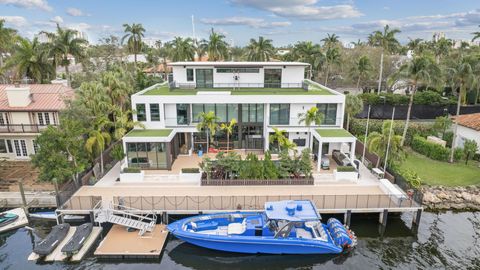
709 Isle Of Palms Dr, Fort Lauderdale, FL 33301
$-38,762
Cash flow
-25.3%
Cash-on-Cash Return
0.3%
Cap rate
0.1%
Rent to Value Ratio
Active
$1,350,000
4
bds
|
3
ba
|
1,870
sqft
|
built
1945
615 SE 11th Ave, Fort Lauderdale, FL 33301
$-2,559
Cash flow
-9.9%
Cash-on-Cash Return
3.9%
Cap rate
0.7%
Rent to Value Ratio
Active
$2,400,000
4
bds
|
4
ba
|
3,523
sqft
|
built
1938
1615 SE 4th St, Fort Lauderdale, FL 33301
$-6,874
Cash flow
-14.9%
Cash-on-Cash Return
2.7%
Cap rate
0.4%
Rent to Value Ratio
Active
$10,195,000
7
bds
|
8
ba
|
6,473
sqft
|
built
2020
31 Pelican Dr, Fort Lauderdale, FL 33301
$-55,009
Cash flow
-28.2%
Cash-on-Cash Return
-0.3%
Cap rate
0.1%
Rent to Value Ratio
Active
$1,995,000
3
bds
|
3
ba
|
2,395
sqft
|
built
2020
100 E Las Olas Blvd, Fort Lauderdale, FL 33301
$-9,498
Cash flow
-24.8%
Cash-on-Cash Return
0.4%
Cap rate
0.5%
Rent to Value Ratio
Active
$1,150,000
2
bds
|
2
ba
|
1,630
sqft
|
built
2005
411 N New River Dr E, Fort Lauderdale, FL 33301
$-4,616
Cash flow
-20.9%
Cash-on-Cash Return
1.3%
Cap rate
0.6%
Rent to Value Ratio
Active
$5,000,000
5
bds
|
4
ba
|
4,251
sqft
|
built
2003
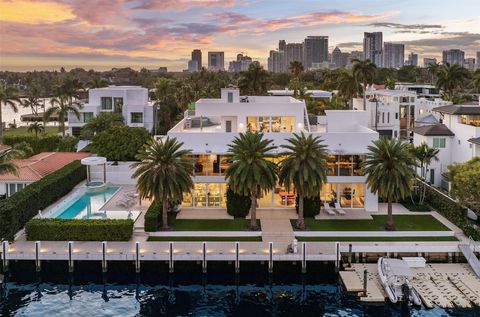
449 Isle Of Palms Dr, Fort Lauderdale, FL 33301
$-21,491
Cash flow
-22.4%
Cash-on-Cash Return
1.0%
Cap rate
0.2%
Rent to Value Ratio
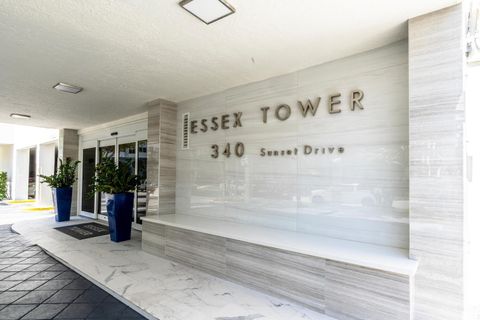
Active
$615,000
2
bds
|
2
ba
|
1,534
sqft
|
built
1971
340 Sunset Dr, Fort Lauderdale, FL 33301
$-2,194
Cash flow
-18.6%
Cash-on-Cash Return
1.9%
Cap rate
0.7%
Rent to Value Ratio

Active
$498,000
3
bds
|
2
ba
|
1,447
sqft
|
built
2001
520 SE 5th Ave, Fort Lauderdale, FL 33301
$-1,773
Cash flow
-18.6%
Cash-on-Cash Return
1.9%
Cap rate
0.6%
Rent to Value Ratio

Active
$1,695,000
3
bds
|
3
ba
|
2,635
sqft
|
built
2005
411 N New River Dr E, Fort Lauderdale, FL 33301
$-7,486
Cash flow
-23.0%
Cash-on-Cash Return
0.8%
Cap rate
0.5%
Rent to Value Ratio

Active
$469,000
2
bds
|
2
ba
|
1,155
sqft
|
built
2007
315 NE 3rd Ave, Fort Lauderdale, FL 33301
$-1,607
Cash flow
-17.9%
Cash-on-Cash Return
2.0%
Cap rate
0.8%
Rent to Value Ratio
Active
$49,995,000
6
bds
|
9
ba
|
9,995
sqft
|
built
2020
516 Mola Ave, Fort Lauderdale, FL 33301
$-265,224
Cash flow
-27.7%
Cash-on-Cash Return
-0.2%
Cap rate
0.0%
Rent to Value Ratio
Active
$475,000
2
bds
|
2
ba
|
1,306
sqft
|
built
1975
1212 SE 2nd Ct, Fort Lauderdale, FL 33301
$-1,665
Cash flow
-18.3%
Cash-on-Cash Return
1.9%
Cap rate
0.6%
Rent to Value Ratio

Active
$2,250,000
3
bds
|
4
ba
|
2,344
sqft
|
built
1978
359 SE 26th Ave, Fort Lauderdale, FL 33301
$-5,797
Cash flow
-13.4%
Cash-on-Cash Return
3.1%
Cap rate
0.4%
Rent to Value Ratio
Active
$460,000
2
bds
|
2
ba
|
1,245
sqft
|
built
2005
100 N Federal Hwy, Fort Lauderdale, FL 33301
$-2,178
Cash flow
-24.7%
Cash-on-Cash Return
0.5%
Cap rate
0.6%
Rent to Value Ratio
Active
$2,695,000
5
bds
|
4
ba
|
3,232
sqft
|
built
1924
921 SE 2nd St, Fort Lauderdale, FL 33301
$-8,316
Cash flow
-16.1%
Cash-on-Cash Return
2.4%
Cap rate
0.4%
Rent to Value Ratio
Active
$650,000
2
bds
|
2
ba
|
1,080
sqft
|
built
2004
347 N New River Dr E, Fort Lauderdale, FL 33301
$-2,283
Cash flow
-18.3%
Cash-on-Cash Return
1.9%
Cap rate
0.7%
Rent to Value Ratio

Active
$1,975,000
2
bds
|
3
ba
|
1,867
sqft
|
built
2020
100 E Las Olas Blvd, Fort Lauderdale, FL 33301
$-7,097
Cash flow
-18.7%
Cash-on-Cash Return
1.8%
Cap rate
0.6%
Rent to Value Ratio

Active
$469,000
2
bds
|
2
ba
|
1,100
sqft
|
built
1966
800 SE 4th St, Fort Lauderdale, FL 33301
$-1,976
Cash flow
-22.0%
Cash-on-Cash Return
1.1%
Cap rate
0.8%
Rent to Value Ratio
Active
$7,950,000
6
bds
|
9
ba
|
6,464
sqft
|
built
2020
633 Coral Way, Fort Lauderdale, FL 33301
$-42,188
Cash flow
-27.7%
Cash-on-Cash Return
-0.2%
Cap rate
0.1%
Rent to Value Ratio
Active
$25,000,000
6
bds
|
8
ba
|
10,216
sqft
|
built
1998
2 Pelican Dr, Fort Lauderdale, FL 33301
$-146,284
Cash flow
-30.5%
Cash-on-Cash Return
-0.9%
Cap rate
0.0%
Rent to Value Ratio
Active
$12,900,000
6
bds
|
8
ba
|
7,788
sqft
|
built
2015
500 Isle Of Capri Dr, Fort Lauderdale, FL 33301
$-66,283
Cash flow
-26.8%
Cash-on-Cash Return
0.0%
Cap rate
0.1%
Rent to Value Ratio
Active
$1,695,000
3
bds
|
4
ba
|
2,900
sqft
|
built
2005
411 N New River Dr E, Fort Lauderdale, FL 33301
$-7,643
Cash flow
-23.5%
Cash-on-Cash Return
0.7%
Cap rate
0.5%
Rent to Value Ratio