33324 Investment Properties for Sale
Browse homes for sale and investment properties in 33324. Refine your search by price, property type, or more.
Best cash flowing properties in 33324
Active
$194,999
2
bds
|
2
ba
|
1,100
sqft
|
built
1978
9420 Tangerine Pl, Davie, FL 33324
$-85
Cash flow
-2.3%
Cash-on-Cash Return
5.6%
Cap rate
1.1%
Rent to Value Ratio
Active
$200,000
1
bds
|
1
ba
|
734
sqft
|
built
1989
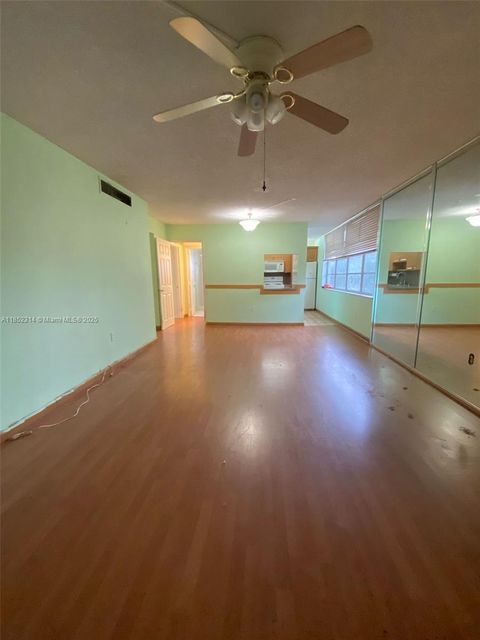
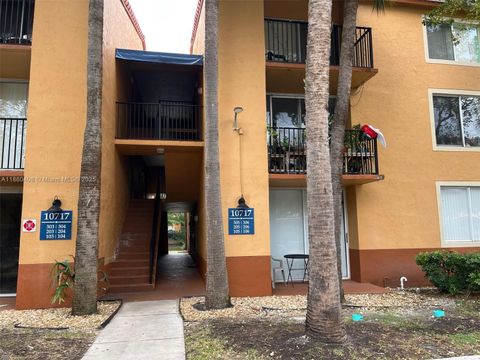
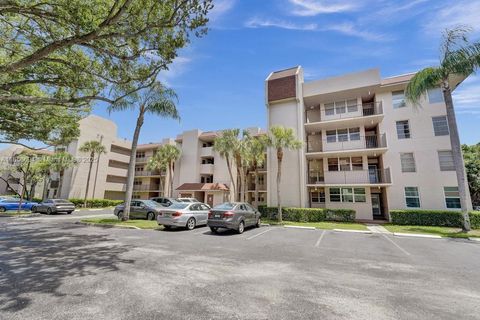
10717 Cleary Blvd, Plantation, FL 33324
$-322
Cash flow
-8.4%
Cash-on-Cash Return
4.2%
Cap rate
0.9%
Rent to Value Ratio
186 out of 223 properties for sale in 33324
Limited Results Shown
Create a free account, or log in to reveal all property listings and enjoy the complete experience.
Active
$189,900
1
bds
|
2
ba
|
764
sqft
|
built
1985
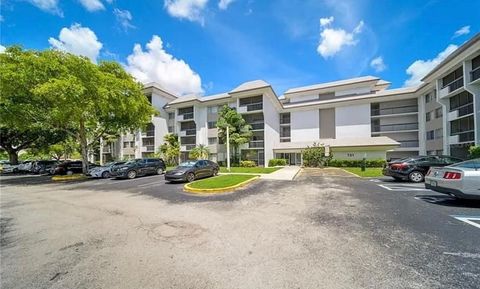
721 N Pine Island Rd, Plantation, FL 33324
$-376
Cash flow
-10.3%
Cash-on-Cash Return
3.8%
Cap rate
0.9%
Rent to Value Ratio
Active
$255,000
2
bds
|
2
ba
|
950
sqft
|
built
1974
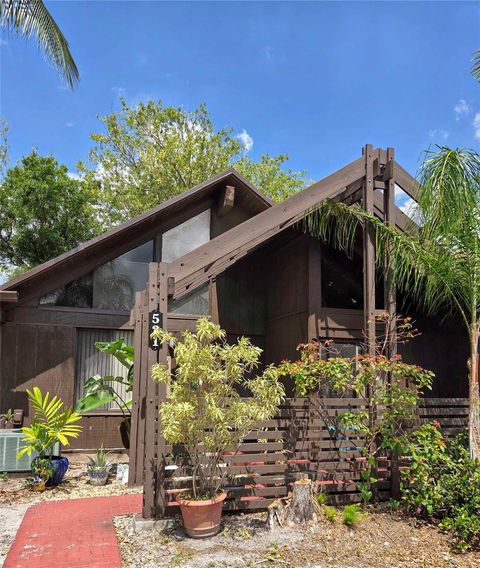
9471 Evergreen Pl, Davie, FL 33324
$-353
Cash flow
-7.2%
Cash-on-Cash Return
4.5%
Cap rate
1.0%
Rent to Value Ratio
Active
$359,990
2
bds
|
2
ba
|
1,272
sqft
|
built
1986
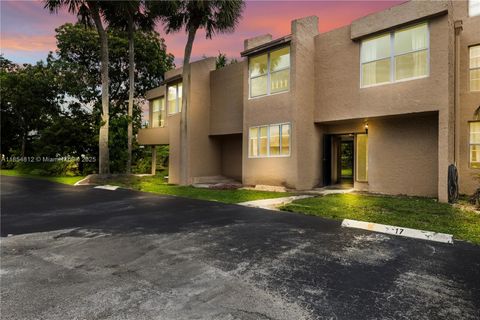
123 NW 98th Ter, Plantation, FL 33324
$-1,088
Cash flow
-15.8%
Cash-on-Cash Return
2.5%
Cap rate
0.7%
Rent to Value Ratio
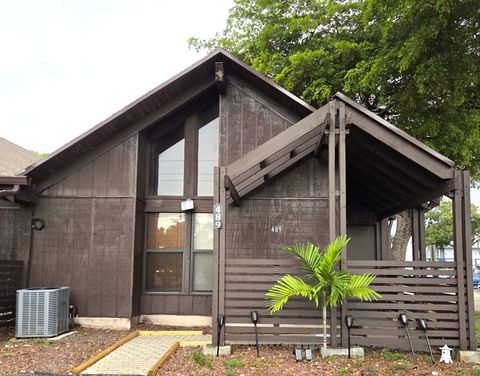
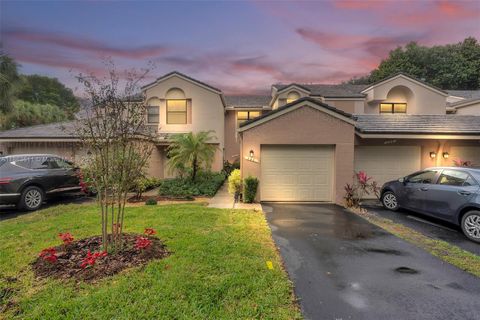
Active
$359,000
3
bds
|
2
ba
|
1,756
sqft
|
built
1978
489 N University Dr, Plantation, FL 33324
$-1,013
Cash flow
-14.7%
Cash-on-Cash Return
2.8%
Cap rate
0.9%
Rent to Value Ratio
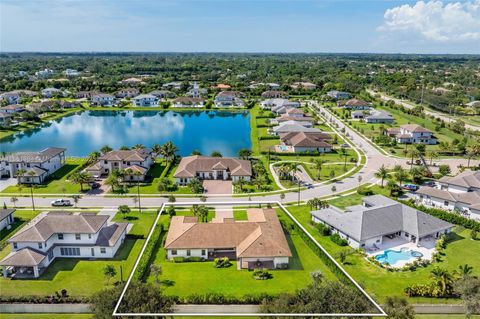
Active
$2,200,000
5
bds
|
5
ba
|
4,074
sqft
|
built
2022
11125 N Sierra Ranch Dr, Davie, FL 33324
$-7,095
Cash flow
-16.8%
Cash-on-Cash Return
2.3%
Cap rate
0.5%
Rent to Value Ratio
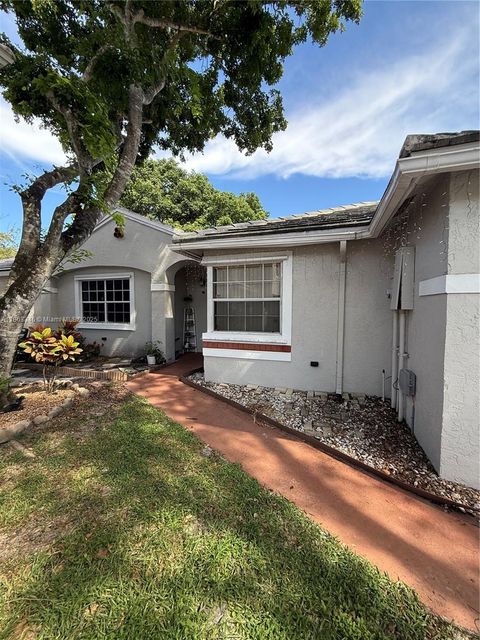
Active
$435,000
3
bds
|
2
ba
|
1,376
sqft
|
built
1987
9834 NW 2nd Ct, Plantation, FL 33324
$-751
Cash flow
-9.0%
Cash-on-Cash Return
4.1%
Cap rate
0.8%
Rent to Value Ratio

Active
$434,000
3
bds
|
3
ba
|
2,170
sqft
|
built
1975
9713 N New River Canal Rd, Plantation, FL 33324
$-925
Cash flow
-11.1%
Cash-on-Cash Return
3.6%
Cap rate
0.8%
Rent to Value Ratio

Active
$429,000
3
bds
|
2
ba
|
1,495
sqft
|
built
2007
510 NW 84th Ave, Plantation, FL 33324
$-2,114
Cash flow
-25.7%
Cash-on-Cash Return
0.2%
Cap rate
0.8%
Rent to Value Ratio
Active
$194,500
2
bds
|
2
ba
|
970
sqft
|
built
1978
9420 Poinciana Pl, Davie, FL 33324
$-559
Cash flow
-15.0%
Cash-on-Cash Return
2.7%
Cap rate
1.0%
Rent to Value Ratio
Active
$475,000
3
bds
|
2
ba
|
1,432
sqft
|
built
1980
851 NW 79th Ter, Plantation, FL 33324
$-1,053
Cash flow
-11.6%
Cash-on-Cash Return
3.5%
Cap rate
0.6%
Rent to Value Ratio
Active
$535,000
3
bds
|
3
ba
|
1,648
sqft
|
built
1997
1683 SW 109th Ter, Davie, FL 33324
$-1,260
Cash flow
-12.3%
Cash-on-Cash Return
3.3%
Cap rate
0.7%
Rent to Value Ratio
Active
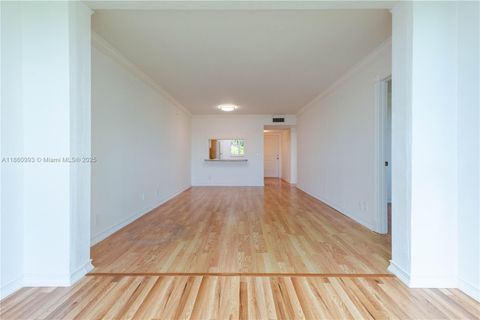
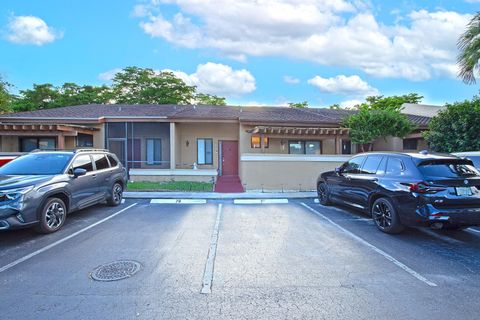
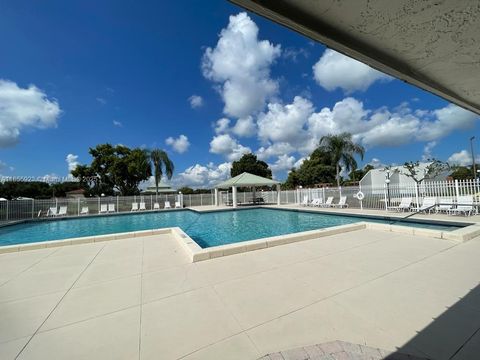
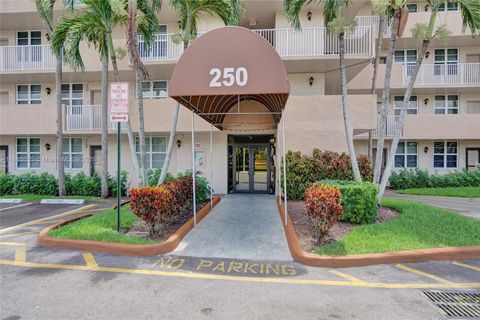
$219,500
2
bds
|
2
ba
|
1,015
sqft
|
built
1976
250 Jacaranda Dr, Plantation, FL 33324
$-401
Cash flow
-9.5%
Cash-on-Cash Return
4.0%
Cap rate
1.0%
Rent to Value Ratio
Active
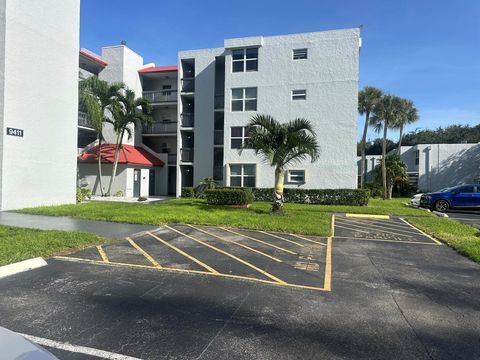
$218,000
2
bds
|
2
ba
|
775
sqft
|
built
1974
9411 Evergreen Pl, Davie, FL 33324
$-390
Cash flow
-9.3%
Cash-on-Cash Return
4.0%
Cap rate
1.0%
Rent to Value Ratio
Active
$349,900
2
bds
|
2
ba
|
1,380
sqft
|
built
1981
2131 SW 92nd Ter, Davie, FL 33324
$-1,026
Cash flow
-15.3%
Cash-on-Cash Return
2.6%
Cap rate
0.7%
Rent to Value Ratio
Active
$239,000
2
bds
|
2
ba
|
950
sqft
|
built
1974
9440 Live Oak Pl, Davie, FL 33324
$-752
Cash flow
-16.4%
Cash-on-Cash Return
2.4%
Cap rate
0.8%
Rent to Value Ratio
Active
$585,000
3
bds
|
2
ba
|
1,727
sqft
|
built
1981
1237 SW 87th Ter, Plantation, FL 33324
$-969
Cash flow
-8.6%
Cash-on-Cash Return
4.2%
Cap rate
0.7%
Rent to Value Ratio
Active
$309,000
2
bds
|
2
ba
|
1,030
sqft
|
built
1978
521 N University Dr, Plantation, FL 33324
$-824
Cash flow
-13.9%
Cash-on-Cash Return
2.9%
Cap rate
0.7%
Rent to Value Ratio
Active
$255,000
3
bds
|
2
ba
|
1,155
sqft
|
built
1984
9520 Seagrape Dr, Davie, FL 33324
$-707
Cash flow
-14.5%
Cash-on-Cash Return
2.8%
Cap rate
1.0%
Rent to Value Ratio
Active
$239,900
2
bds
|
2
ba
|
1,057
sqft
|
built
1985
721 N Pine Island Rd, Plantation, FL 33324
$-592
Cash flow
-12.9%
Cash-on-Cash Return
3.2%
Cap rate
0.9%
Rent to Value Ratio

Active
$200,000
1
bds
|
1
ba
|
734
sqft
|
built
1989
10717 Cleary Blvd, Plantation, FL 33324
$-366
Cash flow
-9.5%
Cash-on-Cash Return
3.9%
Cap rate
0.9%
Rent to Value Ratio

Active
$350,000
3
bds
|
3
ba
|
2,120
sqft
|
built
1974
701 E Coco Plum Cir, Plantation, FL 33324
$-420
Cash flow
-6.3%
Cash-on-Cash Return
4.7%
Cap rate
0.9%
Rent to Value Ratio
Active
$395,000
4
bds
|
3
ba
|
1,250
sqft
|
built
1974
9450 Live Oak Pl, Davie, FL 33324
$-1,450
Cash flow
-19.2%
Cash-on-Cash Return
1.7%
Cap rate
0.6%
Rent to Value Ratio

Active
$350,000
2
bds
|
3
ba
|
1,110
sqft
|
built
1996
156 SW 96th Ave, Plantation, FL 33324
$-643
Cash flow
-9.6%
Cash-on-Cash Return
3.9%
Cap rate
0.7%
Rent to Value Ratio
Active
$345,000
3
bds
|
3
ba
|
1,630
sqft
|
built
1983
1805 SW 81st Ave, Davie, FL 33324
$-924
Cash flow
-14.0%
Cash-on-Cash Return
2.9%
Cap rate
0.8%
Rent to Value Ratio
Active
$185,000
2
bds
|
2
ba
|
980
sqft
|
built
1978
9450 Poinciana Pl, Davie, FL 33324
$-497
Cash flow
-14.0%
Cash-on-Cash Return
2.9%
Cap rate
1.1%
Rent to Value Ratio
Active
$198,000
1
bds
|
1
ba
|
665
sqft
|
built
1972
405 S Pine Island Rd, Plantation, FL 33324
$-420
Cash flow
-11.1%
Cash-on-Cash Return
3.6%
Cap rate
0.9%
Rent to Value Ratio
Active
$512,000
3
bds
|
3
ba
|
1,494
sqft
|
built
1988
9925 NW 9th Ct, Plantation, FL 33324
$-1,007
Cash flow
-10.3%
Cash-on-Cash Return
3.8%
Cap rate
0.7%
Rent to Value Ratio
Active
$208,000
2
bds
|
2
ba
|
965
sqft
|
built
1974
9431 Live Oak Pl, Davie, FL 33324
$-610
Cash flow
-15.3%
Cash-on-Cash Return
2.6%
Cap rate
1.0%
Rent to Value Ratio

Active
$1,899,999
5
bds
|
4
ba
|
3,076
sqft
|
built
2005
11098 Canary Island Ct, Plantation, FL 33324
$-4,940
Cash flow
-13.6%
Cash-on-Cash Return
3.0%
Cap rate
0.6%
Rent to Value Ratio

Active
$698,000
4
bds
|
3
ba
|
2,264
sqft
|
built
1998
10714 SW 17th Pl, Davie, FL 33324
$-1,068
Cash flow
-8.0%
Cash-on-Cash Return
4.3%
Cap rate
0.6%
Rent to Value Ratio
Active
$154,900
1
bds
|
2
ba
|
940
sqft
|
built
1979
9235 Lagoon Pl, Davie, FL 33324
$-479
Cash flow
-16.1%
Cash-on-Cash Return
2.4%
Cap rate
1.0%
Rent to Value Ratio

Active
$385,000
4
bds
|
3
ba
|
2,170
sqft
|
built
1975
9713 N New River Canal Rd, Plantation, FL 33324
$-1,124
Cash flow
-15.2%
Cash-on-Cash Return
2.6%
Cap rate
0.9%
Rent to Value Ratio
Active
$551,500
3
bds
|
2
ba
|
1,652
sqft
|
built
1990
10180 NW 5th St, Plantation, FL 33324
$-779
Cash flow
-7.4%
Cash-on-Cash Return
4.5%
Cap rate
0.7%
Rent to Value Ratio
Active
$235,000
2
bds
|
2
ba
|
950
sqft
|
built
1974
9491 Evergreen Pl, Davie, FL 33324
$-501
Cash flow
-11.1%
Cash-on-Cash Return
3.6%
Cap rate
1.0%
Rent to Value Ratio
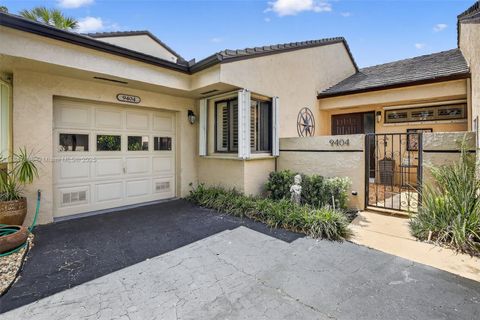
Active
$442,000
2
bds
|
2
ba
|
1,138
sqft
|
built
1986
9404 Chelsea Dr N, Plantation, FL 33324
$-956
Cash flow
-11.3%
Cash-on-Cash Return
3.6%
Cap rate
0.6%
Rent to Value Ratio
Active
$310,000
3
bds
|
2
ba
|
1,385
sqft
|
built
1983
1719 Whitehall Dr, Davie, FL 33324
$-497
Cash flow
-8.4%
Cash-on-Cash Return
4.2%
Cap rate
0.9%
Rent to Value Ratio
Active
$289,900
3
bds
|
2
ba
|
1,155
sqft
|
built
1983
1920 Sabal Palm Dr, Davie, FL 33324
$-732
Cash flow
-13.2%
Cash-on-Cash Return
3.1%
Cap rate
0.9%
Rent to Value Ratio
Active
$330,000
2
bds
|
2
ba
|
1,385
sqft
|
built
1983
1518 Whitehall Dr, Davie, FL 33324
$-708
Cash flow
-11.2%
Cash-on-Cash Return
3.6%
Cap rate
0.8%
Rent to Value Ratio